. 2016 Oct 3;126(10):3999-4015.
doi: 10.1172/JCI88241. Epub 2016 Sep 19.

Axial tubule junctions control rapid calcium signaling in atria

Axial tubule junctions control rapid calcium signaling in atria

Sören Brandenburg et al. J Clin Invest. .

Abstract

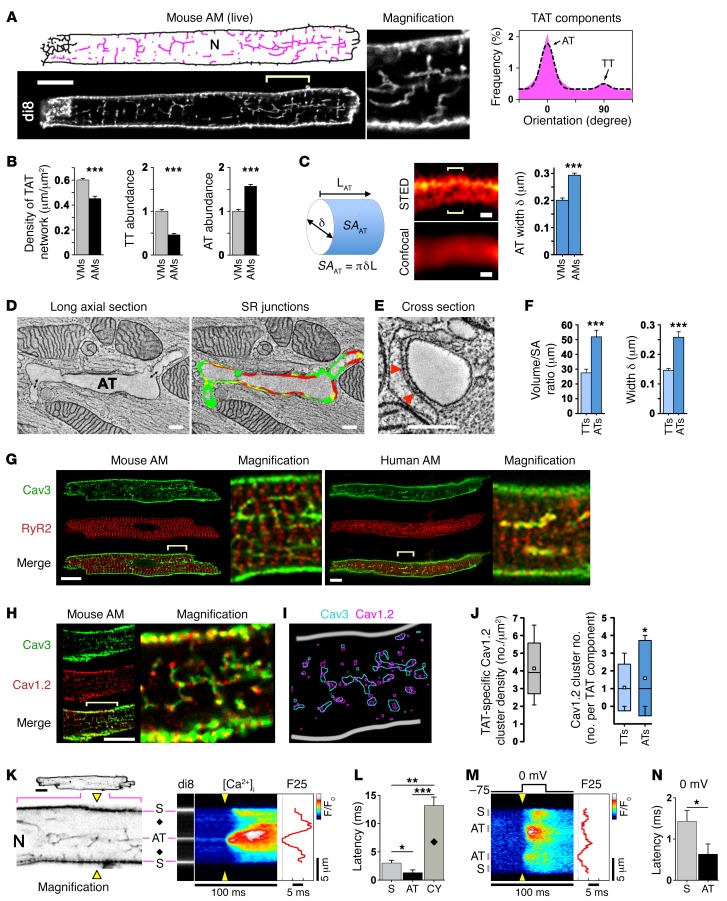
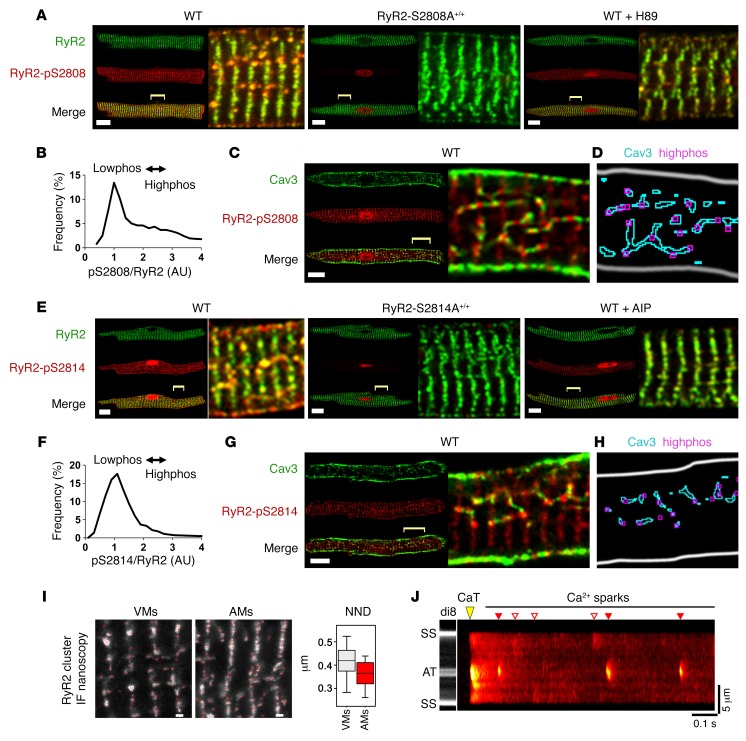
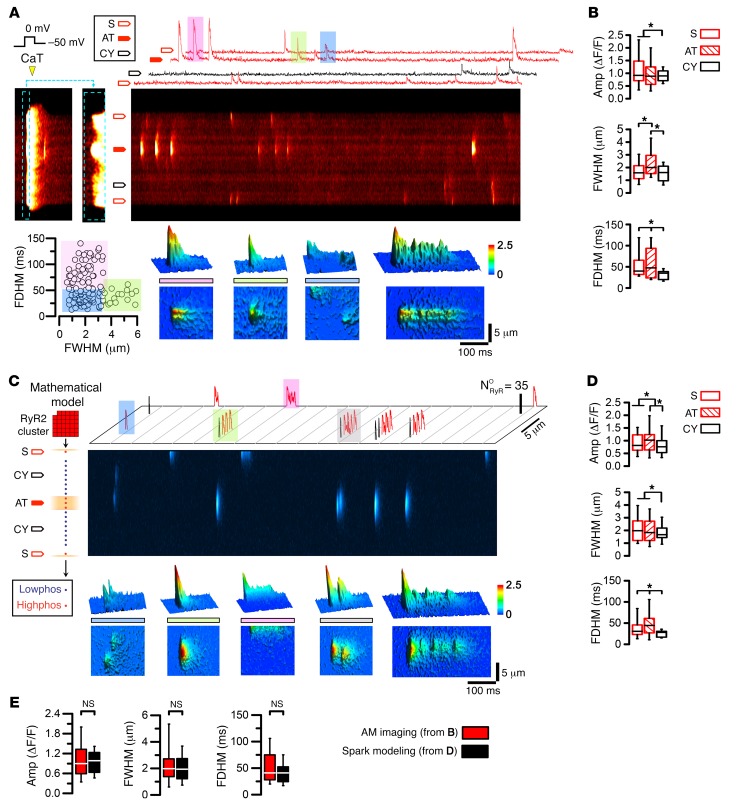
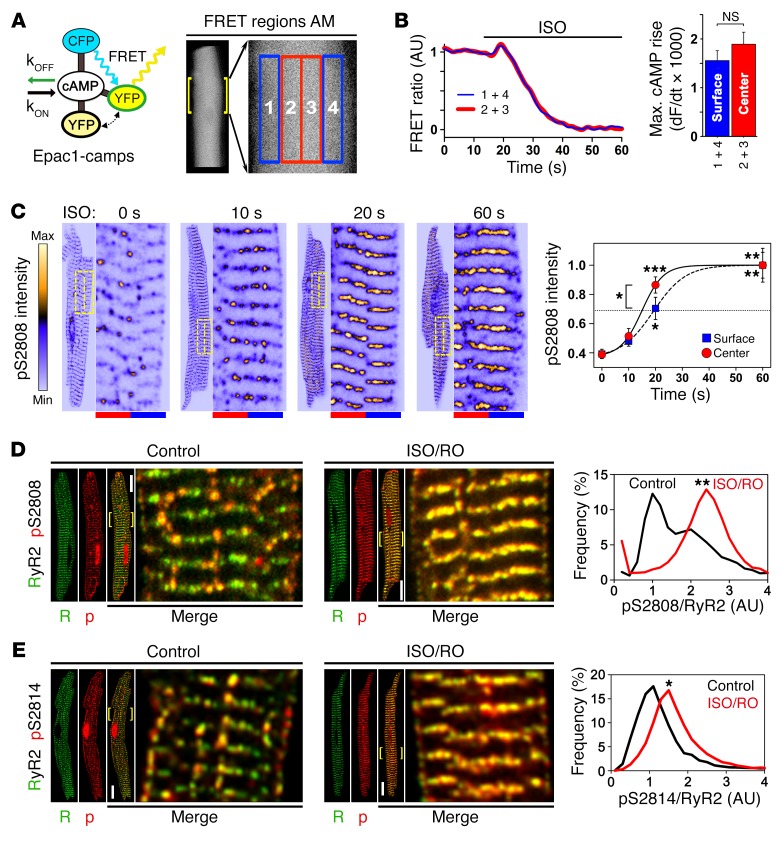
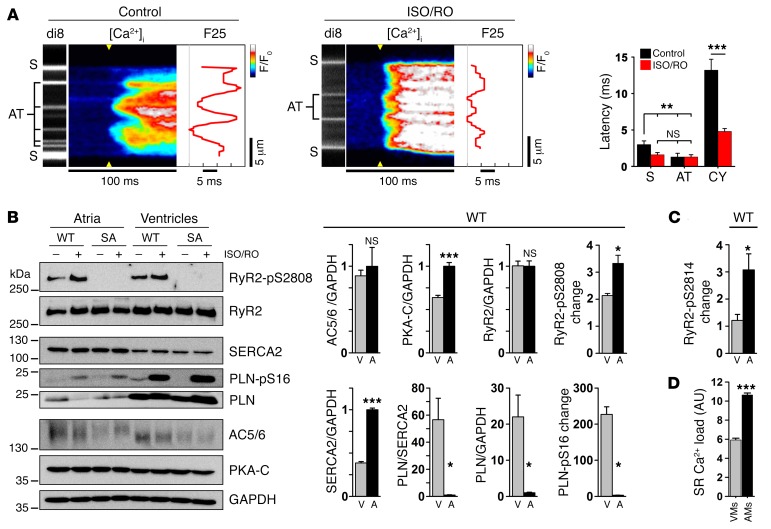
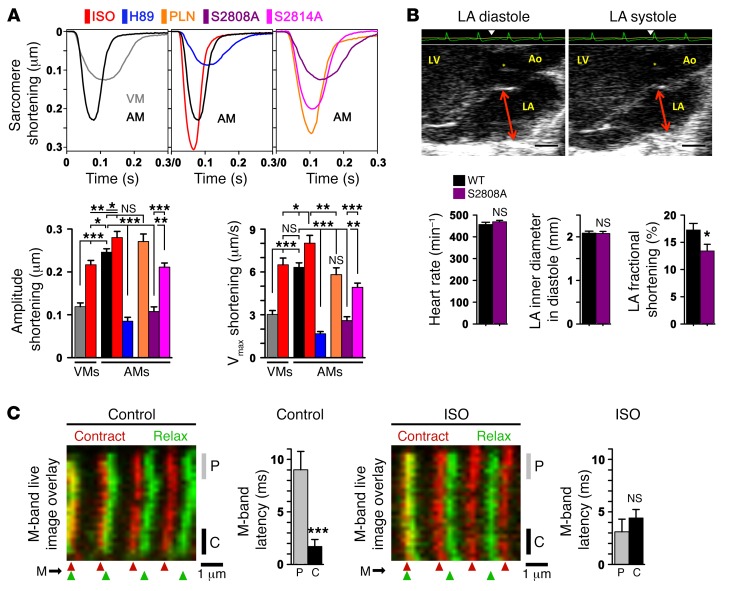
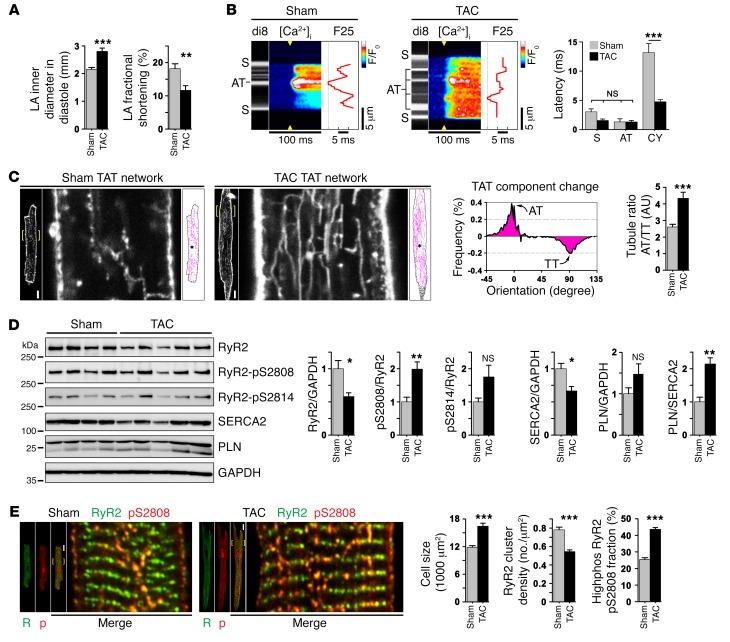
The canonical atrial myocyte (AM) is characterized by sparse transverse tubule (TT) invaginations and slow intracellular Ca2+ propagation but exhibits rapid contractile activation that is susceptible to loss of function during hypertrophic remodeling. Here, we have identified a membrane structure and Ca2+-signaling complex that may enhance the speed of atrial contraction independently of phospholamban regulation. This axial couplon was observed in human and mouse atria and is composed of voluminous axial tubules (ATs) with extensive junctions to the sarcoplasmic reticulum (SR) that include ryanodine receptor 2 (RyR2) clusters. In mouse AM, AT structures triggered Ca2+ release from the SR approximately 2 times faster at the AM center than at the surface. Rapid Ca2+ release correlated with colocalization of highly phosphorylated RyR2 clusters at AT-SR junctions and earlier, more rapid shortening of central sarcomeres. In contrast, mice expressing phosphorylation-incompetent RyR2 displayed depressed AM sarcomere shortening and reduced in vivo atrial contractile function. Moreover, left atrial hypertrophy led to AT proliferation, with a marked increase in the highly phosphorylated RyR2-pS2808 cluster fraction, thereby maintaining cytosolic Ca2+ signaling despite decreases in RyR2 cluster density and RyR2 protein expression. AT couplon "super-hubs" thus underlie faster excitation-contraction coupling in health as well as hypertrophic compensatory adaptation and represent a structural and metabolic mechanism that may contribute to contractile dysfunction and arrhythmias.


Figures

Figure 1
Figure 1. Abundant AT structures rapidly activate Ca2+ release.
(A) Confocal live imaging of di-8-ANEPPS–stained (di8) TAT structures visualized as skeletons (pink). N, nucleus. Scale bar: 10 μm. TAT component orientations (histogram) and Gaussian fitting show abundant AT (0°) versus sparse TT (90°) components (binning ± 20°). n = 36 AMs. (B) Comparison of ventricular versus atrial TAT network length normalized to cell area; TT and AT component abundance. n = 36 AMs and 25 VMs. (C) Illustration conceptualizing AT width (δ) measurements and calculated surface area (SA). L, length. AT width was determined from local STED signal distributions of optical cross sections (brackets) and is summarized in the bar graph. Scale bars: 200 nm. n = 27 VMs, 30 AMs. (D) Double-headed arrows indicate potential AT-TT connections; ET images and segmentation of longitudinally sectioned and (E) cross-sectioned AT structures. Scale bars: 200 nm. Color legend – red, AT-SR junctions ≤ 15nm in gap width and containing RyR2 densities; yellow, AT-SR junctions ≤ 20nm in gap width but lacking RyR2 densities; green, membrane area with no apparent junctions. AT-TT junction; for color rendering, see Supplemental Figure 4. Arrows indicate exemplary electron densities compatible with RyR2 channels. (F) Bar graphs comparing TT versus AT volume/surface area ratio and width. n = 13 TTs, 23 ATs. Data are representative of 3 hearts. (G and H) Confocal images of Cav3-, RyR2-, and Cav1.2-coimmunostained mouse and human AMs. Robust Cav3-labeled AT structures in human and mouse AMs. Scale bars: 10 μm, magnification ×4. Yellow brackets indicate regions magnified. (I) Image segmentation. (J) Box plots summarizing TAT-specific Cav1.2 cluster density; component-specific Cav1.2 cluster numbers. White boxes indicate the mean; boxes represent the 50th percentile and lower and upper SD, and whiskers represent the 10th and 90th percentiles. n = 17 AMs. (K) Confocal visualization (negative contrast) of AT structures for transversal line scanning (yellow triangles) of intracellular Ca2+ (fluo-4) magnification ×4: field potential–evoked Ca2+ transient activated via AT and subsurface (S) structures; black diamonds, off-membrane CY; F25, Ca2+ signal onset at 25% signal amplitude; F/F0, Normalized fluorescence intensity ratio indicated by look-up-table; N, nucleus. (L) Relative latency of early Ca2+ signal upstroke (dF/dt) for the indicated locations. Data are representative of 19 AMs. (M) Voltage-clamped AMs (1 mM EGTA) during Ca2+ transient activation. F25, Ca2+ signal onset during –75 to 0 mV depolarization. (N) Latency difference of Ca2+ signal upstroke (dF/dt). n = 15 AMs. *P < 0.05, **P < 0.01, and ***P < 0.001, by Student’s t test (AF, KN) and Mann-Whitney U test (J).
Figure 2
Figure 2. ATs and junctions with RyR2 clusters are common in human tissue.
Dual-color STED nanoscopy of 2 human LA tissue sections coimmunostained for Cav3 and RyR2. (A) Tissue section shows AMs aligned with capillaries (asterisks indicate the lumens). Magnified images (of red boxed area) show 1 Cav3-labeled AT membrane structure (arrowhead), which intersects with 6 transversal rows of RyR2 clusters delimited by the surface membrane on top. Scale bars: overview 10 μm; magnifications, 2 μm. (B) Intracellular high-power magnifications showing 2 parallel, axially aligned RyR2 cluster tracks, perpendicularly intersecting 6 transversal RyR2 rows. Arrowheads identify exemplary RyR2 clusters with typical axial couplon architectures. RyR2 clusters with elongated axial morphologies and Cav3-labeled structures are tightly spaced next to each other, indicating a functional role of AT-associated SR junctions. STED images are representative of 5 human LA samples. Scale bar: 2 μm.
Figure 3
Figure 3. Differential regulation of RyR2 cluster phosphorylation.
(A) AMs coimmunostained for RyR2- and PKA-phosphorylated RyR2-pS2808. WT: highphos RyR2 clusters (yellow) aligned in central-axial string-of-pearls, intersecting transverse striations of lowphos RyR2 clusters (green); RyR2-S2808A+/+: zero PKA phosphorylation of RyR2 clusters, confirming phospho-epitope–specific labeling; WT + H89: attenuated highphos RyR2 cluster signals. Scale bars: 10 μm; magnified (×4) regions are indicated by yellow brackets. (B) Histogram showing bimodal frequency distribution of in situ pS2808/RyR2 normalized cluster signals in untreated WT AMs. The main peak indicates abundant lowphos versus fewer highphos RyR2 clusters represented by the shoulder. n = 22 AMs. (C) AMs colabeled for Cav3 and RyR2-pS2808. Highphos RyR2-pS2808 clusters alternated with Cav3 clusters in central AT structures. Scale bar: 10 μm; magnification ×4. (D) Image segmentation confirming highphos RyR2-pS2808 clusters aligned with Cav3-labeled TAT structures. (E) WT, RyR2-S2814A+/+, and WT AMs treated with the CaMK inhibitor AIP were coimmunostained for RyR2 and the CaMK-phosphorylated epitope RyR2-pS2814. Note the central highphos RyR2 clusters (yellow) versus lowphos RyR2 clusters (green). AMs from CaMK phosphorylation–incompetent RyR2-S2814A+/+ mice showed no CaMK phosphorylation in situ. Magnifcation ×4. (F) Frequency histogram of the pS2814/RyR2 cluster distribution indicating abundant lowphos versus few highphos RyR2 clusters in control AMs. n = 19 AMs. (G) AMs coimmunostained for Cav3 and RyR2-pS2814. Highphos RyR2 clusters were associated with Cav3-labeled AT structures as confirmed by image segmentation (H). Scale bar: 10 μm, magnifcation ×4. (I) STED images comparing immunolabeled central RyR2 clusters in VMs versus AMs. Atrial RyR2 clusters identified by red circles show a higher density on Z-lines and a trend toward overall shorter NNDs. Images are representative of 18 VMs and 19 AMs. Scale bars: 500 nm. Box and whisker plot: boxes show lower and upper quartiles; whiskers represent the 5th and 95th percentiles. IF, immunofluorescence. (J) Confocal live AM imaging with di-8-ANEPPS and fluo-4 showing large AT-localized Ca2+ sparks occurring repeatedly. CaT, final 1-Hz pacing evoked Ca2+ transient; red triangles indicate AT-associated Ca2+ sparks; white triangles indicate surface membrane–associated Ca2+ sparks.
Figure 4
Figure 4. Ca2+ macro-sparks at AT sites are reproduced by RyR2 cluster modeling.
(A) The final of 5 consecutive Ca2+ transients of a voltage-clamped AM (1-Hz pacing) during depolarization from –75 to 0 mV was magnified (corresponding dashed-line boxes) to visualize early Ca2+ signal onset locally. Block arrows indicate different Ca2+ spark locations at –50 mV, including off-membrane cytosolic sites (CY). Top 2D traces show Ca2+ spark events at AT, S, and CY locations, and examples highlighted by color are magnified by corresponding 3D surface plots (bottom panels): macro-spark (pink), ember (green), classic Ca2+ sparks (blue), and regenerative macro-sparks. Dot plot correlating Ca2+ spark full duration at half maximum (FDHM) and full width at half maximum (FWHM) to segregate classic (blue) from macro-sparks (green) and embers (pink). (B) Box plots comparing Ca2+ spark amplitude (Amp), FWHM, and FDHM in different locations. *P < 0.05, by ANOVA. (C) Atrial Ca2+ spark model composed of 1 transversal RyR2 cluster row. The indicated AT and S structures were associated with junctional highphos RyR2 clusters. Each cluster contained 35 RyR2 channels stochastically activated at –50 mV; both highphos and lowphos RyR2 clusters initiated SR Ca2+ release. Mathematical modeling generated the stochastic open time profiles of individual RyR2 channels for each cluster, which was used to calculate line-scan images of Ca2+ sparks with confocal resolution. Ca2+ sparks presented as 2D-flattened images (top) are highlighted by color, and the corresponding 3D surface plots are shown (bottom): classic Ca2+ sparks (blue), macro-spark (green), ember (pink), and regenerative macro-sparks (gray). NORyR, number of open RyR2 channels. (D) Box and whisker plots comparing Ca2+ spark amplitude, FWHM, and FDHM as the average modeling output. (E) Comparing the aggregate properties of calcium sparks show no significant differences between the AM imaging results and spark modeling output. *P < 0.05, by ANOVA (B and D). Box and whisker plots: boxes show lower and upper quartile; whiskers show the 5th and 95th percentiles.
Figure 5
Figure 5. In situ regulation of atrial RyR2 cluster phosphorylation.
(A) Illustration showing cAMP-dependent responses of Epac1-camps, a ubiquitous cytosolic FRET sensor, during live-cell measurements. In AMs, signals from 4 transversally distributed FRET regions were sampled and signal averaged pairwise for corresponding central (2 + 3, red) versus surface (1 + 4, blue) regions. kOFF, cAMP dissociation constant; kON, cAMP association constant; CFP, cyan fluorescent protein; YFP, yellow fluorescent protein. (B) FRET ratio traces show the same spatiotemporal AM response to 0.1 μM ISO stimulation during increasing intracellular cAMP generation. Bar graph comparing the maximal rate of cAMP rise shows no significant difference between AM center and surface. NS, by Student’s t test. n = 12 AMs. (C) Confocal time series showing progressive RyR2-S2808 cluster phosphorylation following up to 60 seconds of β-adrenergic stimulation (1 μM ISO). RyR2-pS2808 cluster signals were averaged from 10 striations (see magnifications) through equal-sized central (red) and surface (blue) regions indicated by dashed-line yellow boxes. RyR2-pS2808 intensity plot shows progressive cluster phosphorylation, which was significantly faster for central AM regions after a 20-second ISO stimulation. Each time point represents 7 AM experiments. *P < 0.05, **P < 0.01, and ***P < 0.001, by ANOVA. (D and E) Maximal stimulation by combined ISO/RO (1 μM/10 μM) treatment converted lowphos into highphos RyR2 clusters. (D) Histogram shows bimodal pS2808-RyR2 cluster signal pattern under control conditions (black trace), resulting in a profound change of the lowphos RyR2 cluster signals by ISO/RO treatment: 1 major highphos peak, consistent with complete lowphos cluster conversion (red trace). **P < 0.01, by Mann-Whitney U test. Dara are representative of 13 control-treated and 18 ISO/RO-treated AMs. Scale bars: 10 μM, magnification ×4. (E) Images and histogram showing a distinct pS2814/RyR2 cluster phosphorylation shift after ISO/RO stimulation (note: control data are the same as in Figure 3F). *P < 0.05, by Mann-Whitney U test. Data are representative of 19 control-treated and 12 ISO/RO-treated AMs. Scale bars: 10 μM, magnification ×4.
Figure 6
Figure 6. Catecholaminergic stimulation accelerates atrial Ca2+ signaling.
(A) Live imaging of AT and S membrane structures during Ca2+ transient onset in control- versus ISO/RO-treated AMs (0.5-Hz pacing). ISO/RO treatment accelerated transversal Ca2+ release propagation across the cytosol, compressing the F25 profile through a decreased cytosolic (CY) latency of early Ca2+ release (dF/dt). Data are representative of 9 control- and 17 ISO/RO-treated AMs. **P < 0.01 and ***P < 0.001, by Student’s t test. (B) Immunoblots comparing ISO/RO-treated (1 μM/10 μM) atrial (A) tissue from WT and phosphorylation-incompetent RyR2-S2808A+/+ mouse hearts; ventricular (V) tissue was compared for reference. In WT atria, significantly higher expression levels of both PKA-C and SERCA2 were detected, in contrast to significantly lower PLN levels. Atrial versus ventricular PKA phosphorylation changes were significantly increased for the RyR2-S2808 site, but not for the PLN-S16 site. Note the similar AC5/6 and RyR2 protein levels. Blots are representative of 3 individual experiments (see Supplemental Figure 10 for uncut blots). (C) Analogous RyR2-S2814–specific immunoblotting established in CaMK phosphorylation–incompetent RyR2-S2814A+/+ mouse hearts (see also Supplemental Figures 12A and 12B). Bar graph shows a significantly increased atrial RyR2-S2814 phosphorylation change in atrial tissue after ISO/RO (1 μM/10 μM) treatment. (D) SR Ca2+ load was significantly higher in AMs than in VMs measured with caffeine (10 mM). n = 8 AMs, 9 VMs. *P < 0.05 and ***P < 0.001, by Student’s t test.
Figure 7
Figure 7. Catecholaminergic RyR2 cluster recruitment regulates sarcomere shortening and atrial contractility.
(A) Representative AM sarcomere length traces during unloaded shortening; colors at top indicate the different conditions; VMs were used as a reference. The same WT AM control trace (black) is presented twice for comparison. WT AMs were treated with ISO (1 μM) or H89 (1 μM) and compared with RyR2-S2808A+/+-knockin, RyR2-S2814A+/+–knockin, or PLN-KO (Pln–/–) strains. Bar graphs summarizing maximal sarcomere shortening amplitude and velocity (Vmax) for the indicated conditions. Data are representative of 29 VMs and 59 AM WT controls; ISO, 13 AMs; H89, 33 AMs; S2808A, 44 AMs; S2814A, 36 AMs; and PLN, 17 AMs. *P < 0.05, **P < 0.01, and ***P < 0.001, by Student’s t test. (B) LA echocardiogram showing normal LA diameters in diastole versus systole (arrows) but significantly decreased fractional shortening in RyR2-S2808A+/+ mice. An electrocardiogram (ECG) recording (green) was used to time maximal atrial relaxation and contraction (triangles). n = 18 WT mice and 19 RyR2-S2808A mice+⁄+. *P < 0.05, by Student’s t test. Ao, aorta; asterisk indicates the aortic valve. Scale bars: 1 mm. (C) Confocal live-image overlays were aligned to the left-most striation as indicated. The flexible nature of the sarcomeric M-bands was visualized during AM contraction (red) versus relaxation (green) using knockin mice expressing C-terminal–tagged titin-EGFP and peripheral versus central readouts as indicated. Bar graphs summarize the relative M-band latency between peripheral (P) versus central (C) M-band regions in control- versus ISO-treated (1 μM) cells. n = 29 control and 24 ISO AMs. ***P < 0.001, by Student’s t test.
Figure 8
Figure 8. Atrial hypertrophy causes AT proliferation and faster Ca2+ release activation.
(A) Echocardiography confirmed significant changes in atrial size and contractile function after TAC. n = 19 sham mice and 21 TAC-treated mice. **P < 0.01 and ***P < 0.001, by Student’s t test. (B) Confocal line-scan images correlating local Ca2+ transient onset with membrane structures versus cytosolic locations in paced AM from the left atrium (0.5 Hz). Compared with sham-treated mice, the post-TAC latency of SR Ca2+ release was significantly decreased at off-membrane CY locations. n = 16 sham-treated AMs, 22 TAC AMs. ***P < 0.001, by Student’s t test. (C) Confocal TAT imaging in live AM from the left atrium of sham or TAC hearts. After TAC, TAT skeletons (magenta) show proliferative changes, as quantified by TAT component analysis in hypertrophied LA AMs. Histogram subtraction (TAC – sham) demonstrated differential post-TAC changes: increased AT (0°) versus decreased TT components (90°). Bar graph summarizes significantly increased post-TAC AT/TT ratio (binning ± 10°). n = 34 sham-treated AMs and 44 TAC-treated AMs from 3 to 4 hearts each. ***P < 0.001, by Student’s t test. Scale bars: 10 μm, magnification ×4. (D) Immunoblots from atrial tissue lysates of sham- and TAC-treated hearts. Protein expression and phosphorylation changes are summarized by bar graphs. Blots are representative of 3 independent experiments. *P < 0.05 and **P < 0.01, by Student’s t test. (E) Confocal images of AM from the left atrium showing increased highphos RyR2 cluster abundance in more numerous central-axial string-of-pearls in hypertrophied post-TAC as compared to sham-treated AM. Bar graphs summarize significance for an increase in cell size, a decrease in RyR2 cluster density, and an increase in the highphos RyR2-pS2808 cluster fraction after TAC. n = 33 sham-treated and 46 TAC-treated AMs. ***P < 0.001, by Student’s t test. Scale bars: 10 μm, magnification ×4.

Comment in

References

    1. Yiin GS, et al. Age-specific incidence, outcome, cost, and projected future burden of atrial fibrillation-related embolic vascular events: a population-based study. Circulation. 2014;130(15):1236–1244. doi: 10.1161/CIRCULATIONAHA.114.010942. - DOI - PMC - PubMed
    1. Nabauer M, et al. The Registry of the German Competence NETwork on Atrial Fibrillation: patient characteristics and initial management. Europace. 2009;11(4):423–434. - PMC - PubMed
    1. Akar JG, et al. Intracellular chloride accumulation and subcellular elemental distribution during atrial fibrillation. Circulation. 2003;107(13):1810–1815. doi: 10.1161/01.CIR.0000058462.23347.93. - DOI - PubMed
    1. Greiser M, et al. Tachycardia-induced silencing of subcellular Ca2+ signaling in atrial myocytes. J Clin Invest. 2014;124(11):4759–4772. doi: 10.1172/JCI70102. - DOI - PMC - PubMed
    1. Ramadeen A, et al. N-3 polyunsaturated fatty acid supplementation does not reduce vulnerability to atrial fibrillation in remodeling atria. Heart Rhythm. 2012;9(7):1115–1122.e4. doi: 10.1016/j.hrthm.2012.02.013. - DOI - PubMed

Publication types

MeSH terms

Substances