. 2016 Nov;48(11):1330-1338.
doi: 10.1038/ng.3670. Epub 2016 Sep 19.

Association of germline variants in the APOBEC3 region with cancer risk and enrichment with APOBEC-signature mutations in tumors

Affiliations

Association of germline variants in the APOBEC3 region with cancer risk and enrichment with APOBEC-signature mutations in tumors

Candace D Middlebrooks et al. Nat Genet. 2016 Nov.

Abstract

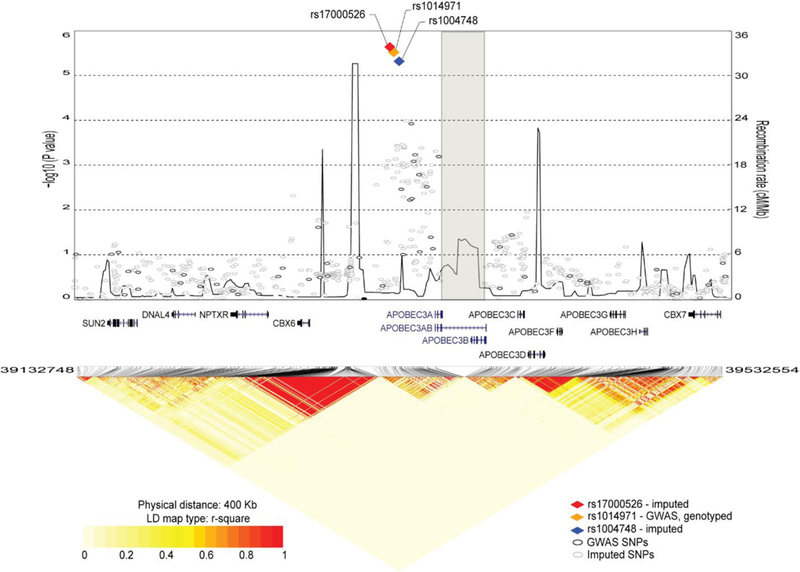
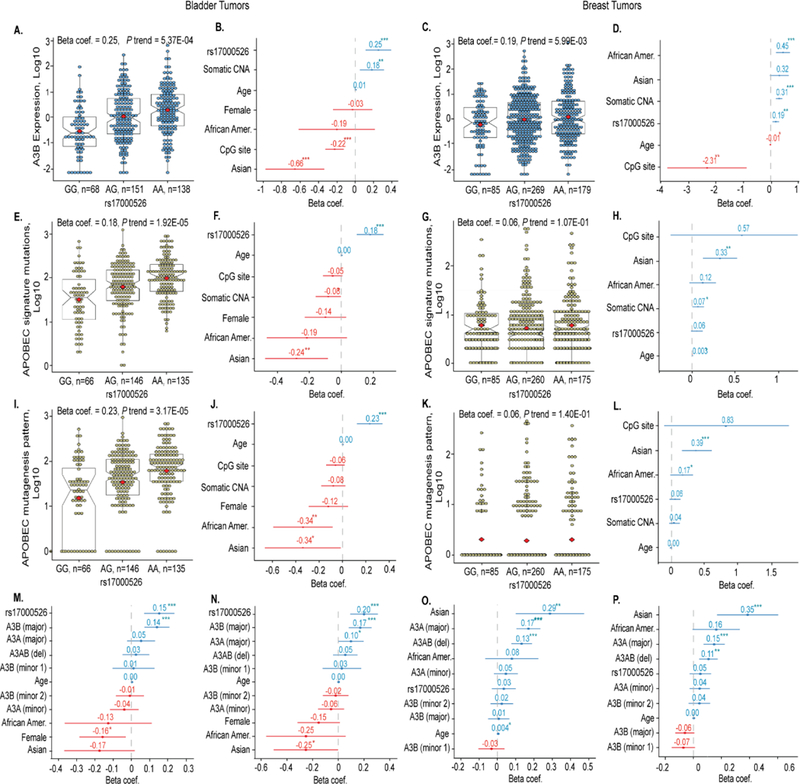
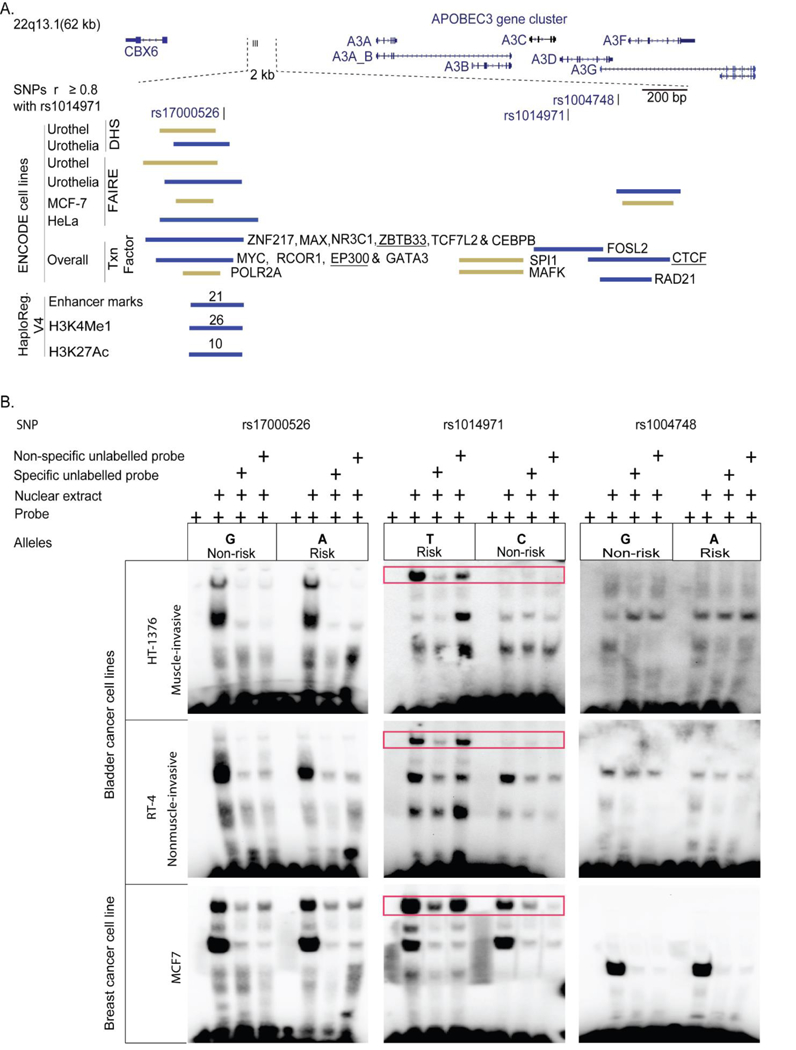
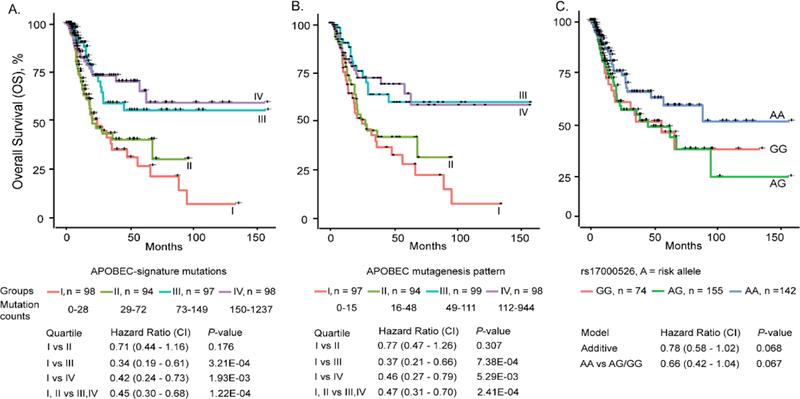
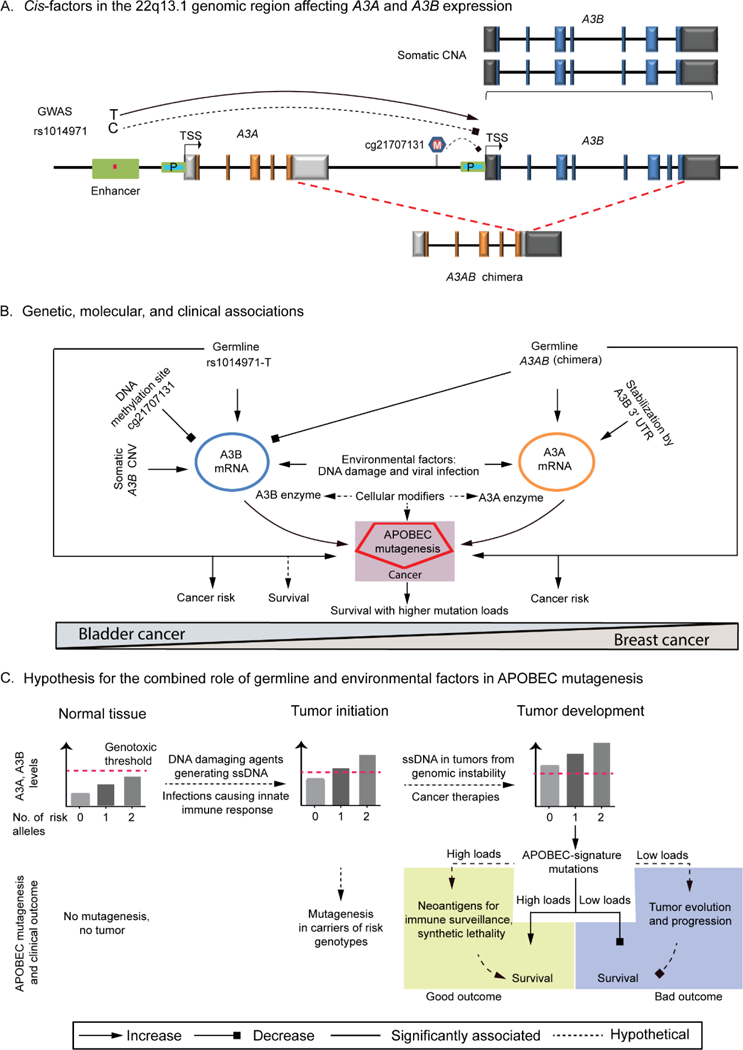
High rates of APOBEC-signature mutations are found in many tumors, but factors affecting this mutation pattern are not well understood. Here we explored the contribution of two common germline variants in the APOBEC3 region. SNP rs1014971 was associated with bladder cancer risk, increased APOBEC3B expression, and enrichment with APOBEC-signature mutations in bladder tumors. In contrast, a 30-kb deletion that eliminates APOBEC3B and creates an APOBEC3A-APOBEC3B chimera was not important in bladder cancer, whereas it was associated with breast cancer risk and enrichment with APOBEC-signature mutations in breast tumors. In vitro, APOBEC3B expression was predominantly induced by treatment with a DNA-damaging drug in bladder cancer cell lines, and APOBEC3A expression was induced as part of the antiviral interferon-stimulated response in breast cancer cell lines. These findings suggest a tissue-specific role of environmental oncogenic triggers, particularly in individuals with germline APOBEC3 risk variants.


Conflict of interest statement

Conflict of Interest statement. None declared.

Figures

Figure 1.
Figure 1.. Fine-mapping analysis of the 22q13.1 region for association with bladder cancer risk.
The plot is based on the combined NCI-GWAS1 and NCI-GWAS2 set, which includes 2,301 imputed and 142 genotyped SNPs for 5,832 bladder cancer cases and 10,721 controls of European ancestry. The results are shown for a 400 Kb region centered on GWAS SNP rs1014971, the same region as was used for the eQTL analyses of TCGA data. Left y-axis represents the -log10 (P-values) for association with bladder cancer risk; right y-axis represents the recombination map of the region (cM/Mb), recombination hot spots are connected by line. The SNPs with the strongest signals are presented as colored diamonds; all other SNPs are presented as circles. The position of the deletion is marked by a grey rectangle; APOBEC3AB (A3AB) deletion isoform is labeled within gene track.
Figure 2.
Figure 2.. Analysis of factors contributing to APOBEC mutagenesis in bladder and breast tumors in TCGA.
(A-D). Quantile-normalized log10 values of A3B mRNA expression in relation to rs17000526 genotypes and corresponding beta-coefficients for each variable. In box plots, whiskers indicate minimum and maximum range, box overlays indicate first and third quartiles, notches refer to medians, and square overlays (in red) mark the means. (E-H). Log10 values of the APOBEC-signature mutations in relation to rs17000526 genotypes and corresponding beta-coefficients for each variable. (I-L). Log10 values of the APOBEC mutagenesis pattern in relation to rs17000526 genotypes and corresponding beta-coefficients for each variable. (M and O). Beta-coefficients for variables contributing to APOBEC-signature mutations. (N and P). Beta-coefficients for variables contributing to APOBEC mutagenesis pattern. Isoforms are annotated as the major, minor, or deletion (A3AB) transcripts as presented in Supplementary Table 4. Beta-coefficients labeled in blue and red indicate positive and negative correlations, respectively. Male gender and European ancestry are used as reference groups. The CNA represents somatic copy number alterations of A3B. P-values are based on multivariate linear regression analysis: *<0.05; **<0.005, ***<0.0005. Data used for this analysis is presented in Supplementary Data Set 1.
Figure 3.
Figure 3.. In silico and experimental analysis of the 2 Kb region that includes GWAS SNP rs1014971 and its two proxy SNPs (r2 ≥ 0.8, in Europeans).
(A). In silico functional analysis based on ENCODE and HaploReg.v4 resources. The plot shows signals detected by chromatin immunoprecipitation and sequencing (ChIP-seq) for different histone marks, CTCF motifs (insulators), DNase hypersensitivity sites (DHS), formaldehyde-assisted isolation of regulatory elements (FAIRE-seq), transcription factor binding sites (Txn Factor), and enhancers from cell lines. Red bars represent signals which overlay the SNPs and green bars represent signals adjacent to SNPs. Numbers on red bars for HaploReg data mark numbers of tissues/cell lines positive for the indicated marks; underlined are weak signals. Enrichment of putative functional signals is observed around SNP rs17000526. (B). Experimental analysis with electrophoretic mobility shift assays (EMSA) for the three associated APOBEC3 SNPs. Red boxes mark allele-specific differences for interaction of SNP rs1014971 with nuclear cell extracts from bladder and breast cancer cell lines. Competition assays were performed with 100-fold excess of unlabeled specific (self) and non-specific (opposite allele) probes. In both bladder cancer cell lines binding was observed only for the risk rs1014971-T allele, while in breast cancer cell line binding was also detected for the non-risk rs1014971-C allele, although it was weaker than for the risk rs1014971-T allele. For SNPs rs17000526 and rs1004748 no distinct allele-specific pattern of binding was observed.
Figure 4.
Figure 4.. Expression of APOBEC3s in HT-1376 bladder and MCF-7 breast cancer cell lines infected with Sendai virus (SeV) or treated with DNA-damaging drug bleomycin (Bleo).
(A and C). Increased viral load shows that cells were successfully infected with SeV based on qRT-PCR for a viral-specific transcript; data is presented on log2 scale compared to non-infected samples. (B and D). Expression of A3A, A3B, and A3G in untreated HT-1376 and MCF-7 cells –A3A is expressed significantly lower than A3B; A3G is not detectable in MCF-7 cells. (E and G). A3A, A3B and A3G are significantly induced by SeV infection in both cell lines. (F and H). mRNA expression analysis of A3A, A3B, and A3G in cells untreated (UT) or treated with bleomycin for 5 and 24 hours. Expression of A3B and A3G was significantly induced after 24 hours of treatment in HT-1376 but not in MCF-7 cells. P-values are calculated between control and experiment groups using two-sided T-test. Shown are values for individual biological replicates and means, normalized to endogenous controls and presented on log2 scale. Data used for this analysis is presented in Supplementary Data Set 2.
Figure 5.
Figure 5.. Overall survival of TCGA bladder cancer patients is improved with increased APOBEC mutagenesis and in carriers of bladder cancer risk genotype rs17000526-AA.
(A and B). APOBEC-signature mutations and APOBEC mutagenesis pattern were divided into quartiles (I - lowest and IV - highest mutation loads) and plotted against months of overall survival (OS). Multivariate Cox regression models were used to calculate hazards ratios (HR) with 95% confidence intervals (CI) and p-values for quartiles II, III, or IV vs. I (reference) as well as III and IV vs I and II. (C). Hazards ratios for SNP rs17000526 were calculated by comparing the AA or AG vs. GG genotype (reference) or AA vs. AG and GG genotypes (reference). Multivariate models included age, gender, and tumor stage. Data used for this analysis is presented in Supplementary Data Set 1.
Figure 6.
Figure 6.. APOBEC mutagenesis in cancer.
(A). Cis-factors in the 22q13.1 region affecting A3A and A3B expression. Expression can be modified by germline variants SNP rs1014971 located within A3B enhancer and a 30 Kb deletion A3AB, DNA methylation (marked as M) at a CpG site cg21707131 within the A3B promoter, and somatic CNA. (B). Genetic, molecular and clinical associations. Expression of A3A, A3AB and A3B transcripts generating A3A and A3B enzymes can be induced by environmental factors such as DNA-damaging agents, and viral infections that activate interferon-stimulated innate immune response. SNP rs1014971 shows important associations predominantly for bladder cancer - with increased cancer risk, A3B expression, APOBEC mutagenesis and survival, while A3AB deletion shows associations with breast cancer. (C). Hypothesis for the combined role of germline and environmental factors in APOBEC mutagenesis. In normal tissues A3A/A3B levels increase with the number of risk alleles of germline variants (SNP rs1014971 or A3AB deletion) but are still below the genotoxic threshold. Exposures to DNA-damaging agents or viral infections can induce A3A/A3B levels above the genotoxic threshold, especially in individuals with germline risk variants. Mutagenesis and tumor initiation can occur if ssDNA is available endogenously (DNA replication and repair) or generated by DNA-damaging exposures. In the tumor microenvironment ssDNA can be available from DNA damage due to genomic instability and cancer therapies; continuous DNA damage maintains high A3B/A3A levels above genotoxic levels. Depending on cancer and treatment type, high APOBEC mutagenesis may be associated with improved or decreased survival.

Comment in

References

    1. Alexandrov LB, Nik-Zainal S, Wedge DC, Campbell PJ & Stratton MR Deciphering signatures of mutational processes operative in human cancer. Cell Rep 3, 246–59 (2013). - PMC - PubMed
    1. Alexandrov LB et al. Signatures of mutational processes in human cancer. Nature 500, 415–21 (2013). - PMC - PubMed
    1. Roberts SA et al. An APOBEC cytidine deaminase mutagenesis pattern is widespread in human cancers. Nat Genet 45, 970–6 (2013). - PMC - PubMed
    1. Burns MB et al. APOBEC3B is an enzymatic source of mutation in breast cancer. Nature 494, 366–70 (2013). - PMC - PubMed
    1. Nik-Zainal S et al. Mutational processes molding the genomes of 21 breast cancers. Cell 149, 979–93 (2012). - PMC - PubMed

Supplementary references:

    1. Cerami E et al. The cBio cancer genomics portal: an open platform for exploring multidimensional cancer genomics data. Cancer Discov 2, 401–4 (2012). - PMC - PubMed
    1. Bullard JH, Purdom E, Hansen KD & Dudoit S Evaluation of statistical methods for normalization and differential expression in mRNA-Seq experiments. BMC Bioinformatics 11, 94 (2010). - PMC - PubMed
    1. Shabalin AA Matrix eQTL: ultra fast eQTL analysis via large matrix operations. Bioinformatics 28, 1353–8 (2012). - PMC - PubMed
    1. Li Q et al. Integrative eQTL-based analyses reveal the biology of breast cancer risk loci. Cell 152, 633–41 (2013). - PMC - PubMed
    1. Marx V Drilling into big cancer-genome data. Nat Meth 10, 293–297 (2013). - PubMed

Publication types

MeSH terms