

Species identification by experts and non-experts: comparing images from field guides
- PMID: 27644140
- PMCID: PMC5028888
- DOI: 10.1038/srep33634
Species identification by experts and non-experts: comparing images from field guides
Abstract
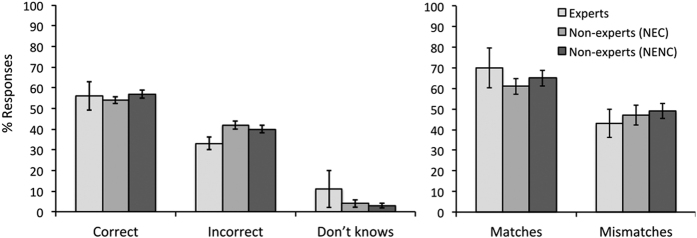
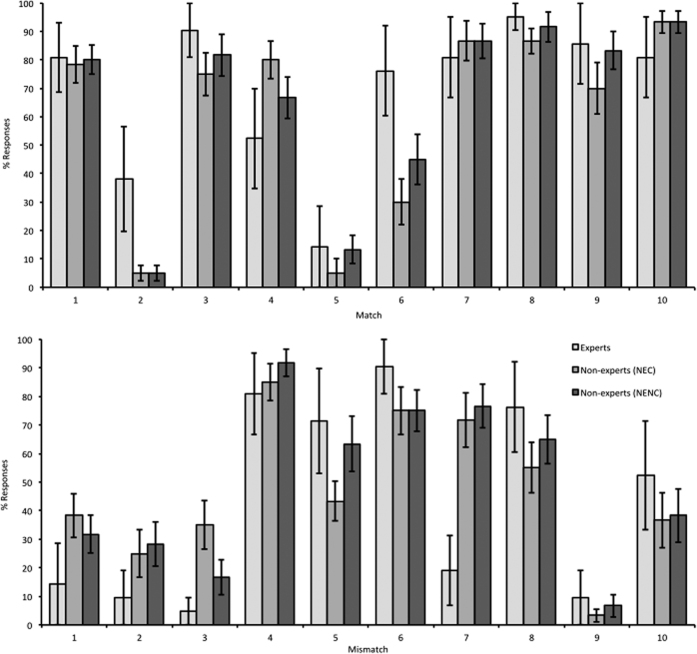
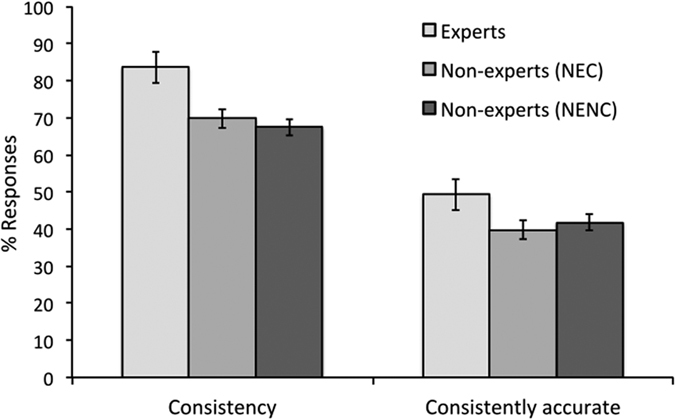
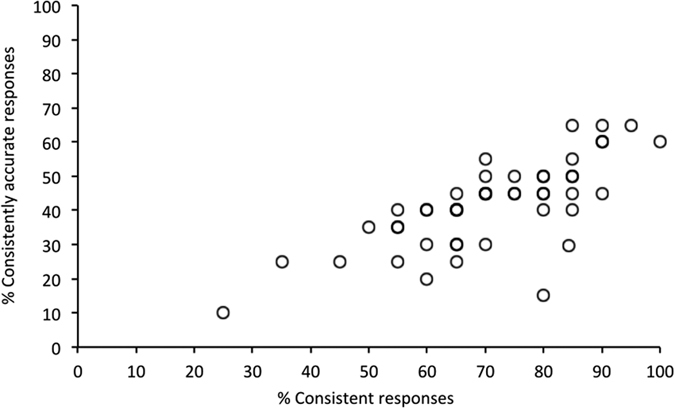
Accurate species identification is fundamental when recording ecological data. However, the ability to correctly identify organisms visually is rarely questioned. We investigated how experts and non-experts compared in the identification of bumblebees, a group of insects of considerable conservation concern. Experts and non-experts were asked whether two concurrent bumblebee images depicted the same or two different species. Overall accuracy was below 60% and comparable for experts and non-experts. However, experts were more consistent in their answers when the same images were repeated, and more cautious in committing to a definitive answer. Our findings demonstrate the difficulty of correctly identifying bumblebees using images from field guides. Such error rates need to be accounted for when interpreting species data, whether or not they have been collected by experts. We suggest that investigation of how experts and non-experts make observations should be incorporated into study design, and could be used to improve training in species identification.
Figures
References
-
- Elphick C. S. How you count counts: the importance of methods research in applied ecology. J. Appl. Ecol. 45, 1313–1320 (2008).
-
- Farnsworth E. J. et al. Next-Generation Field Guides. Bioscience 63, 891–899 (2013).
-
- Sutherland W. J., Roy D. B. & Amano T. An agenda for the future of biological recording for ecological monitoring and citizen science. Biol. J. Linn. Soc. 115, 779–784 (2015).
-
- Rodrigues A. S. L., Pilgrim J. D., Lamoreux J. F., Hoffmann M. & Brooks T. M. The value of the IUCN Red List for conservation. Trends Ecol. Evol. 21, 71–76 (2006). - PubMed
-
- Fitzpatrick M. C., Preisser E. L., Ellison A. M. & Elkinton J. S. Observer bias and the detection of low-density populations Ecol. Appl. 19, 1673–79 (2009). - PubMed
Publication types
MeSH terms
LinkOut - more resources
Full Text Sources
Other Literature Sources
Molecular Biology Databases
