. 2016 Nov 14;36(23):2967-2982.
doi: 10.1128/MCB.00230-16. Print 2016 Dec 1.

Mutation of the 3-Phosphoinositide-Dependent Protein Kinase 1 (PDK1) Substrate-Docking Site in the Developing Brain Causes Microcephaly with Abnormal Brain Morphogenesis Independently of Akt, Leading to Impaired Cognition and Disruptive Behaviors

Affiliations

Mutation of the 3-Phosphoinositide-Dependent Protein Kinase 1 (PDK1) Substrate-Docking Site in the Developing Brain Causes Microcephaly with Abnormal Brain Morphogenesis Independently of Akt, Leading to Impaired Cognition and Disruptive Behaviors

Lluís Cordón-Barris et al. Mol Cell Biol. .

Abstract

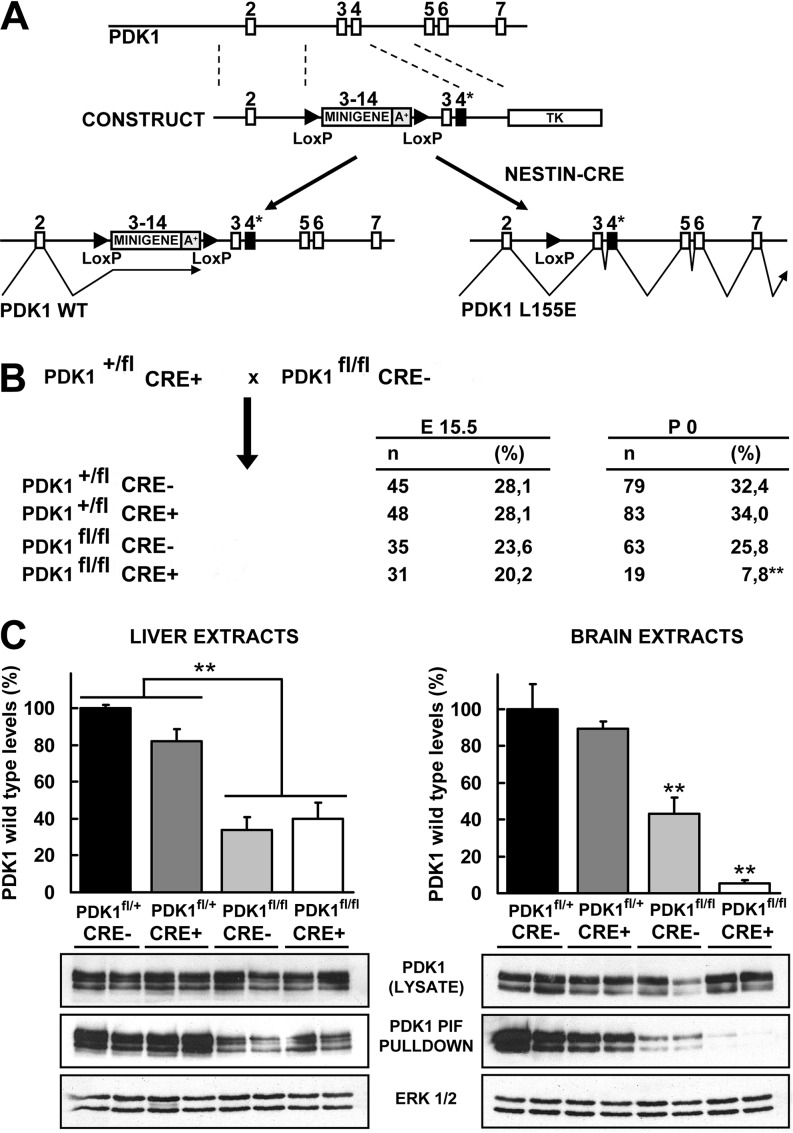
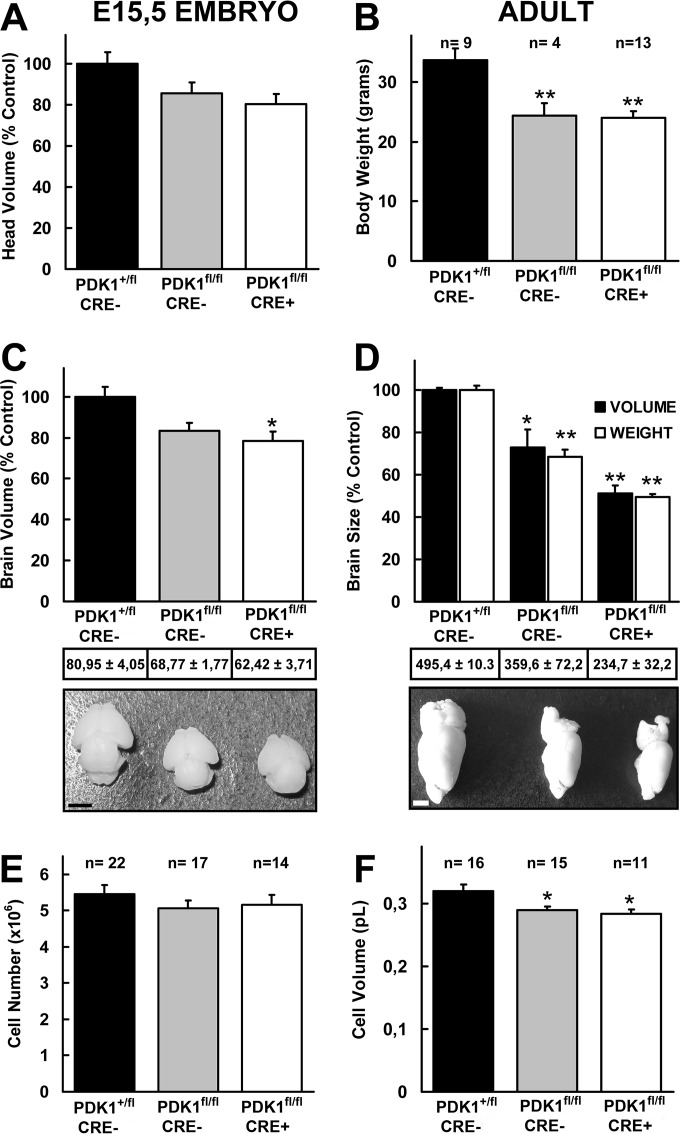
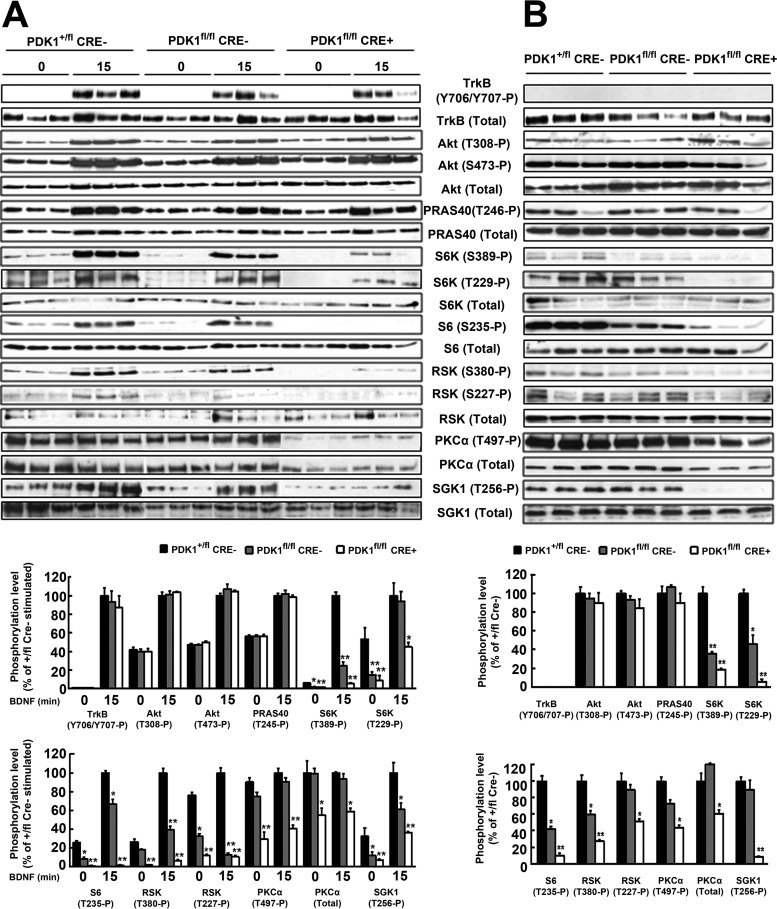
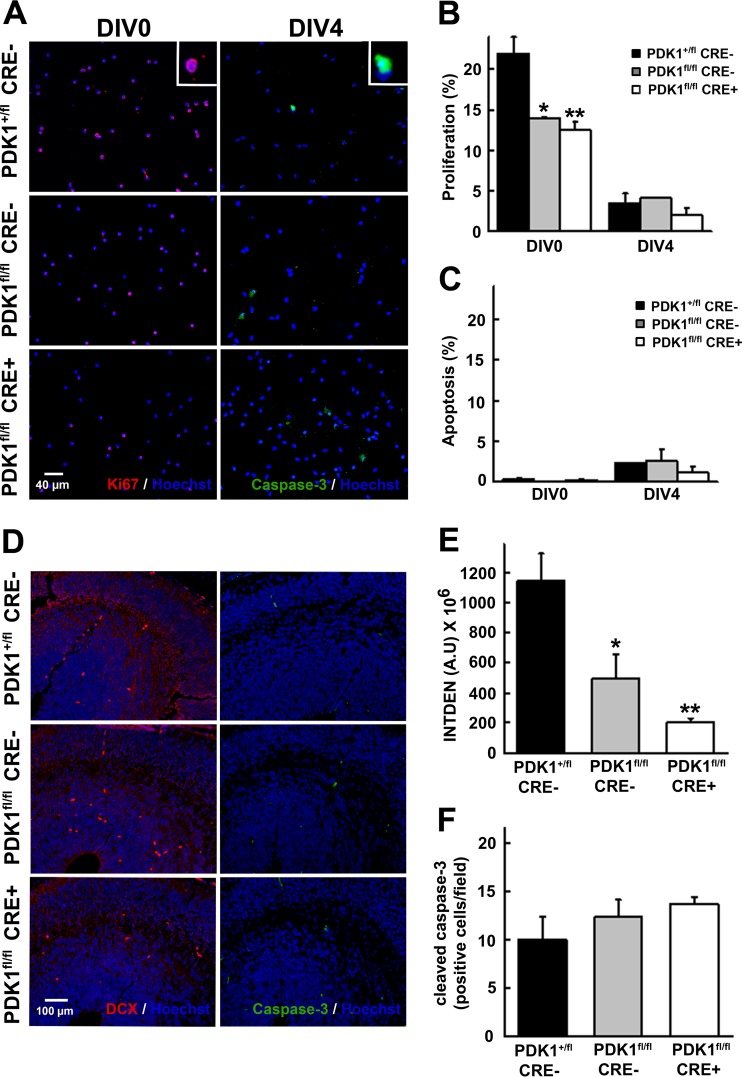
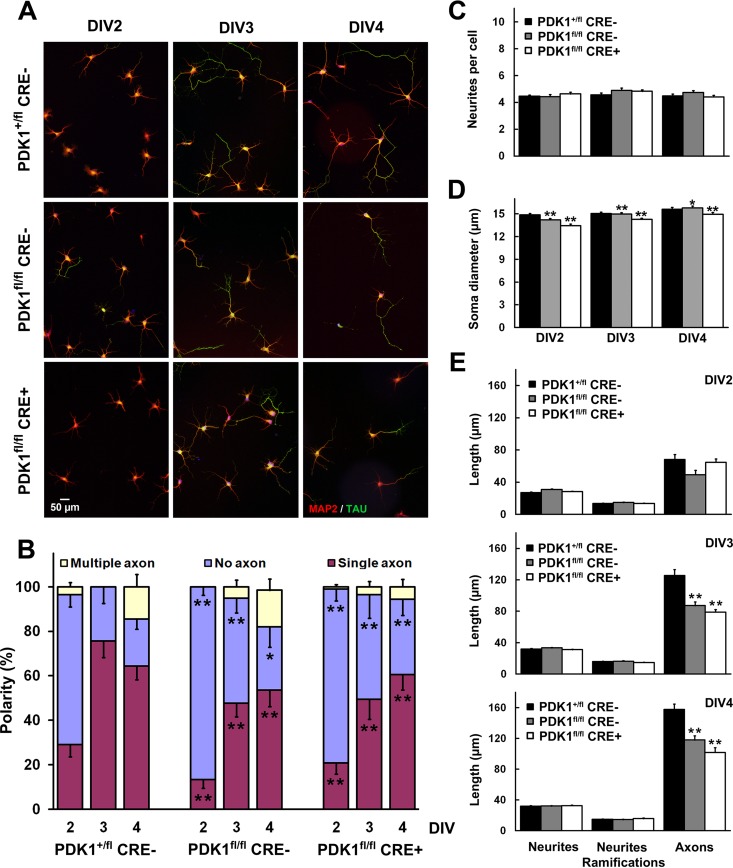
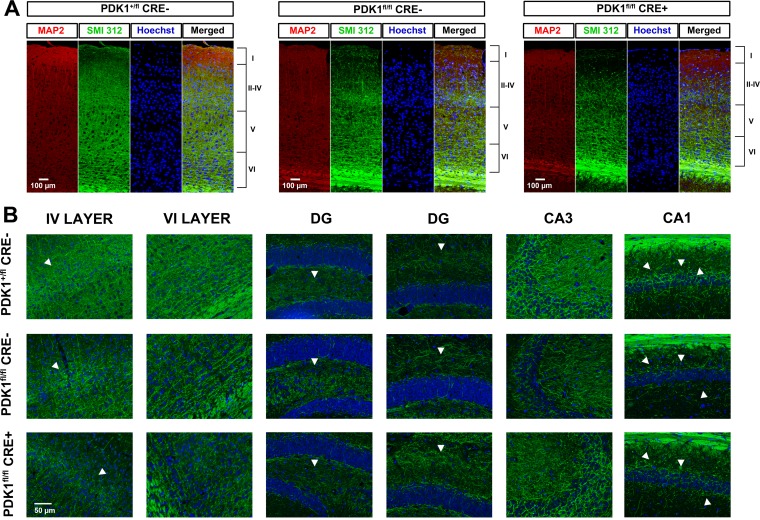
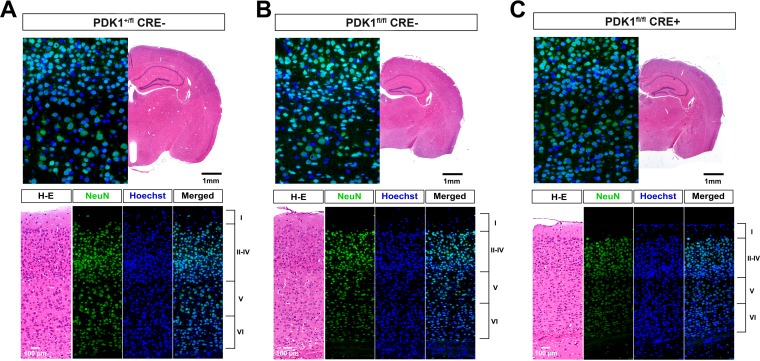
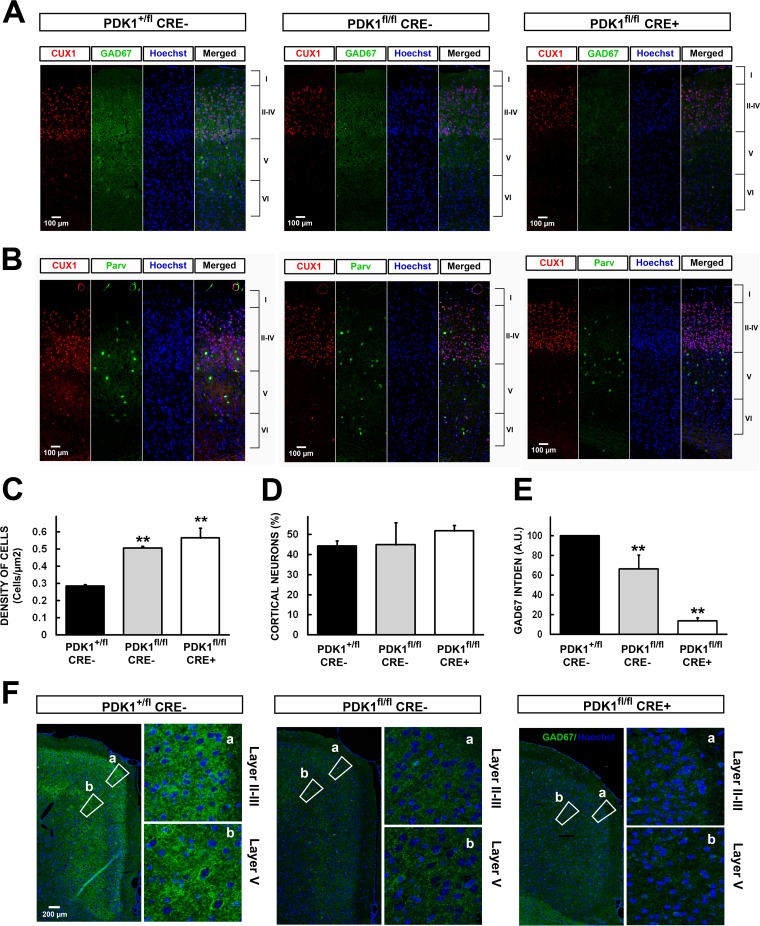
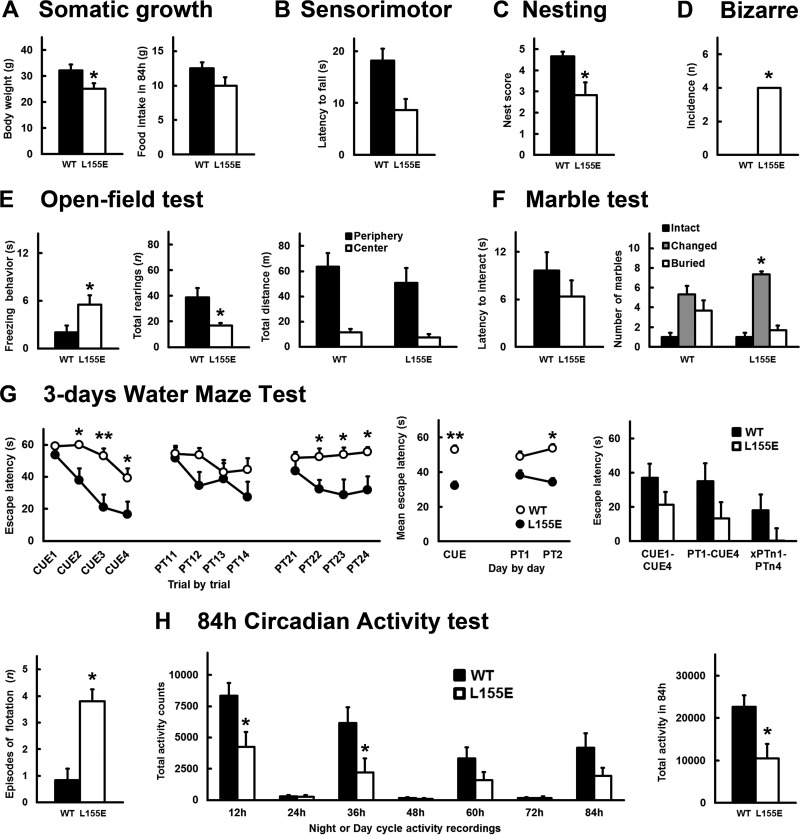
The phosphoinositide (PI) 3-kinase/Akt signaling pathway plays essential roles during neuronal development. 3-Phosphoinositide-dependent protein kinase 1 (PDK1) coordinates the PI 3-kinase signals by activating 23 kinases of the AGC family, including Akt. Phosphorylation of a conserved docking site in the substrate is a requisite for PDK1 to recognize, phosphorylate, and activate most of these kinases, with the exception of Akt. We exploited this differential mechanism of regulation by generating neuron-specific conditional knock-in mice expressing a mutant form of PDK1, L155E, in which the substrate-docking site binding motif, termed the PIF pocket, was disrupted. As a consequence, activation of all the PDK1 substrates tested except Akt was abolished. The mice exhibited microcephaly, altered cortical layering, and reduced circuitry, leading to cognitive deficits and exacerbated disruptive behavior combined with diminished motivation. The abnormal patterning of the adult brain arises from the reduced ability of the embryonic neurons to polarize and extend their axons, highlighting the essential roles that the PDK1 signaling beyond Akt plays in mediating the neuronal responses that regulate brain development.


Figures

FIG 1
FIG 1
Generation of brain-specific PDK1 L155E mice. (A) Diagram depicting the 5′ end of the PDK1 gene from exons 2 to 7 (PDK1); the targeting construct containing the thymidine kinase (TK) negative selectable marker and the minigene cassette, which includes the PDK1 open reading frame from exons 3 to 14 plus the natural polyadenylation signals (A+) and is flanked by LoxP sites (CONSTRUCT); the targeted allele, which drives the expression of the PDK1 wild-type protein in control tissues (PDK1 WT); and the excised allele, in which the CRE recombinase-mediated deletion of the minigene cassette allows the expression of the PDK1 mutant protein (PDK1 L155E). The white boxes represent exons, the triangles represent LoxP sites, and the mutated exon 4 containing the Leu155Glu amino acid substitution is represented by black boxes labeled with asterisks. (B) Breeding strategy used for generation of mice expressing the PDK1 L155E mutant protein in brain. The number (n) and proportion (%) of mice of each genotype resulting from the depicted experimental breeding are indicated both at E15.5 and at birth (P0). **, the lower-than-expected frequency of PDK1fl/fl CRE+ pups was statistically significant (P < 0.005 by χ2 test). (C) PDK1 was affinity purified on PIF-Sepharose from liver or brain embryonic extracts of the indicated genotypes. The expression levels of the PDK1 wild-type protein were quantified on the indicated genotypes and tissues from the PDK1 immunoblot signals of the PIF-Sepharose pulldowns (middle blots), normalized by the total PDK1 protein levels derived from the whole tissue lysate immunoblot signals (upper blots), and represented as percentages of those of the PDK1+/fl CRE controls (top). Each bar represents the means and standard errors of the mean for the immunoblot signals derived from two independent experiments. A representative Western blot is shown, where each lane corresponds to a sample derived from a different mouse. Immunoblots with the ERK1/2 antibody are also shown as controls for protein loading (bottom blots). **, P < 0.005 compared to controls.
FIG 2
FIG 2
(A, C, and D) Microcephaly of PDK1fl/fl CRE+ mice. The organ volume was measured from physical histological sections of the E15.5 embryo head (A) and brain (C) or MRI images of one hemisphere of the adult brain (D) by using the Cavalieri method, as described in Materials and Methods. The data are represented as means and standard errors of the mean obtained for three different mice per genotype and are expressed as percentages of the controls. (C and D) Total-volume values and representative photographs of E15.5 embryonic brains (C) or adult brain left hemispheres (D) are shown at the bottom, where the scale bars correspond to 1 mm and 2 mm, respectively. (B) Mean body weights of mice of the indicated genotypes. The values represent the means and standard errors of the mean for the indicated numbers of mice (n). (E and F) The number of cells (E) and the cellular volume (F) were determined from E15.5 dissociated cortical neurons with a Scepter 2.0 handheld automated cell counter (Millipore). The data are represented as the means and standard errors of the mean for the indicated numbers of embryos obtained from 11 independent litters. *, P < 0.05; **, P < 0.005 compared to controls.
FIG 3
FIG 3
Activation of S6K1, RSK, SGK1 and PKC but not Akt is inhibited in PDK1fl/fl CRE+ mice. (A) Cortical neurons from three independent embryos of the indicated genotypes were cultured for 6 DIV and then serum starved for 4 h and either left unstimulated (0) or stimulated with 50 ng/ml of BDNF for 15 min (15). (B) Whole-brain protein extracts were obtained at E15.5 from three independent embryos of each depicted genotype. Lysates were immunoblotted with the indicated antibodies to monitor the activation of Akt, S6K, RSK, SGK, and PKC. Each lane corresponds to a different embryo. Band densitometry quantification of the ratio between phosphorylated and total protein levels is shown at the bottom, where the bars represent the means and standard errors of the mean obtained for three different mice per genotype analyzed, and is expressed as a percentage of the BDNF-stimulated control samples (A) or control brain tissue samples (B). *, P < 0.05; **, P < 0.005 compared to controls.
FIG 4
FIG 4
Neuronal survival responses are preserved in PDK1fl/fl CRE+ mice. Cortical cells of the indicated genotypes were either sham treated (CONTROL) or deprived of trophic factors in the absence (TD) or presence of 50 ng/ml of BDNF (TD+BDNF) for 24 h. The data represent the means and standard errors of the mean for at least 3 independent mouse embryos per genotype from 6 independent litters. (A) Viability was determined with the MTT reduction assay and is expressed as a percentage of the untreated cells. (B) The percentage of apoptotic cells was obtained by scoring the numbers of nuclei exhibiting chromatin fragmentation from six different fields per well and 4 wells per condition divided by the total. (C) Representative micrographs of Hoechst-stained cortical neurons of the indicated genotypes after 24 h of the indicated treatment; the arrowheads indicate apoptotic nuclei.
FIG 5
FIG 5
Reduced neuronal-progenitor proliferation in PDK1fl/fl CRE and PDK1fl/fl CRE+ embryos. (A) Representative micrographs of E15.5 embryonic cortical cultures of the indicated genotypes immunostained with the described antibodies. Insets show enlarged single-cell representative images of the nuclear staining of Ki67 in red and the cytoplasmic active caspase-3 staining in green. (B and C) The percentages of primary cortical neurons expressing the Ki67 proliferation marker (B) or the active caspase 3 apoptotic marker (C) were scored at the indicated time points. The bars correspond to the means and standard errors of the mean from 10 different fields per culture and three independent embryonic cultures per genotype. (D) Epifluorescence microscopy images of E15.5 embryonic brain coronal sections of the indicated genotypes immunostained with the described antibodies. DCX, doublecortin. (E and F) The intensity of doublecortin staining (INTDEN) (E) and the number of caspase 3-positive cells per field (F) were quantified and expressed as the means and standard errors of the mean from three independent sections per embryo obtained from three different embryos per genotype. A.U, arbitrary units. *, P < 0.05; **, P < 0.005 compared to controls.
FIG 6
FIG 6
Deficient polarization and axonal outgrowth in PDK1fl/fl CRE and PDK1fl/fl CRE+ mice. (A) Representative micrographs of hippocampal cultures from the indicated genotypes at different DIV stained with the dendrite-specific marker MAP2 (red) and the specific axonal marker Tau-1 (green). (B to E) The percentage of polarization (B), the number of neurites per cell (C), the diameter of the soma (D), and the lengths of neurites, neurite ramifications, and axons (E) were measured at different time points on samples from the indicated genotypes. Each bar represents the means ± standard errors of the mean for 100 neurons from three different embryos per condition. *, P < 0.05; **, P < 0.005 compared to controls.
FIG 7
FIG 7
Reduced connectivity in PDK1fl/fl CRE and PDK1fl/fl CRE+ mouse brains. (A) Epifluorescence micrographs of coronal sections of the somatosensory cortex from mouse brains of the indicated genotypes stained with the dendrite-specific marker MAP2, the general axonal marker SMI312, and the nuclear Hoechst dye. Merged signals are also shown. The cortical layers are indicated on the right from I to VI. (B) Image magnifications of cortical layers IV and VI, as well as the hippocampal dentate gyrus (DG) and CA3 and CA1 regions stained with SMI312 and Hoechst dye. The arrowheads indicate differences in the densities of axonal fibers between genotypes.
FIG 8
FIG 8
Abnormal cortical layering with compaction of layer IV in PDK1fl/fl CRE (B) and PDK1fl/fl CRE+ (C) mouse brains compared to the PDK1+/fl CRE controls (A). (Bottom) Epifluorescence microscopy images of coronal sections of the somatosensory cortex from mice of the indicated genotypes stained with the neuronal marker NeuN and the nuclear Hoechst dye, as indicated. Adjacent hematoxylin and eosin (H-E)-stained sections and merged signals are also shown. The cortical layers are indicated on the right from I to VI. (Top) Low-magnification micrographs of the H-E-stained sections and high-magnification images of the merged epifluorescence images corresponding to layers II to V.
FIG 9
FIG 9
Reduced GAD67 levels and abnormal parvalbumin staining patterns in PDK1fl/fl CRE and PDK1fl/fl CRE+ mouse brains. (A and B) Epifluorescence microscopy images of coronal sections of the somatosensory cortex from mice of the indicated genotypes stained with the layer II- to IV-specific marker CUX1, the GABAergic neuron-specific marker GAD67, the interneuron marker parvalbumin, and the nuclear Hoechst dye, as indicated. The cortical layers are indicated on the right from I to VI. (C to E) The density of neurons in layer IV (C), the percentage of CUX1-positive neurons in layer IV among the total number of CUX1-positive neurons in layers I to IV (D), and the intensity of GAD67 staining (E) were quantified and expressed as the means and standard errors of the mean from three independent sections per embryo obtained from three different embryos per genotype. (F) Epifluorescence microscopy images of coronal sections of the cingulated cortex from mice of the indicated genotypes stained with the GABAergic neuron-specific marker GAD67 and the nuclear Hoechst dye. Higher-magnification images of layer II and III (a) and layer V (b) regions are also shown. **, P < 0.005 compared to controls.
FIG 10
FIG 10
Disruptive behavior with diminished motivation and cognitive deficits in PDK1fl/fl CRE+ mice. The somatic growth-related parameters (A), sensorimotor performance on the wooden rod test (B), executive functions in the nesting behavior daily life activity (C), incidence of bizarre behaviors (D), exploratory activity and anxiety-like behaviors in a standard open-field test (E), level of interaction in the marble-burying test (F), cognitive abilities in the water maze and depression-like diminished motivation measured by episodes of immobility (G), and circadian activity on running wheels (H) were assessed in six PDK1+/fl CRE (WT) and six PDK1fl/fl CRE+ (L155E) adult female mice. *, P < 0.05; **, P < 0.005 compared to controls. The error bars indicate the means and standard errors of the means.

Similar articles

Cited by

References

    1. Vanhaesebroeck B, Stephens L, Hawkins P. 2012. PI3K signalling: the path to discovery and understanding. Nat Rev Mol Cell Biol 13:195–203. doi:10.1038/nrm3290. - DOI - PubMed
    1. Engelman JA, Luo J, Cantley LC. 2006. The evolution of phosphatidylinositol 3-kinases as regulators of growth and metabolism. Nat Rev Genet 7:606–619. doi:10.1038/nrg1879. - DOI - PubMed
    1. Choi YJ, Di NA, Kramvis I, Meikle L, Kwiatkowski DJ, Sahin M, He X. 2008. Tuberous sclerosis complex proteins control axon formation. Genes Dev 22:2485–2495. doi:10.1101/gad.1685008. - DOI - PMC - PubMed
    1. Shi SH, Jan LY, Jan YN. 2003. Hippocampal neuronal polarity specified by spatially localized mPar3/mPar6 and PI 3-kinase activity. Cell 112:63–75. doi:10.1016/S0092-8674(02)01249-7. - DOI - PubMed
    1. Jiang H, Guo W, Liang X, Rao Y. 2005. Both the establishment and the maintenance of neuronal polarity require active mechanisms: critical roles of GSK-3beta and its upstream regulators. Cell 120:123–135. doi:10.1016/j.cell.2004.12.033. - DOI - PubMed

LinkOut - more resources