

Role of C/EBP-α in Adriamycin-induced podocyte injury
- PMID: 27644413
- PMCID: PMC5028749
- DOI: 10.1038/srep33520
Role of C/EBP-α in Adriamycin-induced podocyte injury
Abstract
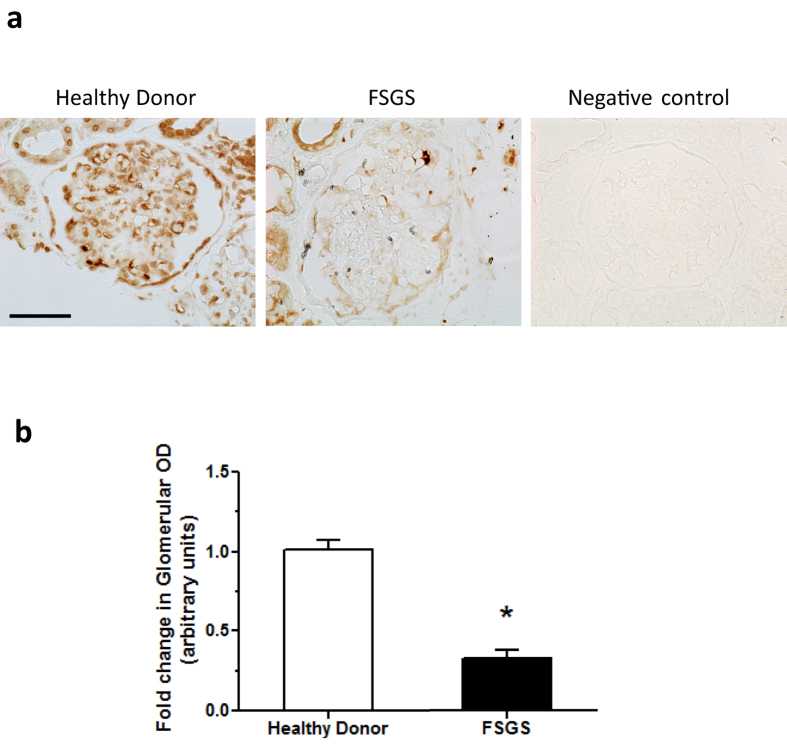
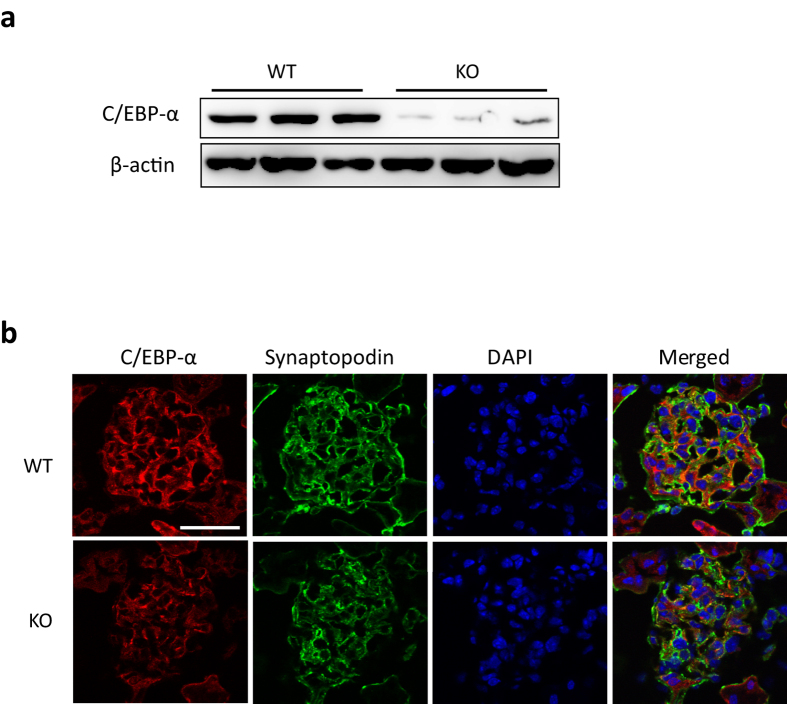
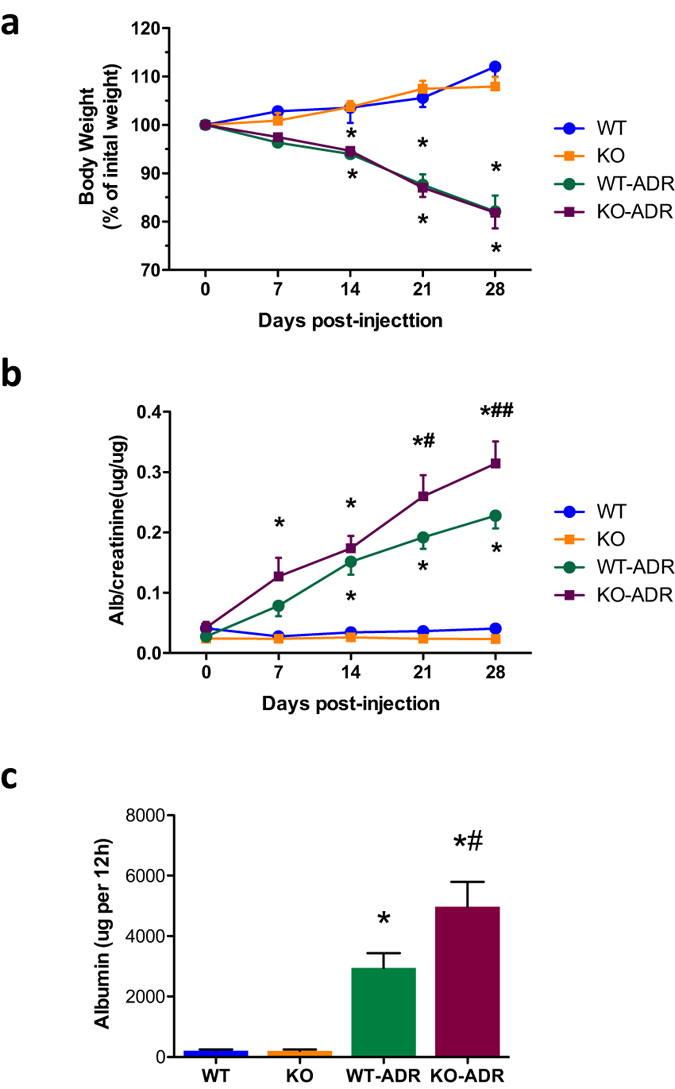
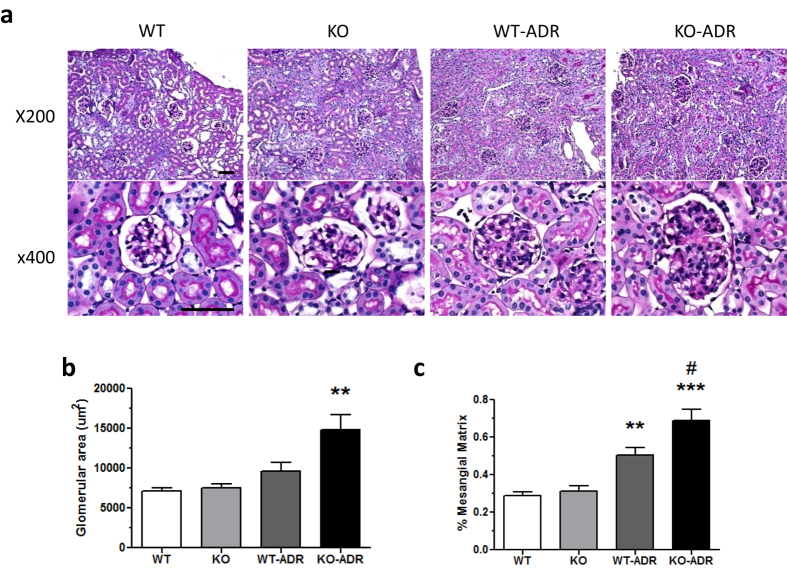
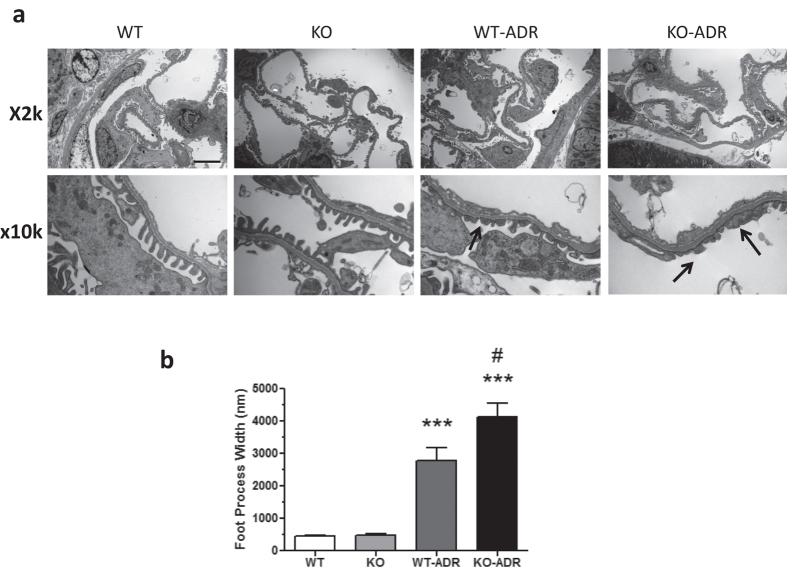
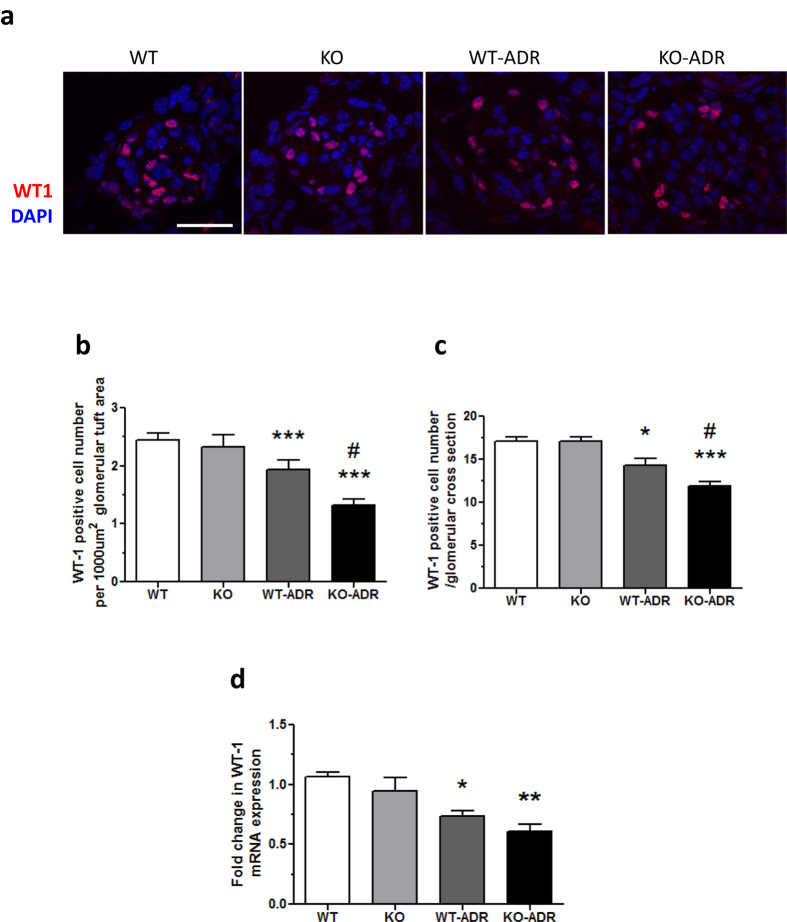
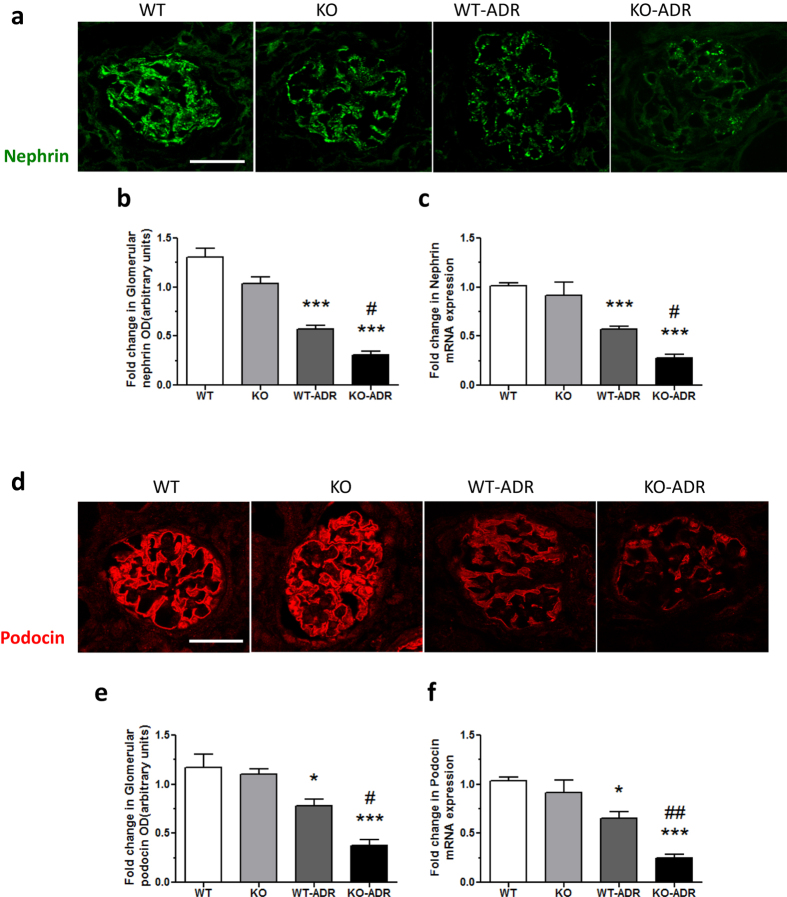
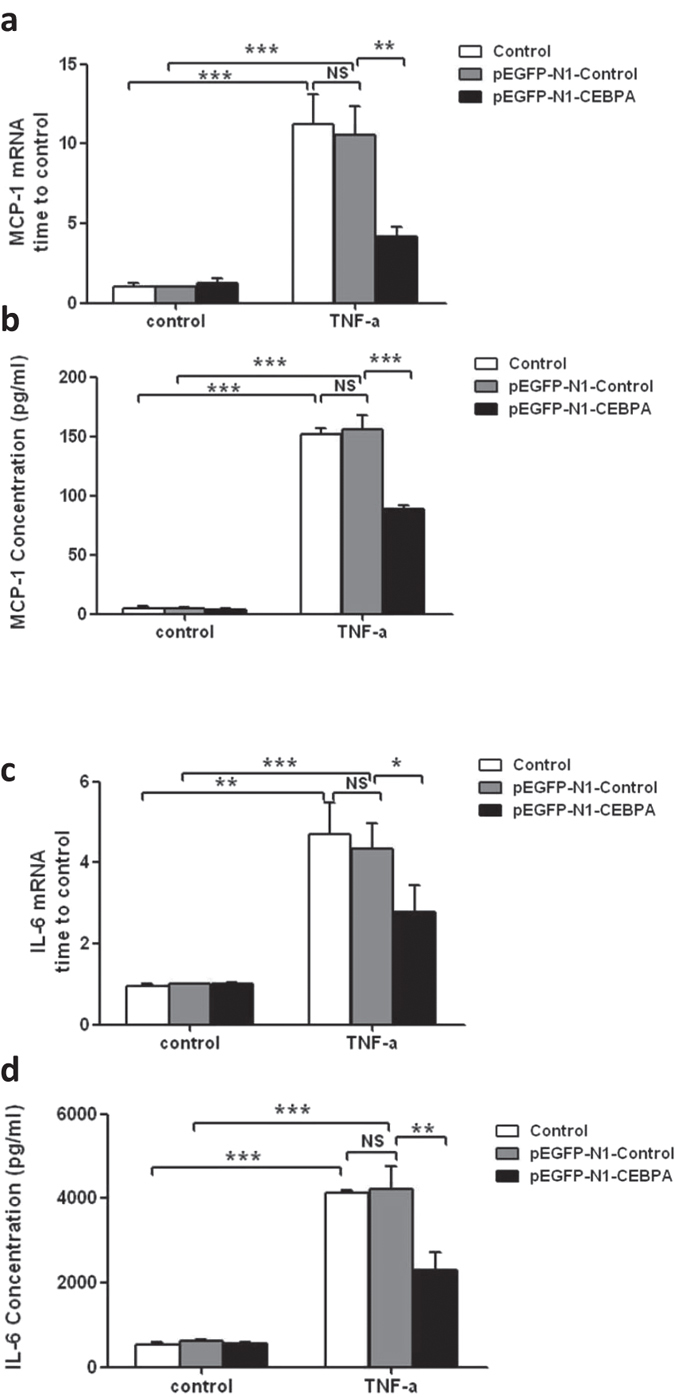
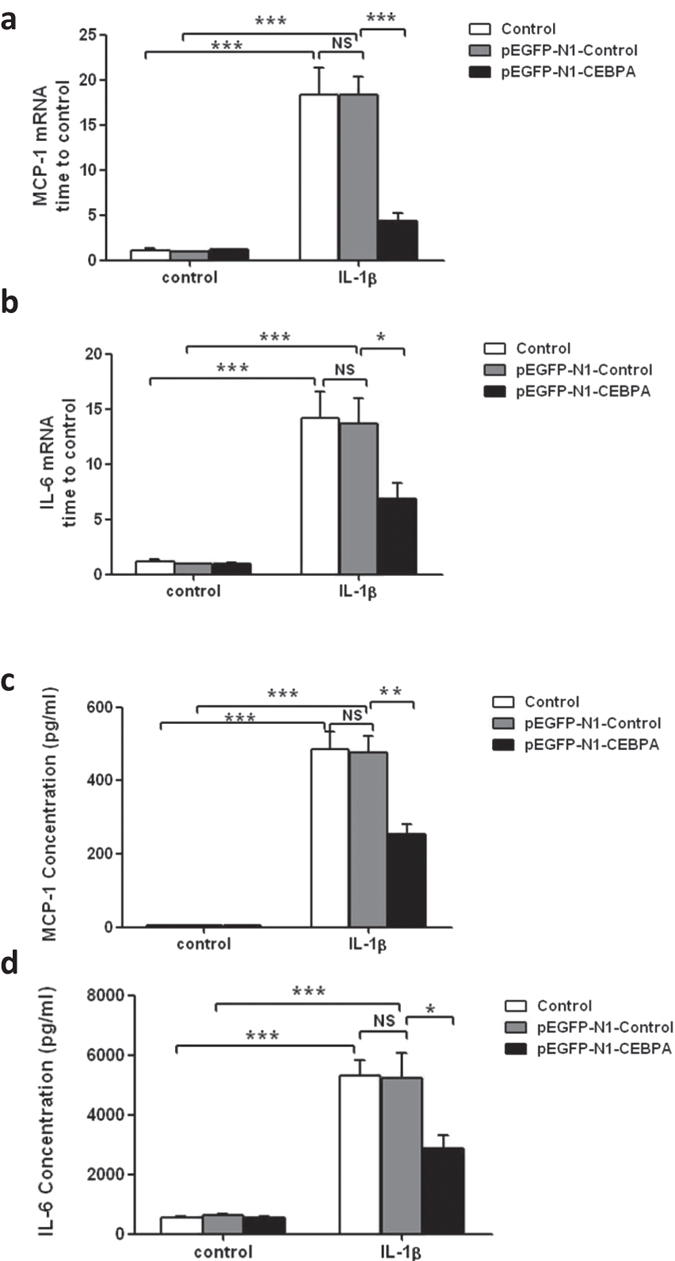
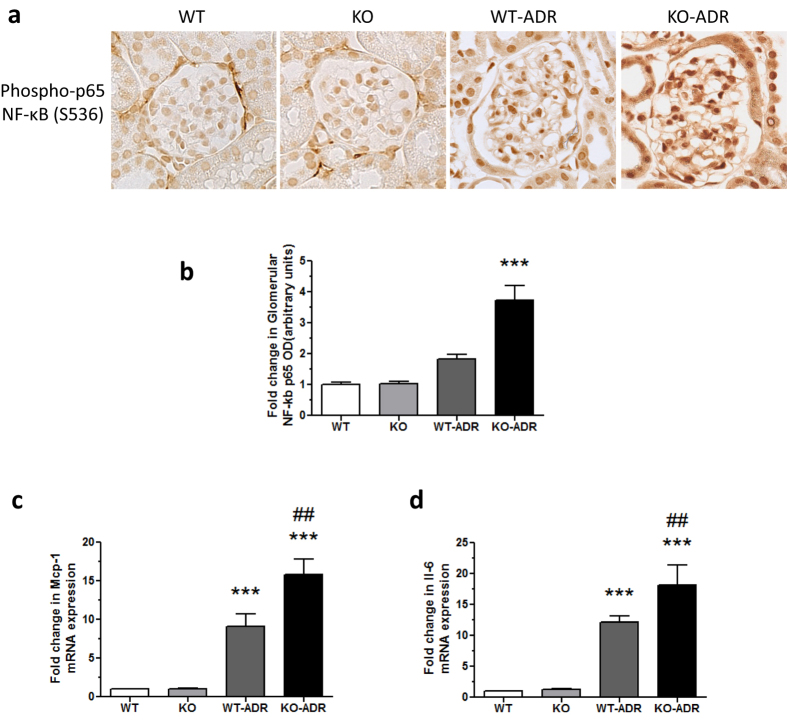
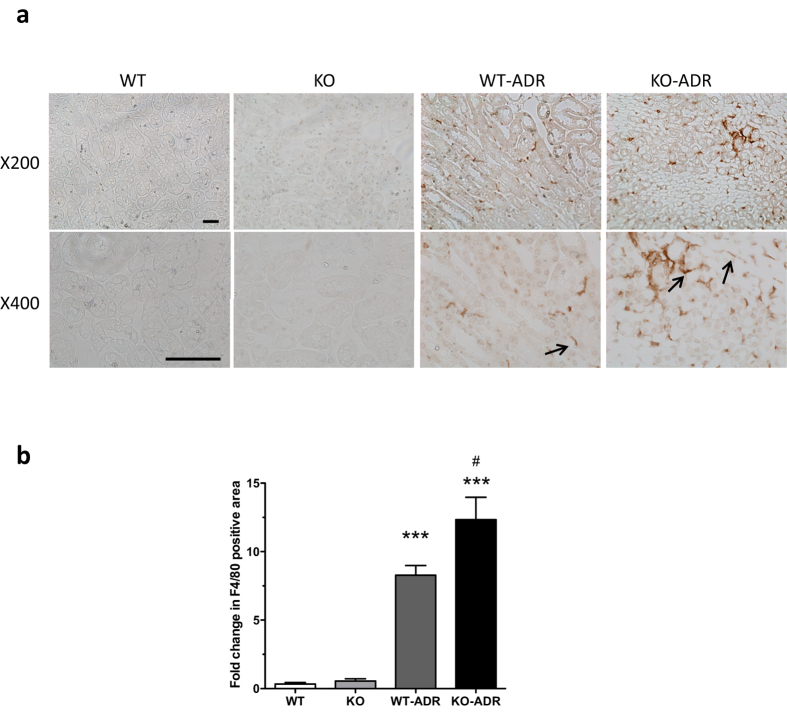
Podocytes are terminally differentiated epithelial cells in the kidney glomeruli that act as a key component of the glomerular filtration barrier. Although the inciting injury to the podocyte may vary between various glomerular diseases, the inevitable consequence of podocyte injury results in their loss, leading to progressive kidney disease. Here, we report that the expression of CCAAT/enhancer binding protein-α (C/EBP-α), a transcription factor known to interact with and activate PPAR-γ and NF-κB, is suppressed in the glomerular cells, particularly in podocytes, in human kidneys with focal segmental glomerulosclerosis. Genetic ablation of C/EBP-α in podocytes resulted in increased proteinuria, increased podocyte foot process effacement, and to decreased podocyte number in the setting of Adriamycin (ADR)-induced nephropathy. Overexpression of C/EBP-α in human podocytes in vitro led to an inhibition of MCP-1 and IL-6 expression in response to TNF-α and IL-1β treatments. Conversely, augmented production of MCP-1 and IL-6 was observed in the glomeruli of C/EBP-α knockout mice and was associated increased infiltration of macrophages in vivo. Together, our data suggest that C/EBP-α mediates anti-inflammatory effects in podocytes to confer protection against podocyte injury and loss that may contribute to worsening glomerulosclerosis.
Figures
Similar articles
-
Prevalence of CD44-positive glomerular parietal epithelial cells reflects podocyte injury in adriamycin nephropathy.Nephron Exp Nephrol. 2013;124(3-4):11-8. doi: 10.1159/000357356. Epub 2014 Jan 8. Nephron Exp Nephrol. 2013. PMID: 24401840
-
Podocyte injury-driven lipid peroxidation accelerates the infiltration of glomerular foam cells in focal segmental glomerulosclerosis.Am J Pathol. 2015 Aug;185(8):2118-31. doi: 10.1016/j.ajpath.2015.04.007. Epub 2015 Jun 11. Am J Pathol. 2015. PMID: 26072030 Free PMC article.
-
Podocyte injury and overexpression of vascular endothelial growth factor and transforming growth factor-beta 1 in adriamycin-induced nephropathy in rats.Cytokine. 2012 Aug;59(2):370-6. doi: 10.1016/j.cyto.2012.04.014. Epub 2012 May 11. Cytokine. 2012. PMID: 22579701
-
TRPC6 channel as an emerging determinant of the podocyte injury susceptibility in kidney diseases.Am J Physiol Renal Physiol. 2015 Sep 1;309(5):F393-7. doi: 10.1152/ajprenal.00186.2015. Epub 2015 Jun 17. Am J Physiol Renal Physiol. 2015. PMID: 26084930 Free PMC article. Review.
-
Regulation of TRPC6 ion channels in podocytes - Implications for focal segmental glomerulosclerosis and acquired forms of proteinuric diseases.Acta Physiol Hung. 2015 Sep;102(3):241-51. doi: 10.1556/036.102.2015.3.2. Acta Physiol Hung. 2015. PMID: 26551740 Review.
Cited by
-
A Personalized Glomerulus Chip Engineered from Stem Cell-Derived Epithelium and Vascular Endothelium.Micromachines (Basel). 2021 Aug 16;12(8):967. doi: 10.3390/mi12080967. Micromachines (Basel). 2021. PMID: 34442589 Free PMC article.
-
Adriamycin-induced nephropathy models: elucidating CKD pathophysiology and advancing therapeutic strategies.Exp Anim. 2025 Apr 20;74(2):132-142. doi: 10.1538/expanim.24-0133. Epub 2024 Nov 23. Exp Anim. 2025. PMID: 39581599 Free PMC article. Review.
-
Cells of all trades - on the importance of spatial positioning of senescent cells in development, healing and aging.FEBS Lett. 2025 Aug;599(15):2087-2106. doi: 10.1002/1873-3468.70037. Epub 2025 Mar 29. FEBS Lett. 2025. PMID: 40156464 Free PMC article. Review.
-
ATP dynamics as a predictor of future podocyte structure and function after acute ischemic kidney injury in female mice.Nat Commun. 2024 Nov 22;15(1):9977. doi: 10.1038/s41467-024-54222-0. Nat Commun. 2024. PMID: 39578451 Free PMC article.
-
C/EBPα deficiency in podocytes aggravates podocyte senescence and kidney injury in aging mice.Cell Death Dis. 2019 Sep 17;10(10):684. doi: 10.1038/s41419-019-1933-2. Cell Death Dis. 2019. PMID: 31527620 Free PMC article.
References
-
- D’Agati V. D. Pathobiology of focal segmental glomerulosclerosis: new developments. Curr Opin Nephrol Hypertens 21, 243–250 (2012). - PubMed
Publication types
MeSH terms
Substances
Grants and funding
LinkOut - more resources
Full Text Sources
Other Literature Sources
Molecular Biology Databases
Research Materials
Miscellaneous
