. 2016 Oct;26(10):1112-1130.
doi: 10.1038/cr.2016.109. Epub 2016 Sep 20.

Hepatocellular carcinoma redirects to ketolysis for progression under nutrition deprivation stress

Affiliations

Hepatocellular carcinoma redirects to ketolysis for progression under nutrition deprivation stress

De Huang et al. Cell Res. 2016 Oct.

Abstract

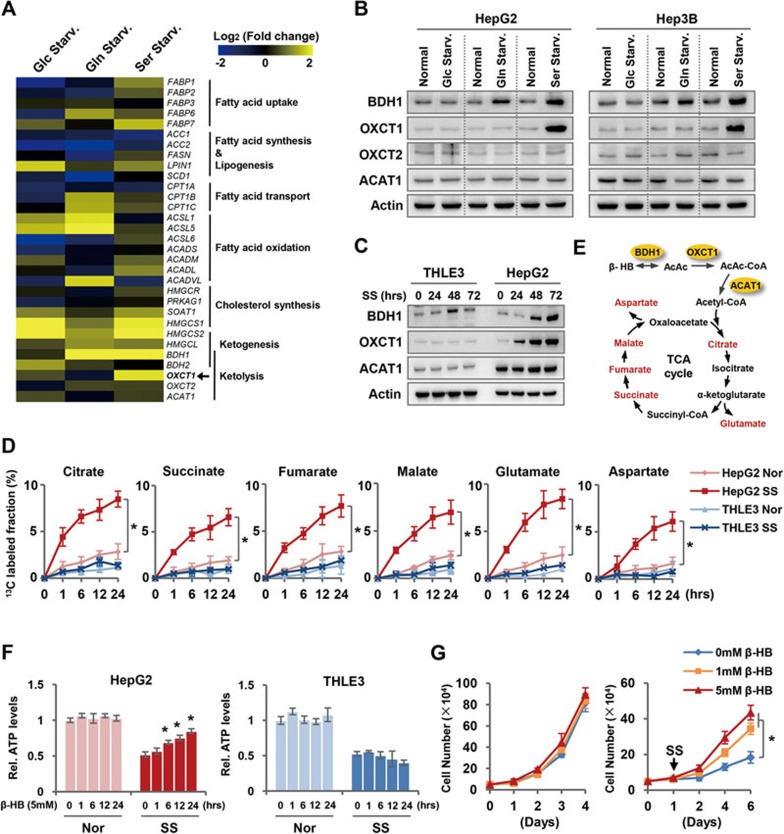
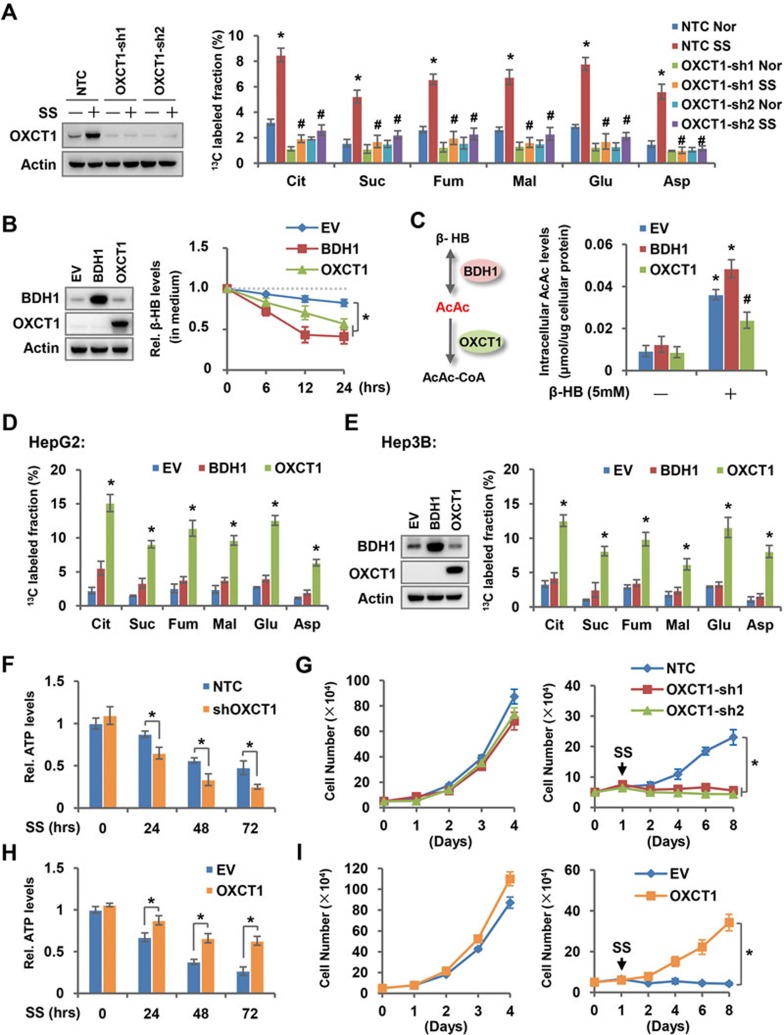
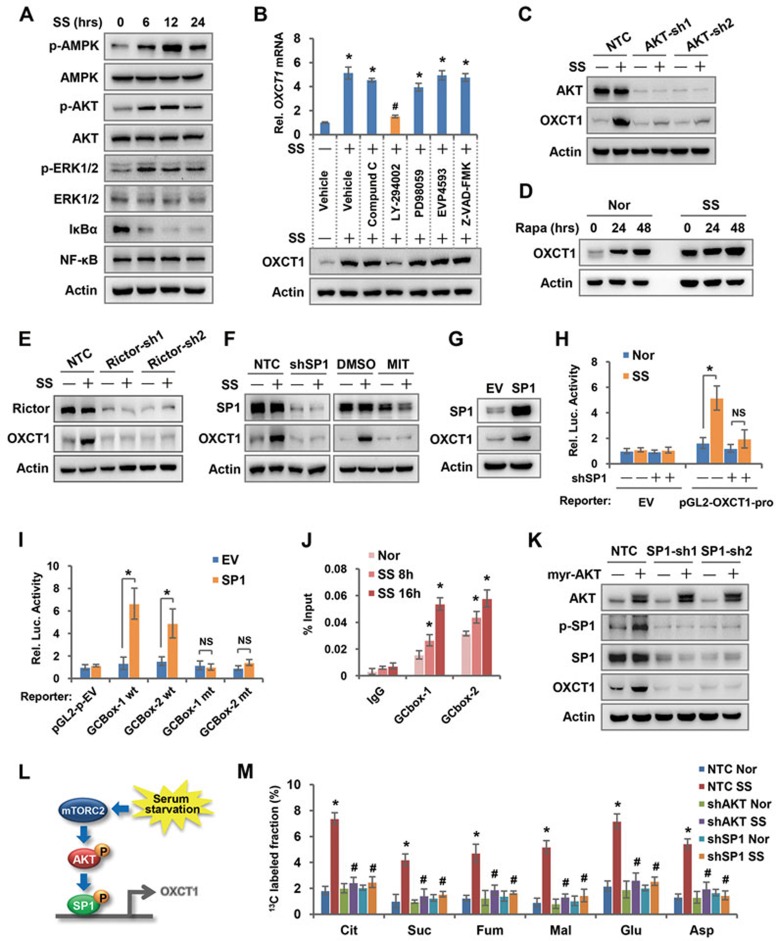
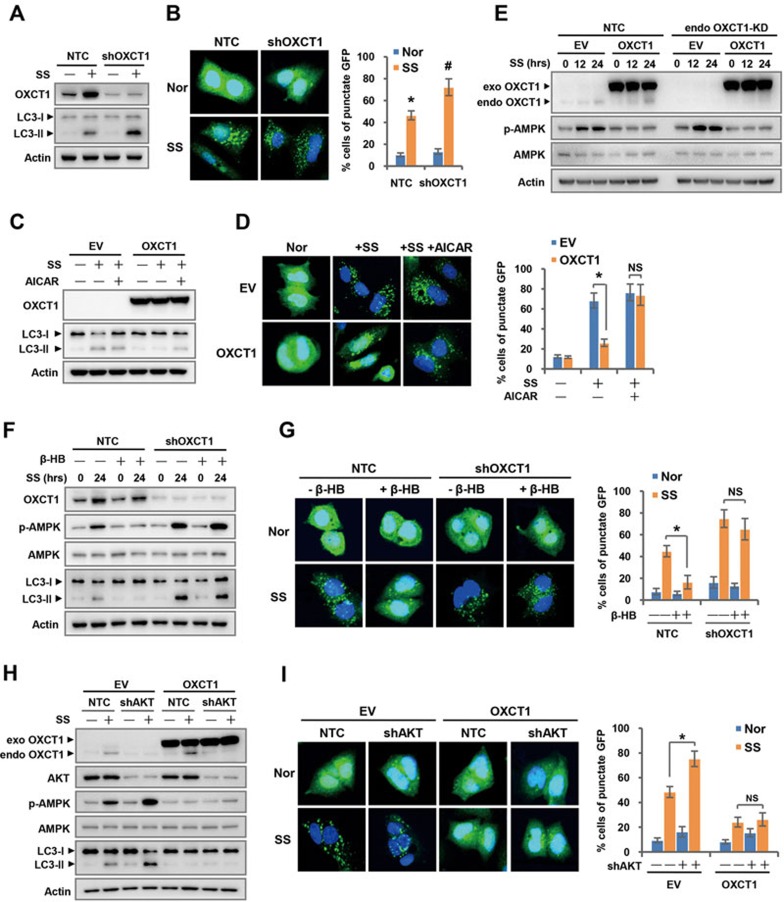
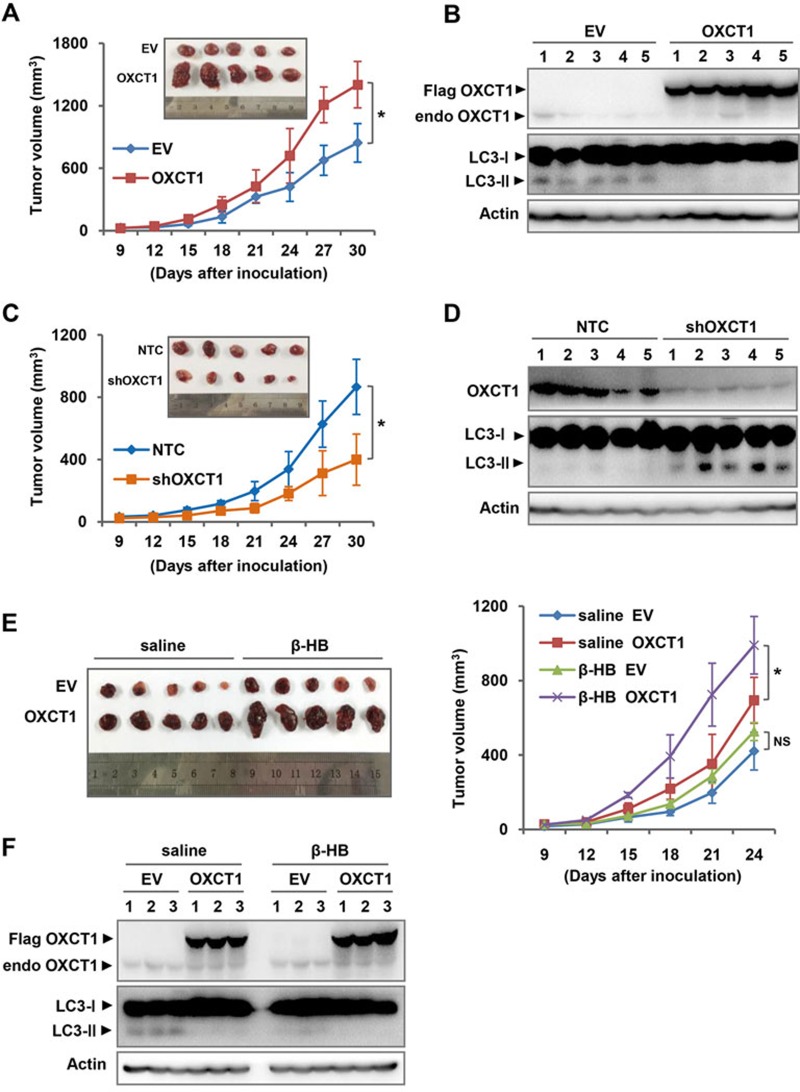
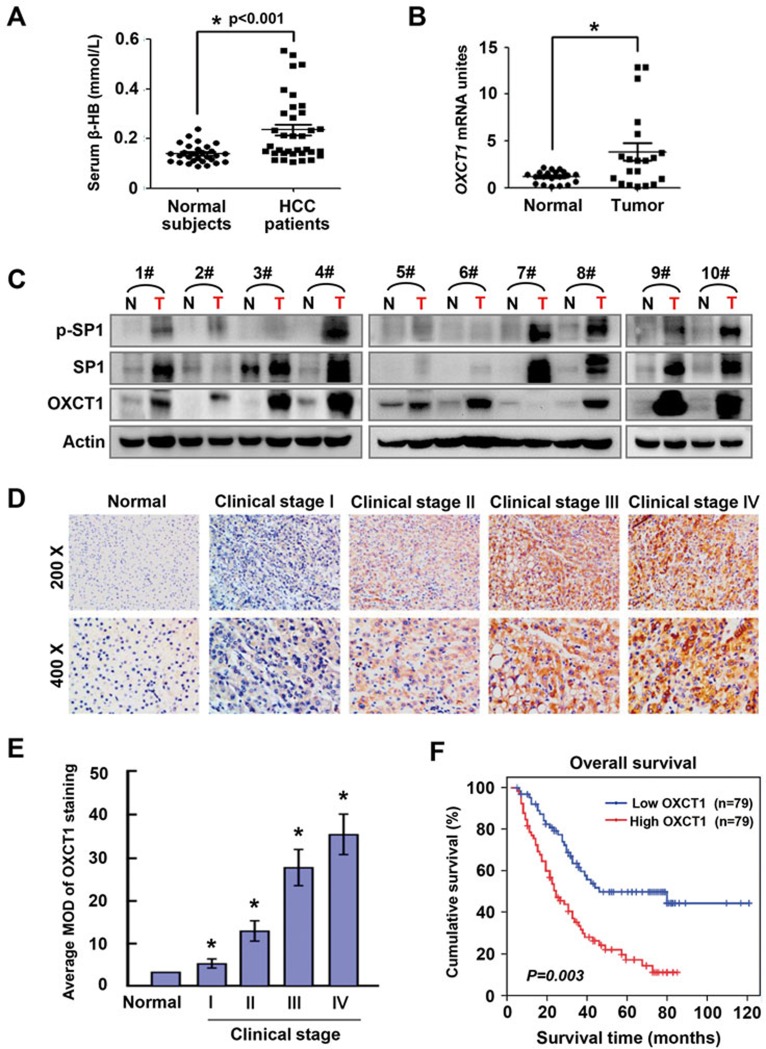
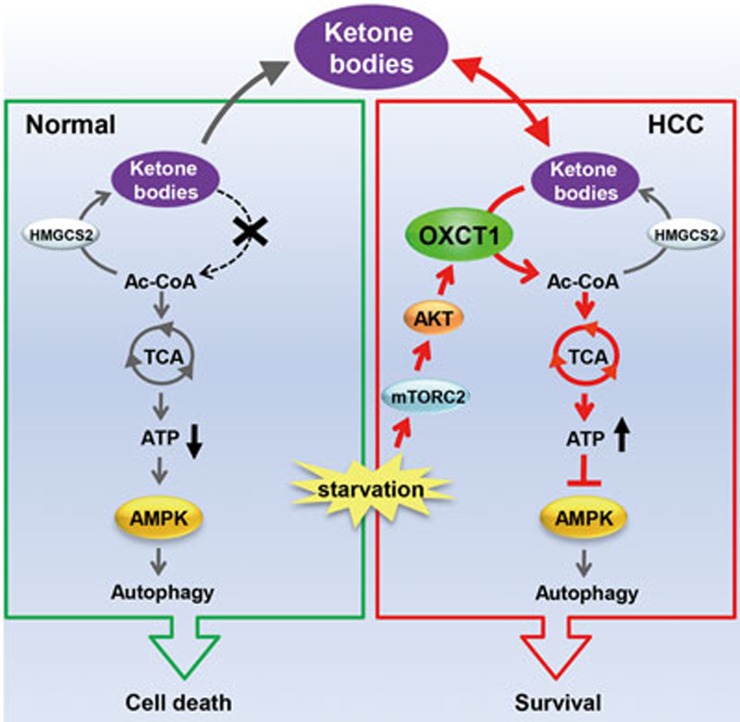
Cancer cells are known for their capacity to rewire metabolic pathways to support survival and proliferation under various stress conditions. Ketone bodies, though produced in the liver, are not consumed in normal adult liver cells. We find here that ketone catabolism or ketolysis is re-activated in hepatocellular carcinoma (HCC) cells under nutrition deprivation conditions. Mechanistically, 3-oxoacid CoA-transferase 1 (OXCT1), a rate-limiting ketolytic enzyme whose expression is suppressed in normal adult liver tissues, is re-induced by serum starvation-triggered mTORC2-AKT-SP1 signaling in HCC cells. Moreover, we observe that enhanced ketolysis in HCC is critical for repression of AMPK activation and protects HCC cells from excessive autophagy, thereby enhancing tumor growth. Importantly, analysis of clinical HCC samples reveals that increased OXCT1 expression predicts higher patient mortality. Taken together, we uncover here a novel metabolic adaptation by which nutrition-deprived HCC cells employ ketone bodies for energy supply and cancer progression.


Figures

Figure 1
Figure 1
Ketolysis is re-activated in nutrition-starved HCC cells to facilitate cell proliferation. (A) Heat map from qRT-PCR analysis showed the mRNA expression of lipid metabolism-related genes in HepG2 cells cultured under glucose or glutamine or serum starvation for 24 h as compared with normal culture condition. Yellow indicates upregulated genes whereas blue indicates downregulated genes. (B) Western blot analysis of BDH1, OXCT1/2 and ACAT1 expression in HepG2 and Hep3B cells cultured under normal, glucose or glutamine or serum starvation conditions for 48 h. (C) Western blot analysis of BDH1, OXCT1 and ACAT1 expression in THLE3 and HepG2 cells cultured under normal (0 h) or serum starvation (SS) conditions for the indicated hours. (D) GC-MS analysis of 13C-labeled metabolites in HepG2 and THLE3 cells cultured under normal (Nor) or serum starvation (SS) conditions for 48 h followed by incubating with 5 mM [2, 4-13C2] β-HB for 0, 1, 6, 12 and 24 h. Data were presented as mean ± SD. *P< 0.05 as compared between the indicated groups. (E) Schematic diagram of metabolic flux from ketolysis to TCA cycle, in which metabolites with [2, 4-13C2] β-HB-derived carbons measured in D were marked in red. (F) Cellular ATP levels were measured in HepG2 and THLE3 cells cultured under normal (Nor) or SS conditions for 48 h followed by incubating with 5 mM exogenous β-HB for 0, 1, 6, 12 and 24 h. Values were normalized to cellular protein. Data were presented as mean ± SD. *P< 0.05 as compared with Nor group with 0 h β-HB incubation. (G) Growth curves of HepG2 cells cultured in the presence or absence of 1 mM or 5 mM β-HB under normal (left panel) or SS (right panel) conditions. Arrow indicates the time point that SS started. Cell numbers were determined by trypan blue counting. Data were presented as mean ± SD. *P< 0.05 as compared between the indicated groups.
Figure 2
Figure 2
OXCT1 is critical for induction of ketolysis in nutrition-starved HCC cells. (A) HepG2 cells stably expressing OXCT1 shRNAs or non-targeting control (NTC) were cultured under normal (Nor) or SS conditions for 48 h followed by incubating with 5mM of [2, 4-13C2] β-HB for 24 h and subsequent isotope tracing of 13C-labeled metabolites by GC-MS. OXCT1 expression was determined by western blot. Data were presented as mean ± SD. *P< 0.05 as compared with Nor cultured NTC group; #P < 0.05 as compared with SS-treated NTC group. (B) Medium β-HB was measured in HepG2 cells stably expressing BDH1, OXCT1 or empty vector (EV) after incubating with 5 mM exogenous β-HB for the indicated hours. OXCT1 and BDH1 expression were determined by western blot. Data were presented as mean ± SD. *P< 0.05 as compared between the indicated groups. (C) Intracellular AcAc was measured after incubating with or without 5 mM exogenous β-HB for 24 h in HepG2 cells stably expressing BDH1, OXCT1 or EV control. Values were normalized to cellular protein. Data were presented as mean ± SD. *P< 0.05 as compared with EV group without β-HB; #P< 0.05 as compared with EV group with β-HB treatment. (D, E) GC-MS analysis of 13C-labeled metabolites after incubating with 5 mM [2, 4-13C2] β-HB for 24 h in HepG2 (D) and Hep3B (E) cells stably expressing BDH1, OXCT1 or EV. BDH1 and OXCT1 expression in Hep3B cells were determined by western blot. Data were presented as mean ± SD. *P< 0.05 as compared with corresponding EV group. (F) Cellular ATP levels were measured in HepG2 cells stably expressing OXCT1 shRNAs or NTC after SS treatment for the indicated hours. Values were normalized to cellular protein. Data were presented as mean ± SD. *P< 0.05 as compared between the indicated groups. (G) Growth curves of HepG2 cells stably expressing OXCT1 shRNAs (sh1 and sh2) or NTC cultured under normal or SS conditions. Arrow indicates the time point that SS started. Cell numbers were determined by trypan blue counting. Data were presented as mean ± SD. *P< 0.05 as compared between the indicated groups. (H) HepG2 cells stably expressing OXCT1 shRNA (targeting 3′UTR) were further infected with viruses expressing pSIN-3×flag-OXCT1 or pSIN-EV, followed by cellular ATP measurement after serum starvation (SS) treatment for the indicated hours. Values were normalized to cellular protein. Data were presented as mean ± SD. *P< 0.05 as compared between the indicated groups. (I) HepG2 cells stably expressing OXCT1 shRNA (targeting 3′UTR) were further infected with viruses expressing pSIN-3×flag-OXCT1 or pSIN-EV. Cells were treated with or without SS starting from arrow-indicated day. Cell numbers were determined by trypan blue counting. Data were presented as mean ± SD. *P< 0.05 as compared between the indicated group.
Figure 3
Figure 3
Activation of mTORC2-AKT-SP1 signaling induces OXCT1 expression and ketolysis in nutrition-limiting HCC cells. (A) Western blot analysis of p-AMPK (threonine 172 phosphorylation of AMPK), AMPK, p-AKT (serine 473 phosphorylation of AKT), AKT, p-ERK1/2 (threonine 202/tyrosine 204 phosphorylation of ERK1/2), ERK1/2, IκBα and NF-κB levels in HepG2 cells under normal (0 h) or serum starvation conditions for 6, 12 and 24 h. (B) qRT-PCR and western blot analysis of OXCT1 expression in HepG2 cells incubated with vehicle (DMSO), compound C (10 μM), LY-294002 (50 μM), PD98059 (50 μM), EVP4593 (1 μM) or Z-VAD-FMK (50 μM) for 2 h prior to SS for 24 or 48 h. Data were presented as mean ± SD. *P< 0.05 as compared with vehicle-treated normal group; #P< 0.05 as compared with vehicle-treated SS group. (C) AKT and OXCT1 protein levels were determined by western blot in HepG2 cells stably expressing AKT shRNAs (sh1 and sh2) or NTC under normal or SS conditions for 48 h. (D) Western blot analysis of OXCT1 expression in HepG2 cells treated with vehicle (DMSO) or 50 nM rapamycin for 24 and 48 h in the presence or absence of serum. (E) HepG2 cells stably expressing Rictor shRNAs or NTC were cultured under Nor or SS conditions for 48 h. Rictor and OXCT1 expression were determined by western blot. (F) Western blot analysis of SP1 and OXCT1 expression in HepG2 cells expressing SP1 shRNA or NTC, or in HepG2 cells pretreated with vehicle (DMSO) or MIT (20 nM) for 2 h, under normal or SS conditions for 48 h. (G) Western blot analysis of SP1 and OXCT1 levels in HepG2 cells expressing pSIN-SP1 or pSIN-EV. (H) HEK293 cells were co-transfected with SP1 shRNAs and pGL2-OXCT1-promoter or pGL2-EV luciferase reporter vectors, and 24 h after transfection, medium was changed to normal (Nor) or SS for another 24 h, followed by dual luciferase assay. Data were presented as mean ± SD. *P< 0.05 as compared between the indicated groups. (I) HEK293 cells were co-transfected with pSIN-SP1 and pGL2-P-GCbox (GCbox-1/2 wt), pGL2-P-GCbox mutants (GCbox-1/2 mt) or pGL2-P-EV luciferase vectors. Dual luciferase assay were performed 24 h after transfection. Data were presented as mean ± SD. *P< 0.05 as compared between the indicated groups. (J) The occupancy of potential GC-box (GCBox-1/2) by SP1 was analyzed by ChIP assay in HepG2 cells cultured under normal (Nor) or SS conditions for the indicated hours using anti-SP1 antibody or IgG control. Data were presented as mean ± SD. *P< 0.05 as compared with corresponding Nor group. (K) HepG2 cells stably expressing SP1 shRNAs or NTC were further infected with viruses expressing pBaBe-myr-flag-AKT (myr-AKT) or pBaBe-EV, followed by western blot analysis of AKT1, p-SP1 (threonine 453 phosphorylation of SP1), SP1 and OXCT1 levels. (L) Schematic representation for serum starvation-activated OXCT1 transcription mediated by mTORC2, AKT and SP1. (M) HepG2 cells stably expressing AKT shRNA, SP1 shRNA or NTC were cultured under Nor or SS conditions for 48 h followed by incubating with 5 mM of [2, 4-13C2] β-HB for 24 h and subsequent isotope tracing of 13C-labeled metabolites by GC-MS. Data were presented as mean ± SD. *P< 0.05 as compared with Nor-treated NTC group; #P< 0.05 as compared with SS-treated NTC group.
Figure 4
Figure 4
Ketolysis suppresses AMPK activation and autophagy in nutrition-starved HCC cells by elevating ATP production. (A) Western blot analysis of OXCT1 and LC3-I/II levels in HepG2 cells stably expressing OXCT1 shRNA or NTC under normal or SS conditions for 24 h. (B) HepG2 cells stably expressing OXCT1 shRNA or NTC were further infected with viruses expressing pSIN-GFP-LC3 and cultured under Nor or SS conditions for 24 h. The percentage of cells exhibiting punctate fluorescence under fluorescence microscopy was calculated relative to all GFP-positive cells. Data were presented as mean ± SD. *P< 0.05 as compared with Nor-treated NTC group; #P< 0.05 as compared with SS-treated NTC group. (C) HepG2 cells stably expressing OXCT1 shRNA (targeting 3′UTR) were further infected with viruses expressing pSIN-3×flag-OXCT1 or pSIN-EV. Each group of cells was treated with vehicle (DMSO) or AICAR (1 mM) for 2 h prior to serum starvation for 24 h. OXCT1 and LC3-I/II protein levels were detected by western blot. (D) HepG2 cells in C were further infected with viruses expressing pSIN-GFP-LC3. Each group of cells was treated with vehicle (DMSO) or AICAR (1 mM) for 2 h prior to serum starvation for 24 h. Percentage of cells exhibiting punctate fluorescence under fluorescence microscopy was calculated relative to all GFP-positive cells. Data were presented as mean ± SD. *P< 0.05 as compared between the indicated group. (E) HepG2 cells stably expressing OXCT1 shRNA (targeting 3′UTR) or NTC were further infected with viruses expressing pSIN-3×flag-OXCT1 or pSIN-EV. Each group of cells was cultured under normal (0 h) or serum starvation (SS) conditions for 12 or 24 h, followed by western blot analyzing OXCT1, AMPK and p-AMPK levels. (F) HepG2 cells stably expressing OXCT1 shRNA or NTC were cultured under normal (0 h) or SS conditions for 24 h in the presence or absence of 5 mM β-HB, followed by western blot analysis of OXCT1, AMPK, p-AMPK and LC3-I/II. (G) HepG2 cells in F were further infected with viruses expressing pSIN-GFP-LC3. Cells was cultured under Nor or SS conditions for 24 h in the presence or absence of 5 mM β-HB. Percentage of cells exhibiting punctate fluorescence under fluorescence microscopy was calculated relative to all GFP-positive cells. Data were presented as mean ± SD. *P< 0.05 as compared between the indicated group. (H) HepG2 cells stably expressing pSIN-3×flag-OXCT1 or EV were further infected with viruses expressing AKT shRNA or NTC. Cells were cultured under normal or SS conditions for 24 h, followed by western blot analyzing AKT, OXCT1, AMPK, p-AMPK and LC3-I/II levels. (I) HepG2 cells in H were further infected with viruses expressing GFP-LC3. Each group of cells was cultured under Nor or SS conditions for 24 h. Percentage of cells exhibiting punctate fluorescence under fluorescence microscopy was calculated relative to all GFP-positive cells. Data were presented as mean ± SD. *P< 0.05 as compared between the indicated group.
Figure 5
Figure 5
OXCT1 promotes HCC progression in vivo. (A) HepG2 cells stably expressing OXCT1 or EV were injected subcutaneously into nude mice (n = 5 for each group). Tumor growth was measured starting from 9 days after inoculation, and tumors were extracted and compared at the end of the experiment. Data shown are mean ± SD. *P< 0.05 as compared with EV group. (B) Protein levels of OXCT1 and LC3-I/II were determined by western blot using the lysates from five independent tumors of each group as in A. (C) HepG2 cells stably expressing OXCT1 shRNA or NTC were injected subcutaneously into nude mice (n = 5 for each group). Tumor growth was measured starting from 9 days after inoculation, and tumors were extracted and compared at the end of the experiment. Data shown are mean ± SD. *P< 0.05 as compared with NTC group. (D) Protein levels of OXCT1 and LC3-I/II were determined by western blot using the lysates from five independent tumors of each group as in C. (E) HepG2 cells stably expressing OXCT1 or EV were subcutaneously injected into nude mice (n = 5 for each group). Starting from the inoculation, mice were administered with either saline or saline containing β-HB (500 mg/kg) by daily i.p. injection. Tumor growth was measured starting from 9 days after inoculation. Tumors were extracted and compared at the end of the experiment. Data shown are mean ± SD. *P< 0.05 as compared between the indicated groups. (F) Protein levels of OXCT1 and LC3-I/II were determined by western blot using the lysates of tumor tissues from each group as in E.
Figure 6
Figure 6
Aberrant OXCT1 expression predicts patient mortality in clinical HCC. (A) Serum β-HB levels were measured in 29 normal subjects (n = 29) and 35 HCC patients (n = 35). Data were presented as mean ± SD. *P< 0.001 as compared between two groups. (B) mRNA levels of OXCT1 were determined by qRT-PCR in 20 pairs of clinically matched tumor adjacent non-cancerous liver tissues (normal) and human HCC tissues (tumor). Data were presented as mean ± SD (n = 20). *P< 0.05 as compared between two groups. (C) p-SP1, SP1 and OXCT1 levels were determined by western blot using the paired tumor adjacent non-cancerous liver tissues (normal) and human HCC tissues (tumor). (D) Representative IHC analysis of OXCT1 expression in normal liver tissues (normal) and HCC specimens of different clinical stages (I-IV) was shown. (E) Statistical quantification of the mean optical density (MOD) values of OXCT1 staining in IHC assay between normal liver tissues and HCC specimens of different clinical stages (I-IV). The MOD of OXCT1 staining increases as HCC progresses to a higher clinical stage. Data were presented as mean ± SD. *P< 0.05 as compared with normal control group. (F) Kaplan-Meier curves with univariate analyses for patients with low versus high OXCT1 expression; n = 79 for each group.
Figure 7
Figure 7
Ketolysis induced by nutrition deprivation suppresses autophagy to promote liver cancer progression. Schematic showing that, unlike normal liver cells, HCC could use ketone bodies produced by cancer cell themselves, normal liver cells or other potential sources from the tumor microenvironment. Mechanistically, serum starvation-induced OXCT1 expression via mTORC2-AKT-SP1 signaling promotes ketone body catabolism to elevate cellular ATP levels in HCC cells, which inhibits AMPK activation and protects liver cancer cells from excessive autophagy under nutrition limitation conditions.

Comment in

Similar articles

Cited by

References

    1. Boroughs LK, DeBerardinis RJ. Metabolic pathways promoting cancer cell survival and growth. Nat Cell Biol 2015; 17:351–359. - PMC - PubMed
    1. Vander Heiden MG, Cantley LC, Thompson CB. Understanding the Warburg effect: the metabolic requirements of cell proliferation. Science 2009; 324:1029–1033. - PMC - PubMed
    1. DeNicola GM, Cantley LC. Cancer's fuel choice: new flavors for a picky rater. Mol Cell 2015; 60:514–523. - PMC - PubMed
    1. Comerford SA, Huang Z, Du X, et al. Acetate dependence of tumors. Cell 2014; 159:1591–1602. - PMC - PubMed
    1. Lyssiotis CA, Cantley LC. Acetate fuels the cancer engine. Cell 2014; 159:1492–1494. - PubMed

MeSH terms