

Case Reports
doi: 10.1007/s00401-016-1618-1.
Epub 2016 Sep 19.
[18F]AV-1451 tau-PET uptake does correlate with quantitatively measured 4R-tau burden in autopsy-confirmed corticobasal degeneration
Affiliations
- PMID: 27645292
- PMCID: PMC5107140
- DOI: 10.1007/s00401-016-1618-1
Item in Clipboard
Case Reports
[18F]AV-1451 tau-PET uptake does correlate with quantitatively measured 4R-tau burden in autopsy-confirmed corticobasal degeneration
Acta Neuropathol.
2016 Dec.
No abstract available
Figures
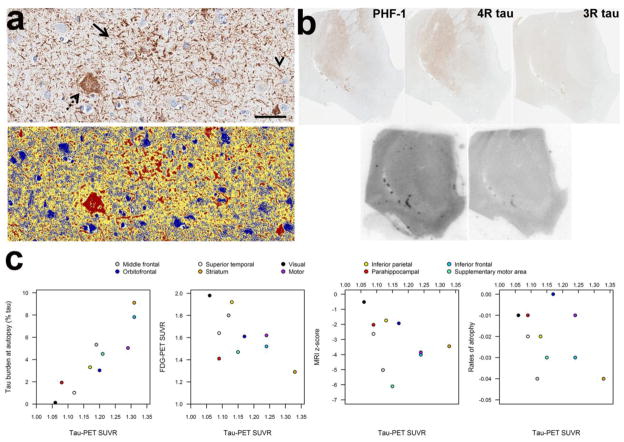
Autopsy findings (a), autoradiography (b) and scatter-plots showing the
relationship between tau-PET SUVR and tau burden at autopsy, as well as other
measures of neurodegeneration (c). Panel a shows the tau burden
assessment in our patient with CBD. Top image shows the tau immunostained tissue
(CP13, mouse IgG1, 1:1000, Peter Davies, Albert Einstein College of Medicine,
Bronx, NY), with the bottom image showing the custom-designed color
deconvolution algorithm to highlight tau deposition (shown in red).
Characteristic astrocytic plaques (arrow), ballooned neurons (dashed arrow), and
thread-like processes (arrowhead) were observed and quantified. (Scale bar
= 50 μm). Images shown are from inferior frontal cortex.
Panel b shows tau immunohistochemistry and correlative
autoradiography. Top row shows tau immunohistochemistry with PHF-1(1:1000 mouse
monoclonal anti-phospho-serine 396/404 tau, gift from Peter Davies), 4R tau and
3R tau (RD4 and RD3, mouse IgG, Millipore, Temecula, CA) going from left to
right (note 3R tau staining was negative) and bottom row shows
[18F]AV-1451 autoradiography and [18F]AV-1451
blocked autoradiography in the nucleus accumbens. There was minimal,
displaceable [18F]AV-1451 autoradiography binding corresponding
to regions where 4R burden was most dense on immunohistochemistry. Panel
c shows scatter-plots of the relationship between tau-PET SUVR and
tau burden at autopsy, FDG-PET SUVR, MRI z-scores, and MRI rates of atrophy. The
tau-PET data used in the correlation with tau burden at autopsy was calculated
over grey and white matter within the ROI, whereas the tau-PET data used in the
imaging plots was calculated over grey matter only to match the FDG and MRI
data.
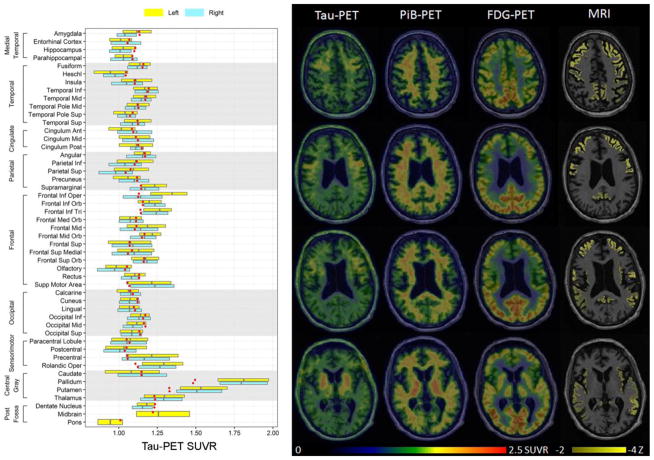
Tau-PET, PiB-PET, FDG-PET and MRI from our CBD patient. The tau-PET findings are
shown on representative axial slices through the brain and in a box-plot showing
regional SUVR values for the left and right hemisphere. Regional values were
generated using the automated anatomical labeling atlas, with boxes representing
median, 25th and 75th percentile values across all the
voxels in each region. The red dots represent the median tau-PET SUVRs from a
group of controls matched by age and gender to our patient. Tau-PET revealed
increased signal in the putamen, pallidum, thalamus, precentral cortex, rolandic
operculum, supplemental motor area, and left Broca’s area (frontal
inferior opercular and frontal inferior triangularis). The PiB-PET, FDG-PET and
MRI scans are also shown on representative axial slices. The three PET scans are
shown on the same color scale while MRI scan highlights regions with z-scores
between -2 and -4 standard deviations from controls. No increased signal was
observed on PiB-PET. The FDG-PET revealed hypometabolism in the caudate nucleus,
insula and throughout the posterior frontal lobes, including medial and lateral
premotor and primary motor cortices, with greater abnormalities observed in the
left hemisphere. The MRI showed more widespread abnormalities throughout the
brain, although the most severe atrophy was observed in the frontal lobe. Inf
= inferior, Mid = middle, Sup = superior, Ant =
anterior, Post = posterior, Orb = orbital, Tri =
triangularis.
References
-
- Dickson DW, Bergeron C, Chin SS, et al. Office of Rare Diseases neuropathologic criteria for corticobasal degeneration. J Neuropathol Exp Neurol. 2002;61:935–946. - PubMed
Publication types
MeSH terms
Substances
Grants and funding
LinkOut - more resources
Full Text Sources
Other Literature Sources
Medical
