. 2016 Oct 7;15(10):3883-3895.
doi: 10.1021/acs.jproteome.6b00733. Epub 2016 Sep 27.

AltitudeOmics: Red Blood Cell Metabolic Adaptation to High Altitude Hypoxia

Affiliations

AltitudeOmics: Red Blood Cell Metabolic Adaptation to High Altitude Hypoxia

Angelo D'Alessandro et al. J Proteome Res. .

Abstract

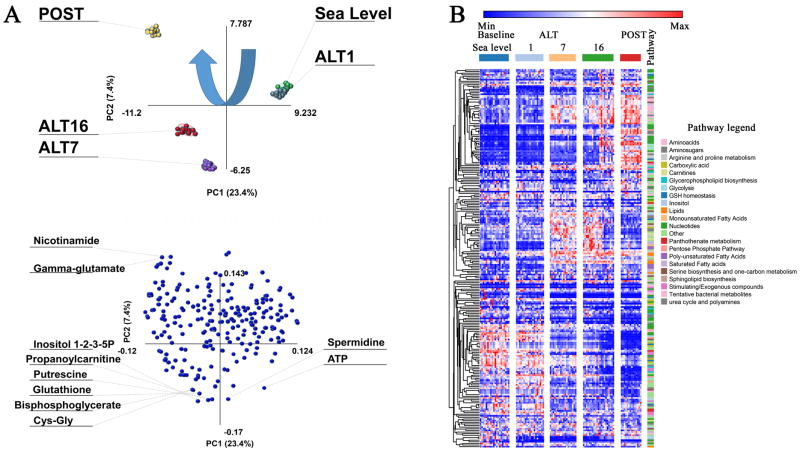
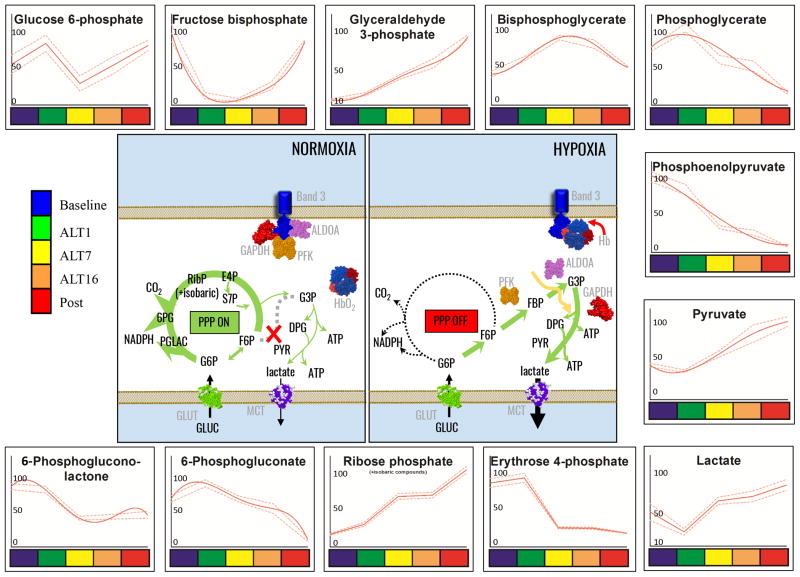
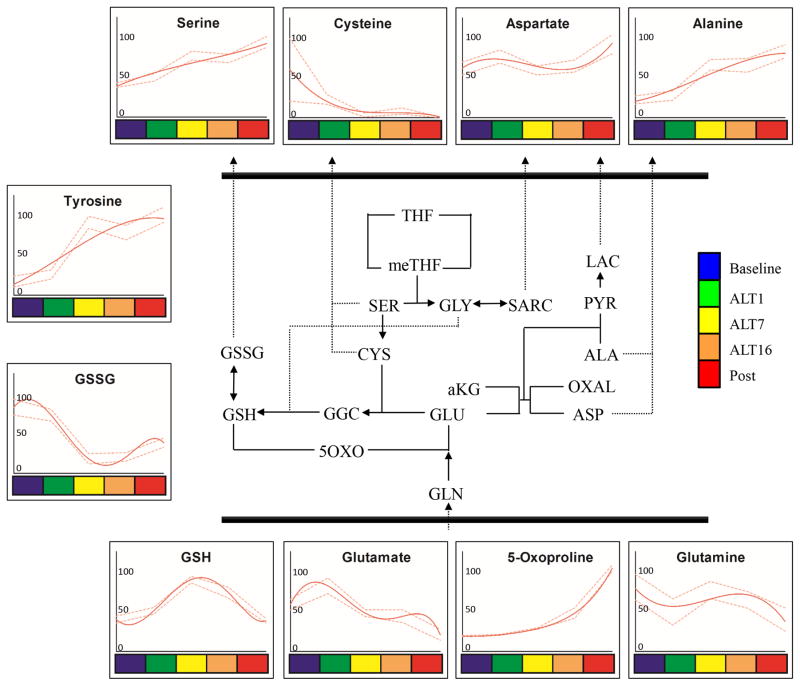
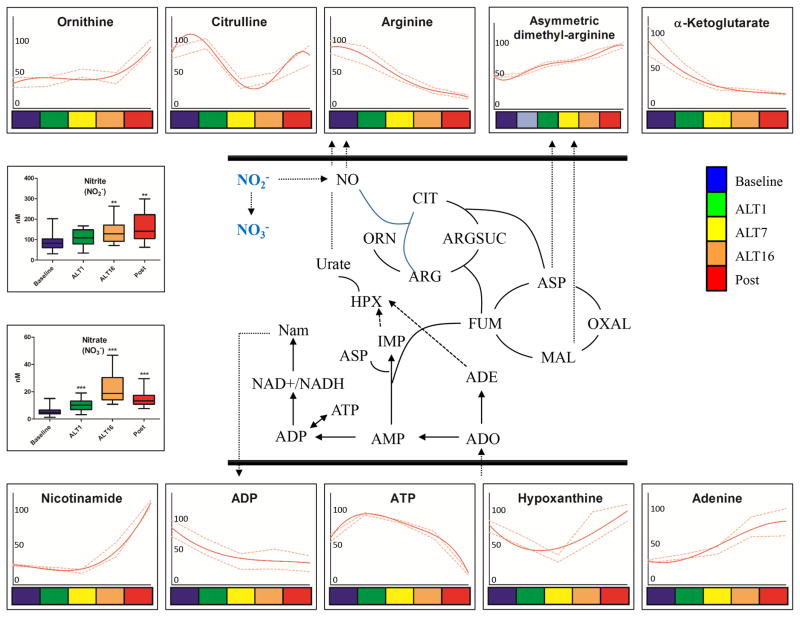
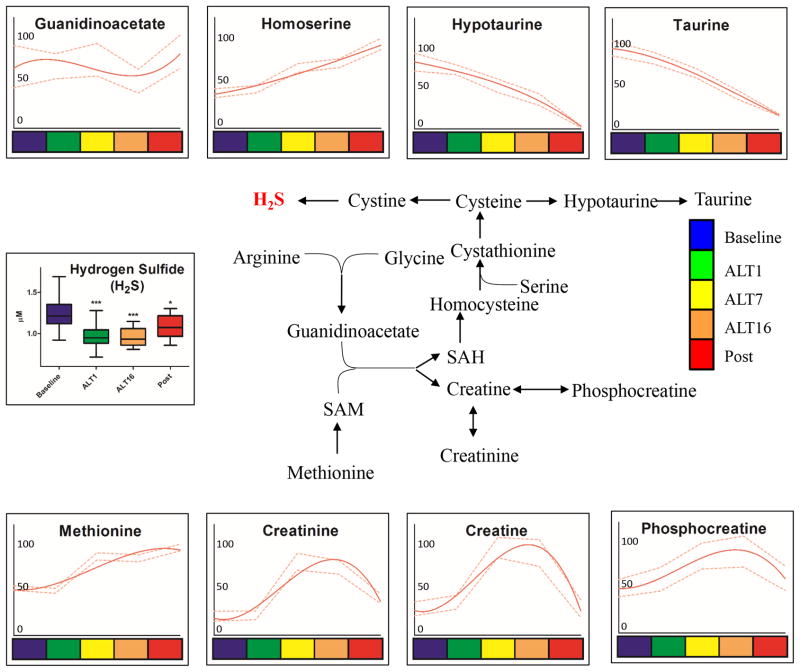
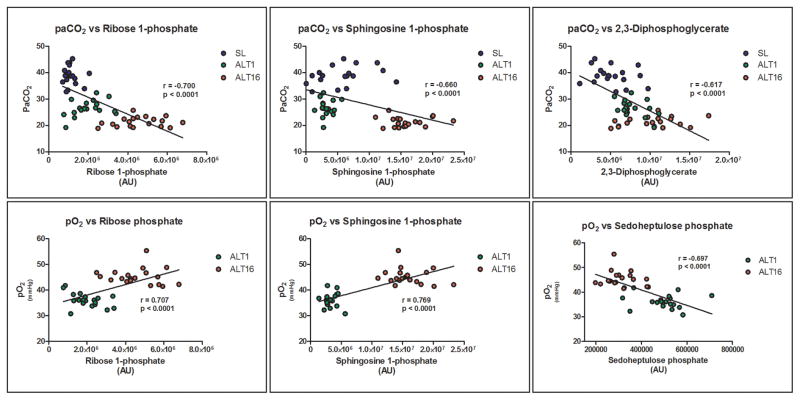
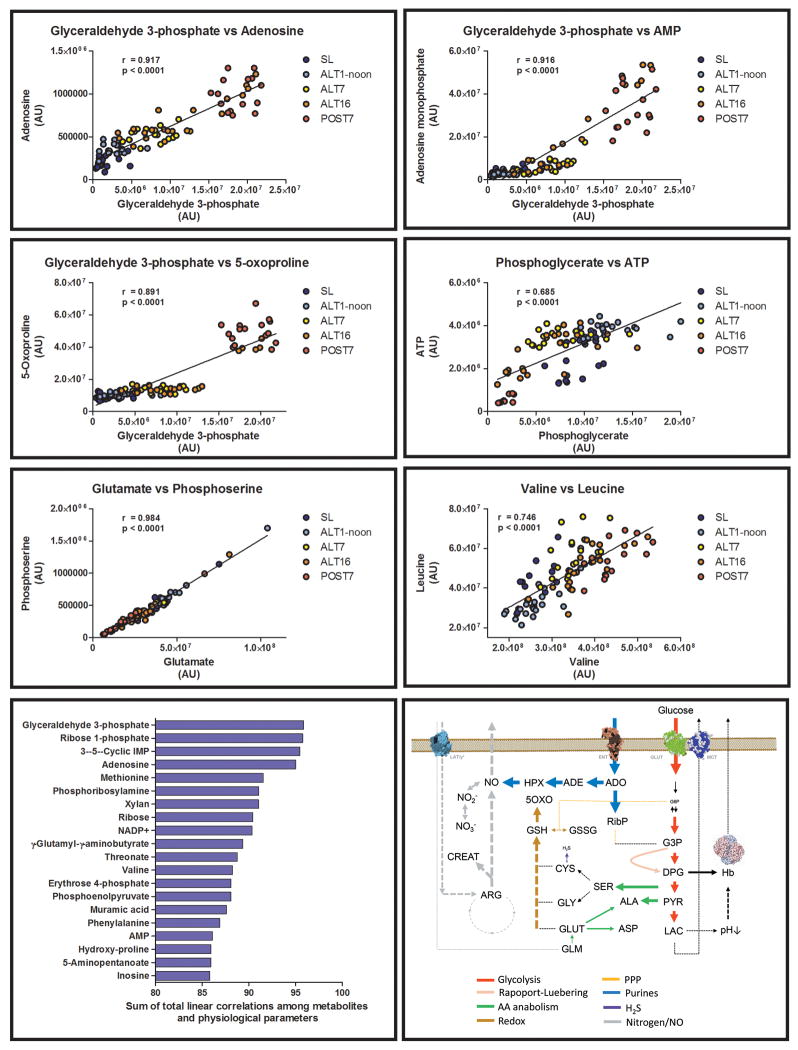
Red blood cells (RBCs) are key players in systemic oxygen transport. RBCs respond to in vitro hypoxia through the so-called oxygen-dependent metabolic regulation, which involves the competitive binding of deoxyhemoglobin and glycolytic enzymes to the N-terminal cytosolic domain of band 3. This mechanism promotes the accumulation of 2,3-DPG, stabilizing the deoxygenated state of hemoglobin, and cytosol acidification, triggering oxygen off-loading through the Bohr effect. Despite in vitro studies, in vivo adaptations to hypoxia have not yet been completely elucidated. Within the framework of the AltitudeOmics study, erythrocytes were collected from 21 healthy volunteers at sea level, after exposure to high altitude (5260 m) for 1, 7, and 16 days, and following reascent after 7 days at 1525 m. UHPLC-MS metabolomics results were correlated to physiological and athletic performance parameters. Immediate metabolic adaptations were noted as early as a few hours from ascending to >5000 m, and maintained for 16 days at high altitude. Consistent with the mechanisms elucidated in vitro, hypoxia promoted glycolysis and deregulated the pentose phosphate pathway, as well purine catabolism, glutathione homeostasis, arginine/nitric oxide, and sulfur/H2S metabolism. Metabolic adaptations were preserved 1 week after descent, consistently with improved physical performances in comparison to the first ascendance, suggesting a mechanism of metabolic memory.

Keywords: hydrogen sulfide; mass spectrometry; metabolic linkage; metabolomics; nitric oxide; red blood cell.


Conflict of interest statement

Conflict of interest All the authors disclose no conflict of interests relevant to this study.

Figures

Figure 1
Figure 1. Partial least-square discriminant analysis (PLS-DA) and hierarchical clustering analysis (HCA) of metabolomics data from AltitudeOmics red blood cells
In A, PLS-DA of red blood cells metabolomics data from the volunteers involved in the AltitudeOmics study, either collected at sea level, after one, seven or sixteen days at high altitude (ALT1, 7 and 16, respectively), or following volunteer reascending to the mountain 7 days after descending to 1525m. In the top panel each node represents a different sample. In the bottom panel, each node represents a metabolite (variable) in the loading plot. Top ten metabolites with the highest loadings along principal components 1 and 2 (PC1 and PC2) are shown. Percentages of variances are provided for each component. In B, HCA (1-Pearson’s correlation) of metabolites in each sample across each time point are plotted as heat maps. Z-score normalizations have bene performed intra-row and values are color coded from blue to red (low to high). Pathways are color coded in the right hand legend. An extended version of this panel, also including metabolite and sample names is provided in Supplementary Figure 1.
Figure 2
Figure 2. Glycolysis and pentose phosphate pathway in RBC AltitudeOmics samples
Glycolytic and Pentose Phosphate Pathway metabolites from RBC AltitudeOmics samples are graphed as interpolation curves (solid red line) ± standard deviations (gaped red lines) across each time point, color coded as indicated in the left hand legend. In the center, the figure schematizes the expected effect of oxygen-dependent metabolic modulation through competitive inhibitory binding of glycolytic enzyme and deoxyhemoglobin to the N-terminal cytosolic domain of band 3. In each graph, the y axis indicates integrated peak areas normalized against the highest reading at any time point.
Figure 3
Figure 3. Glutathione homeostasis and transamination pathways in RBC AltitudeOmics samples
Glutathione homeostasis and transamination pathways (pathway schematized in the center) metabolites from RBC AltitudeOmics samples are graphed as interpolation curves (solid red line) ± standard deviations (gaped red lines) across each time point, color coded as indicated in the right hand legend. In each graph, the y axis indicates integrated peak areas normalized against the highest reading at any time point.
Figure 4
Figure 4. Nitric oxide and purine homeostasis pathways in RBC AltitudeOmics samples
Nitric oxide, urea cycle and purine homeostasis (pathway schematized in the center) metabolites from RBC AltitudeOmics samples are graphed as interpolation curves (solid red line) ± standard deviations (gaped red lines) across each time point, color coded as indicated in the right hand legend. In each graph, the y axis indicates integrated peak areas normalized against the highest reading at any time point.
Figure 5
Figure 5. Sulphur and arginine metabolic pathways in RBC AltitudeOmics samples
Sulphur and arginine pathways (pathway schematized in the center) metabolites from RBC AltitudeOmics samples are graphed as interpolation curves (solid red line) ± standard deviations (gaped red lines) across each time point, color coded as indicated in the right hand legend. In each graph, the y axis indicates integrated peak areas normalized against the highest reading at any time point.
Figure 6
Figure 6. Linear correlations of metabolite levels and physiological parameters
Physiological parameters assayed in AltitudeOmics volounteers were correlated to metabolite levels at matched time points (sea level – SL, altitude 1 and 16 – ALT1 and ALT16), color-coded as per the right hand legend. Linear correlations and statistical significance are shown for each panel.
Figure 7
Figure 7. Linear correlation of metabolite levels in AltitudeOmics RBCs and the concept of metabolic linkage
Metabolite levels at each time point (sea level – SL, altitude 1, 7, 16 – ALT1, 7, 16, or following reascending 7 days after descending to 1525m – POST; color coded as detailed in the right hand panels) were correlated (Pearson linear correlation). Linear correlations (r) and statistical significance are provided for each panel. Metabolites showing linear correlations as high as ~0.9 are suggestive of the existence of a “metabolic linkage” between those metabolites, i.e. the relative levels of these metabolites are significantly dependent among each other. Sums were calculated by adding absolute values for linear correlations for each metabolite against other metabolites and physiological parameters. Results were thus sorted to obtain a rank of metabolites with the highest total correlations with other metabolites and physiological parameters, indicating their centrality in metabolic adaptations to hypoxia. The bottom right panel summarizes the main metabolic adaptations observed in RBCs after acute and chronic exposure to high altitude hypoxia. Pathways are color-coded and arrow widths indicate relative fluxes through the pathway.

References

    1. Semenza GL. Hypoxia-Inducible Factor 1 and Cardiovascular Disease. Annu Rev Physiol. 2014;76(1):39–56. - PMC - PubMed
    1. Stenmark KR, Fagan KA, Frid MG. Hypoxia-Induced Pulmonary Vascular Remodeling Cellular and Molecular Mechanisms. Circ Res. 2006;99(7):675–691. - PubMed
    1. D’Alessandro A, Kriebardis AG, Rinalducci S, Antonelou MH, Hansen KC, Papassideri IS, Zolla L. An update on red blood cell storage lesions, as gleaned through biochemistry and omics technologies. Transfusion. 2015;55(1):205–219. - PubMed
    1. Peltz E, D’Alessandro A, Moore E, Chin T, Silliman C, Sauaia A, Hansen K, Banerjee A. Pathologic metabolism: An exploratory study of the plasma metabolome of critical injury. J Trauma Acute Care Surg. 2015;78(4):742–51. - PMC - PubMed
    1. Drew KL, Harris MB, LaManna JC, Smith MA, Zhu XW, Ma YL. Hypoxia tolerance in mammalian heterotherms. J Exp Biol. 2004;207(18):3155–3162. - PubMed

Publication types