. 2017 Nov;22(11):1562-1575.
doi: 10.1038/mp.2016.152. Epub 2016 Sep 20.

The transcription factor XBP1s restores hippocampal synaptic plasticity and memory by control of the Kalirin-7 pathway in Alzheimer model

Affiliations

The transcription factor XBP1s restores hippocampal synaptic plasticity and memory by control of the Kalirin-7 pathway in Alzheimer model

M Cissé et al. Mol Psychiatry. 2017 Nov.

Abstract

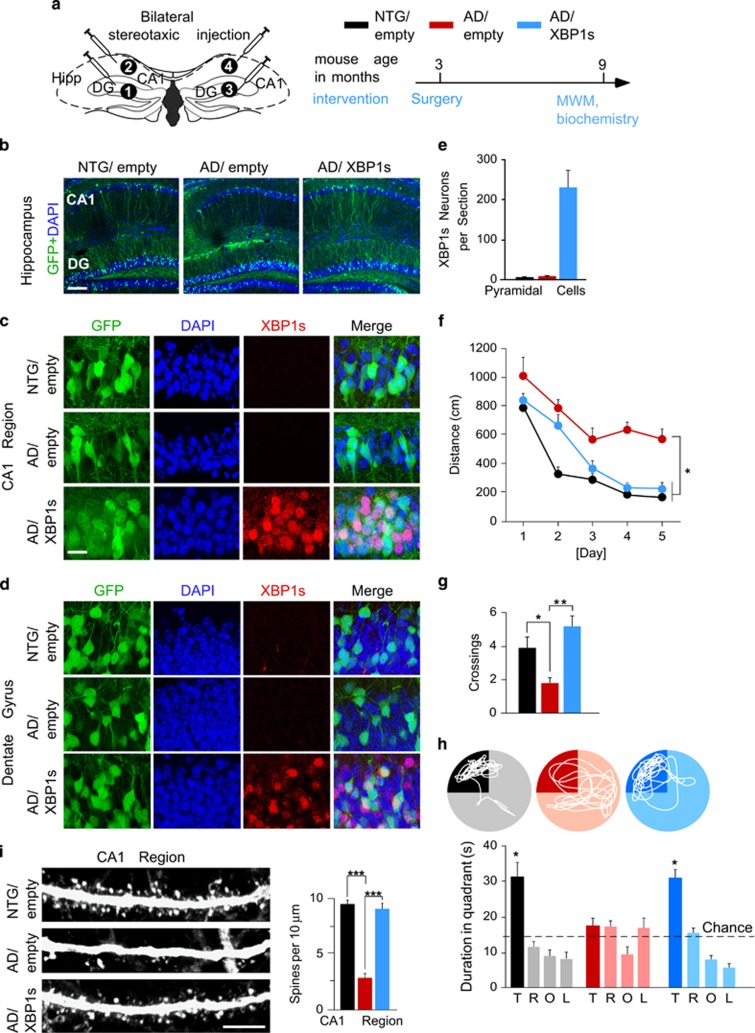
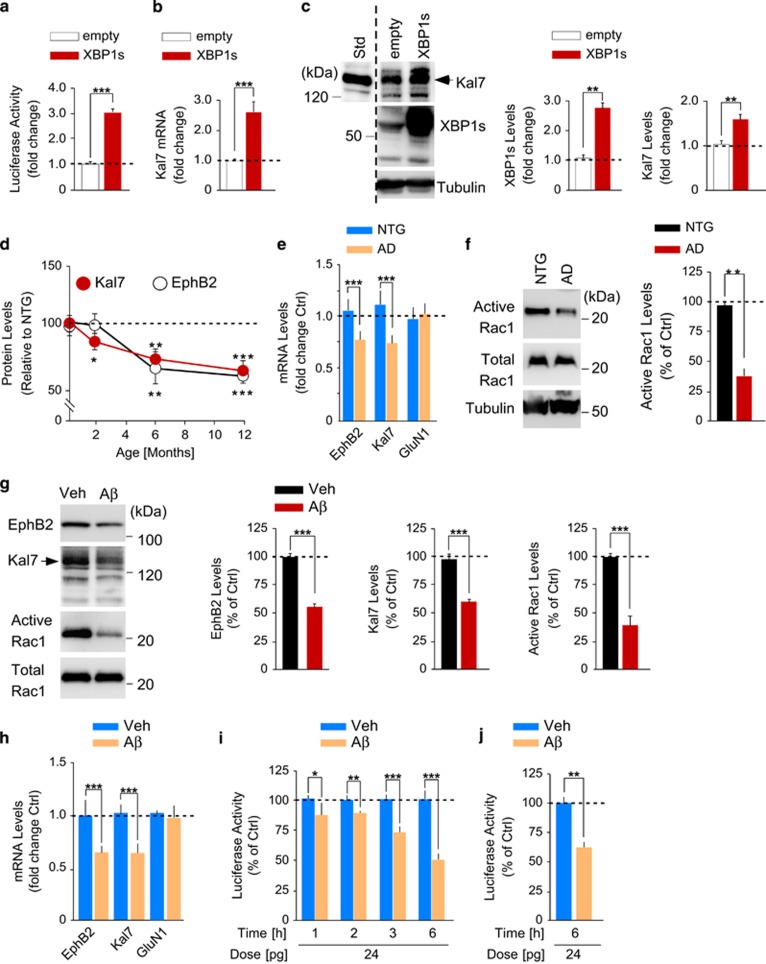
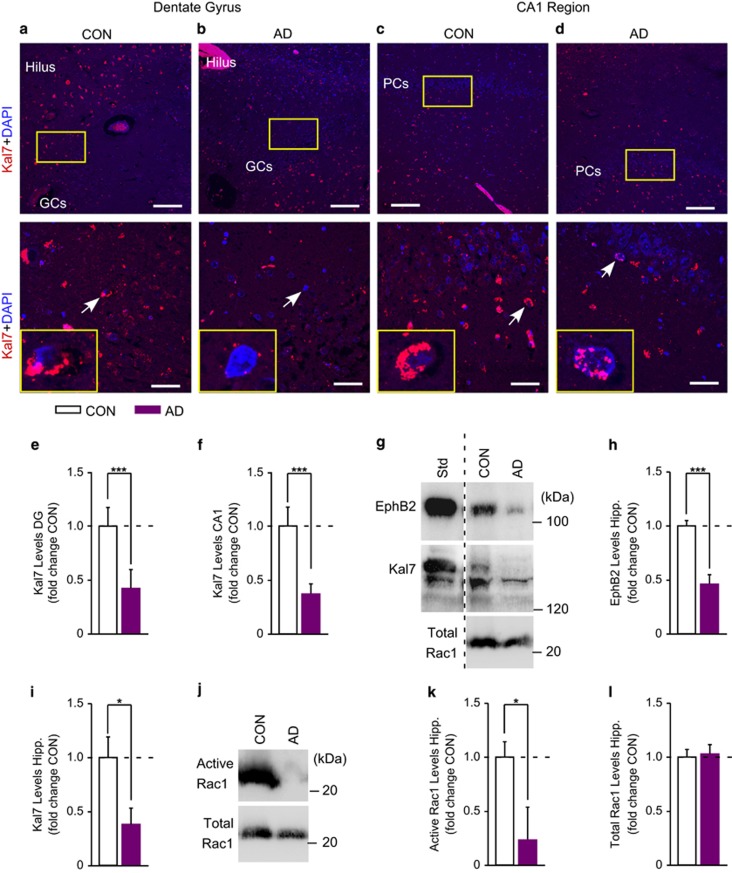
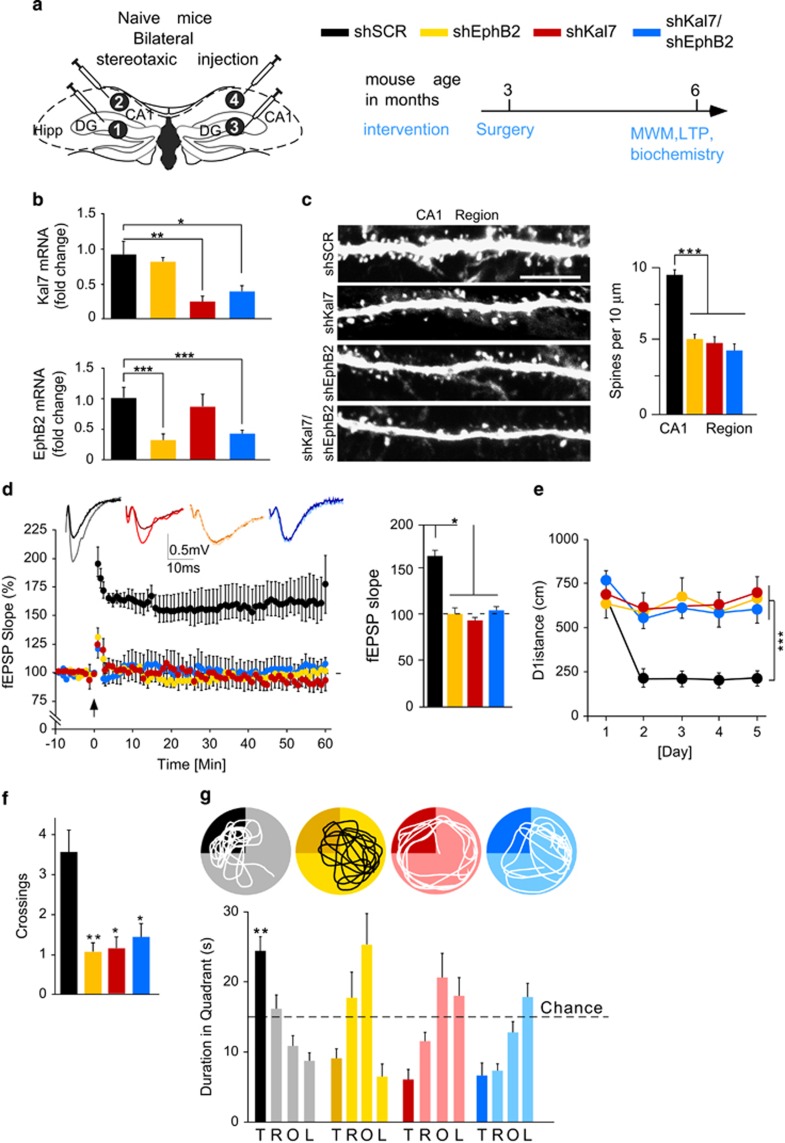
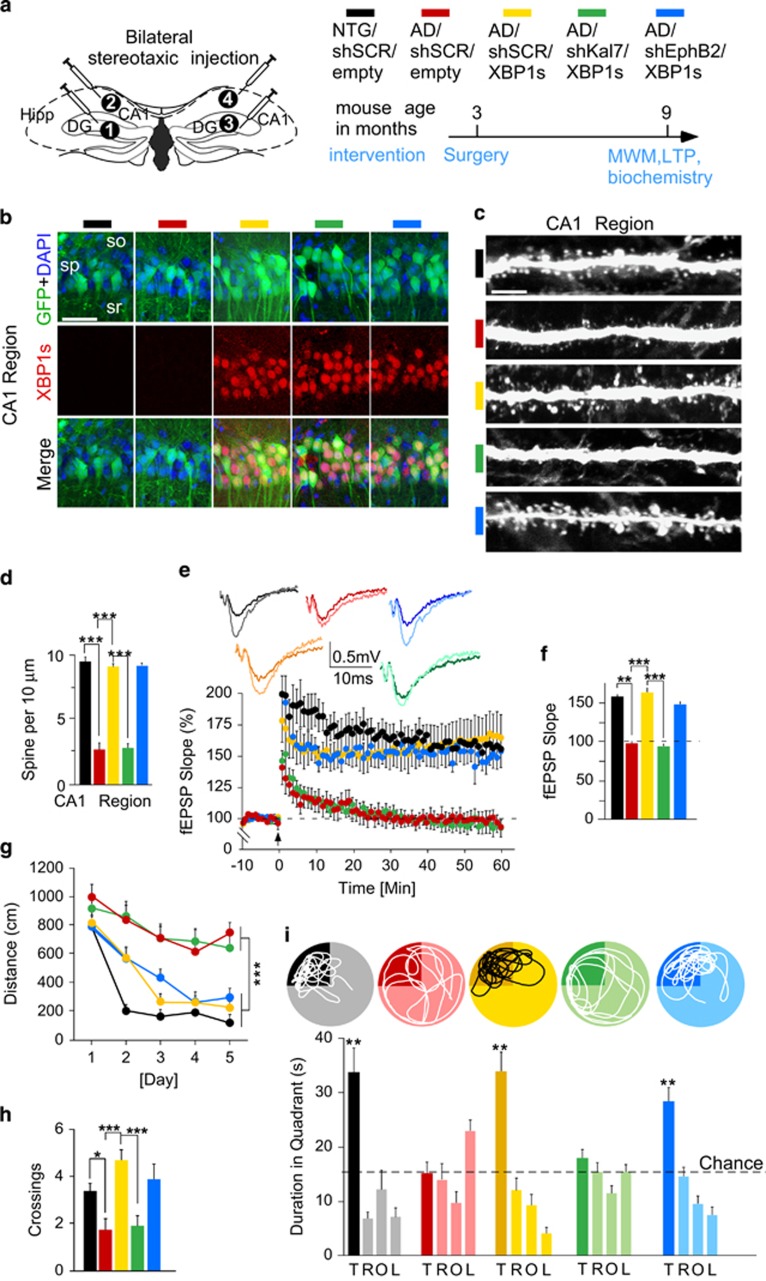
Neuronal network dysfunction and cognitive decline constitute the most prominent features of Alzheimer's disease (AD), although mechanisms causing such impairments are yet to be determined. Here we report that virus-mediated delivery of the active spliced transcription factor X-Box binding protein 1s (XBP1s) in the hippocampus rescued spine density, synaptic plasticity and memory function in a mouse model of AD. XBP1s transcriptionally activated Kalirin-7 (Kal7), a protein that controls synaptic plasticity. In addition, we found reduced levels of Kal7 in primary neurons exposed to Aβ oligomers, transgenic mouse models and human AD brains. Short hairpin RNA-mediated knockdown of Kal7 altered synaptic plasticity and memory formation in naive mice. Further, reduction of endogenous Kal7 compromised the beneficial effects of XBP1s in Alzheimer's model. Hence, our findings reveal that XBP1s is neuroprotective through a mechanism that engages Kal7 pathway with therapeutic implications in AD pathology.


Conflict of interest statement

The authors declare no conflict of interest.

Figures

Figure 1
Figure 1
Expressing XBP1s in the hippocampus rescues cognitive function in 3xTg-AD mice. (a) Left, stereotaxic injection of lentiviral vectors into the hippocampus of 3xTg-AD (AD) and nontransgenic (NTG) control mice. Right, timeline of Morris water maze (MWM) test and subsequent biochemical analysis of mice. (b) Representative immunofluorescence (IF) images showing GFP-positive cells (green) and DAPI staining (blue). Scale bar, 100 μm. (c, d) Representative IF images showing XBP1s expression in CA1 region (c) and DG (d) at high magnification. Scale bar, 20 μm. (e) Quantitation of XBP1s expression by IF in the CA1 region. (f) Spatial learning curves in the MWM showing distance traveled to reach the hidden platform (n=8 mice per group). Kruskal–Wallis test on day 1: H=5.066, P>0.05; Kruskal–Wallis test on day 5: H=10.6082, P<0.001. Mann–Whitney post hoc test: AD/empty versus all other groups on Day 5, *P<0.05. (g) A probe trial showing crossings of the platform location. Kruskal–Wallis test: H=10.2162, P<0.001. Mann–Whitney post hoc test. (h) A probe trial showing time spent per quadrant in the MWM (T, target; R, right; O, opposite; L, left). Univariate Mann–Whitney test (versus chance): NTG/empty, U=21, P<0.05; AD/empty, U=11, P>0.05; AD/XBP1s, U=21, P<0.05. (i) Spine density in CA1 region (Number of slices per mouse/number of mice: 5/7 per group). Kruskal–Wallis test: H=40.5554, P<0.001. Nemenyi post hoc test. Scale bar, 10 μm. All values are mean±s.e.m.
Figure 2
Figure 2
XBP1s and Aβ differently affect Kalirin-7 signaling. (a) Luciferase activity of SH-SY5Y human neuroblastoma cells cotransfected with Kalirin-7 (Kal7) promoter and XBP1s or empty vector. Mann–Whitney test: U=−3.4879, P<0.001. (b, c) Kal7 mRNA (b) and protein (c) levels in hippocampal primary neuronal cultures infected with viral particles expressing XBP1s or no transgene product (empty). Mann–Whitney test: Kal7 mRNA: U=−3.182, P<0.001; XBP1s levels: U=−2.8823, P<0.01; Kal7 levels: U=−2.7222, P<0.01. (d) Western blot analysis revealed the timecourse of Kal7 and EphB2 expression in the hippocampus of 3xTg-AD (AD) and nontransgenic (NTG) mice (n=9–11 mice per group). (e) qRT-PCR results showing mRNA levels of Kal7, EphB2 and GluN1 in the hippocampus of 6-month-old AD and NTG mice (n=9-11 mice per group). Mann–Whitney test: EphB2: U=−3.0253, P<0.001; Kal7: U=−3.2205, P<0.001; GluN1: U=0.488, P>0.05. (f) Representative western blot images and quantification of total and active Rac1 levels in the hippocampus of 6-month-old AD and NTG mice (n=8–12 mice per group). Mann–Whitney test: U=−3, P<0.01. (g) Representative western blot images and quantification of EphB2, Kal7, active Rac1 levels in primary neurons exposed to Aβ or vehicle (veh). Mann–Whitney test: EphB2: U=2.8924, P<0.001; Kal7: U=2.8824, P<0.001; active Rac1: U=−3.0027, P<0.001. (h) qRT-PCR results showing mRNA levels of EphB2, Kal7 and GluN1 in hippocampal primary neuronal cultures exposed to Aβ or vehicle (veh). Mann–Whitney test: EphB2: U=−2.8868, P<0.001; Kal7: U=−3.1044, P<0.001; GluN1: U=−0.2312, P>0.05. (i, j) Luciferase activity of SH-SY5Y cells transfected with EphB2 (i) or Kal7 promoter (j), and treated with CHO cells-derived Aβ or vehicle (veh) for indicated times. Mann–Whitney test: EphB2 promoter 1 h, U=2.2517, P<0.05; EphB2 promoter 2 h, U=2.9581, P<0.01; EphB2 promoter 3 h, U=3.5762, P<0.001; EphB2 promoter 6 h, U=3.5762, P<0.001; Kal7 promoter, U=2.8823, P<0.01. For all experiments, n=12 wells per condition from at least five independent experiments. All values are mean±s.e.m.
Figure 3
Figure 3
Kalirin-7 levels are reduced in the hippocampus of patients with Alzheimer’s disease. (ad) Representative immunohistochemical images depicting cytoplasmic Kalirin-7 (Kal7) in neurons of hippocampal dentate gyrus (DG) (a, b) and CA1 region (c, d) from patients with Braak and Braak (BB) stages V–VI (n=12) compared with healthy BB0 control brains (CON, n=5). Scale bar: 100 μm (upper images), 20 μm (lower images). PCs, pyramidal cells; GCs, granule cells. (e, f) Quantitative assessment of Kal7 levels in ad. Mann–Whitney test: Kal7 levels DG: U=−3.5529, P<0.001; Kal7 levels CA1: U=−3.5529, P<0.001. (gl) Western blot analysis and quantitation of EphB2 (g, h), Kal7 (g, i), active and total Rac1 (j-l) in hippocampal lysates from patients with BBV-VI (n=9) compared with healthy BB0 control brains (CON, n=9). Mann–Whitney test: EphB2: U=3.0565, P<0.001; Kal7: U=−2.313, P<0.05; active Rac1: U=−2.3834, P<0.05; total Rac1: U=−0.751, P>0.05. All values are mean±s.e.m.
Figure 4
Figure 4
Reducing Kalirin-7 levels induces synaptic and cognitive deficits in naive mice. (a) Left, bilateral stereotaxic injection of lentiviral vectors into the hippocampus of naive mice. Right, timeline of Morris water maze (MWM) test and subsequent biochemical analysis of mice. (b) qRT-PCR analysis of EphB2 and Kal7 transcripts in the whole hippocampus (n=5–6 mice per group). Kruskal–Wallis test: EphB2: H=14.4855, P<0.001; Kal7: H=14.3666, P<0.001. Mann–Whitney post hoc test. (c) Spine density in CA1 region (Number of slice per mouse/number of mice: 5/7 per group). Kruskal–Wallis test: H=50.0822, P<0.001. Nemenyi post hoc test. Scale bar, 10 μm. (d) Field excitatory postsynaptic potential (fEPSP) slopes in CA1 region (n=3–4 slices per mouse from 6–7 mice per group). Kruskal–Wallis test: H=9.5095, P<0.05. Mann–Whitney post hoc test on the last 10 min of data. (e) Spatial learning curves in the MWM showing distance traveled to reach the hidden platform (n=12 mice per group). Repeated measures two-way ANOVA: F12,176=4.09, P<0.001. Tukey HSD post hoc test: shSCR versus all other groups on Day 5, ***P<0.001. (f) A probe trial showing number of platform location crossings. Kruskal–Wallis test: H=12.7346, P<0.001. Mann–Whitney post hoc test: NTG/shSCR versus all other groups, *P<0.05; **P<0.01. (g) A probe trial showing the time spent per quadrant (T, target quadrant; R, right; O, opposite; L, left of target). Univariate Mann–Whitney test (versus chance): U=65, P<0.01. All values are mean±s.e.m.
Figure 5
Figure 5
Depletion of Kalirin-7, but not EphB2, abolishes XBP1s-associated rescue of synaptic plasticity and memory in 3xTg-AD mice. (a) Left, stereotaxic injection of lentiviral vectors into the hippocampus of 3xTg-AD (AD) and nontransgenic (NTG) control mice. Right, timeline of Morris water maze (MWM) test and subsequent biochemical analysis of mice. (b) Immunofluorescence images depicting GFP-positive cells with DAPI and XBP1s stainings in CA1 region. Scale bar, 20 μm. (c, d) Spine density in CA1 region (number of slice per mouse/number of mice: 5/7 per group). Kruskal–Wallis test: H=74.2712, P<0.001. Nemenyi post hoc test. Scale bar, 10 μm. (e, f) Field excitatory postsynaptic potential (fEPSP) slopes and average slopes of fEPSP during the last 10 min in CA1 region (n=2–3 slices per mouse from 6–7 mice per group). Kruskal–Wallis test: H=25.6637, P<0.001. Mann–Whitney post hoc test on the last 10 min of data. (g) Spatial learning curves in the MWM showing distances traveled to reach the hidden-platform location (n=12 mice per group). Repeated measures two-way ANOVA: F16,220=4.385, P<0.001. Tukey HSD post hoc test on day 5: NTG/shSCR/empty, AD/shSCR/XBP1s, AD/shEphB2/XBP1s versus AD/shSCR/empty, AD/shKal7/XBP1s, ***P<0.001. (h) A Probe trial showing platform location crossings. Kruskal–Wallis test: H=21.114, P<0.001. Mann–Whitney post hoc test. (i) A Probe trial showing the time spent per quadrant (T, target quadrant; R, right; O, opposite; L, left of target). Univariate Mann–Whitney test (versus chance); NTG/shSCR: U=75, P<0.01; AD/XBP1s: U=78, P<0.01; AD/XBP1s/shEphB2: U=78, P<0.01. All values are mean±s.e.m.

References

    1. Busquets-Garcia A, Gomis-Gonzalez M, Guegan T, Agustin-Pavon C, Pastor A, Mato S et al. Targeting the endocannabinoid system in the treatment of fragile X syndrome. Nat Med 2013; 19: 603–607. - PubMed
    1. Mukai J, Dhilla A, Drew LJ, Stark KL, Cao L, MacDermott AB et al. Palmitoylation-dependent neurodevelopmental deficits in a mouse model of 22q11 microdeletion. Nat Neurosci 2008; 11: 1302–1310. - PMC - PubMed
    1. Hayashi-Takagi A, Takaki M, Graziane N, Seshadri S, Murdoch H, Dunlop AJ et al. Disrupted-in-Schizophrenia 1 (DISC1) regulates spines of the glutamate synapse via Rac1. Nat Neurosci 2010; 13: 327–332. - PMC - PubMed
    1. Jimenez-Mateos EM, Engel T, Merino-Serrais P, McKiernan RC, Tanaka K, Mouri G et al. Silencing microRNA-134 produces neuroprotective and prolonged seizure-suppressive effects. Nat Med 2012; 18: 1087–1094. - PMC - PubMed
    1. Wei W, Nguyen LN, Kessels HW, Hagiwara H, Sisodia S, Malinow R. Amyloid beta from axons and dendrites reduces local spine number and plasticity. Nat Neurosci 2010; 13: 190–196. - PMC - PubMed

MeSH terms