. 2016 Nov;26(11):1565-1574.
doi: 10.1101/gr.209841.116. Epub 2016 Sep 19.

Direct chromosome-length haplotyping by single-cell sequencing

Affiliations

Direct chromosome-length haplotyping by single-cell sequencing

David Porubský et al. Genome Res. 2016 Nov.

Abstract

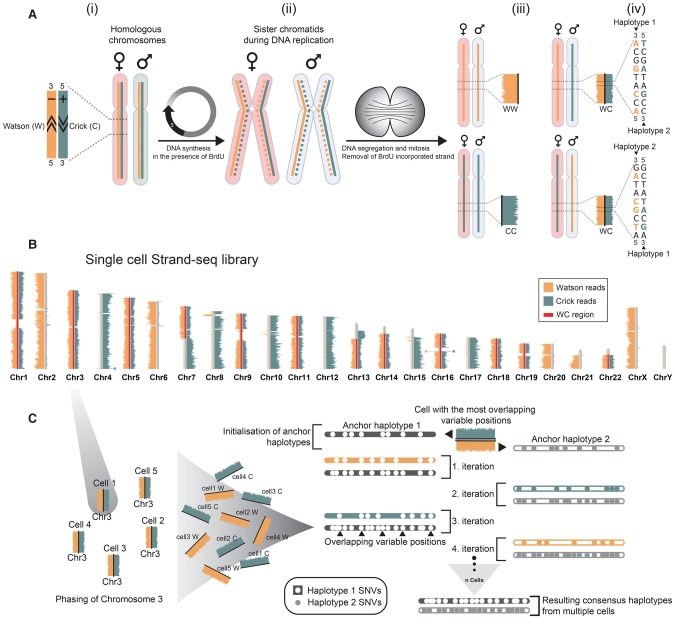
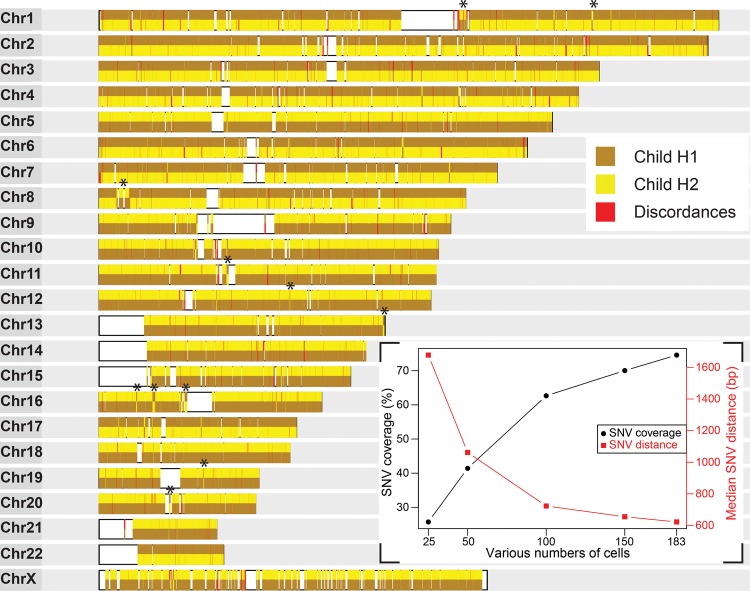
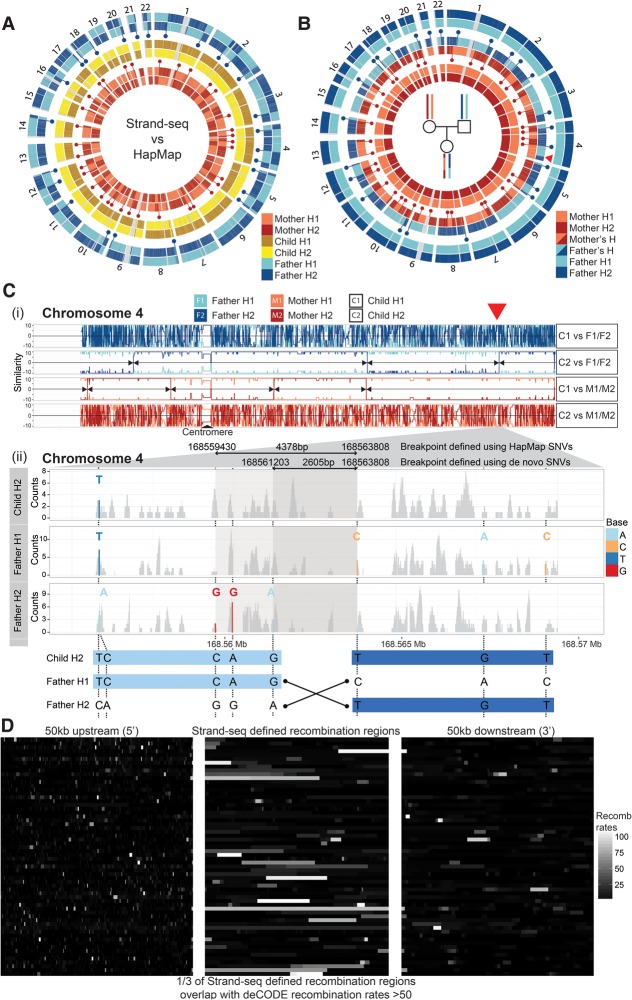
Haplotypes are fundamental to fully characterize the diploid genome of an individual, yet methods to directly chart the unique genetic makeup of each parental chromosome are lacking. Here we introduce single-cell DNA template strand sequencing (Strand-seq) as a novel approach to phasing diploid genomes along the entire length of all chromosomes. We demonstrate this by building a complete haplotype for a HapMap individual (NA12878) at high accuracy (concordance 99.3%), without using generational information or statistical inference. By use of this approach, we mapped all meiotic recombination events in a family trio with high resolution (median range ∼14 kb) and phased larger structural variants like deletions, indels, and balanced rearrangements like inversions. Lastly, the single-cell resolution of Strand-seq allowed us to observe loss of heterozygosity regions in a small number of cells, a significant advantage for studies of heterogeneous cell populations, such as cancer cells. We conclude that Strand-seq is a unique and powerful approach to completely phase individual genomes and map inheritance patterns in families, while preserving haplotype differences between single cells.


Figures

Figure 1.
Figure 1.
Direct whole-chromosome haplotyping using single-cell template strand sequencing (Strand-seq). (A,i) Two homologous chromosomes, one originating from the mother (light red) and one from the father (light blue), are shown. Each homolog is composed of a positive template strand (Crick; teal) and a negative template strand (Watson; orange). (ii) Cells incorporate BrdU during DNA replication, generating hemi-substituted sister chromatids containing one BrdU-negative template strand (solid line) and one BrdU-positive newly synthesized strand (dashed line). (iii) Segregation of sister chromatids in two daughter cells follows the depicted combinations of maternal and paternal template strands. The newly formed DNA strands containing BrdU are selectively removed in daughter cells during library preparation, such that only the original template DNA strands are sequenced. Read density along a chromosome is plotted as horizontal bars. (iv) When daughter cells inherit one Crick and one Watson template strand for a particular chromosome, we can use strand directionality to directly assign all reads to separate haplotypes. (B) Example of a single-cell Strand-seq library, generated from HapMap cell line NA12878. Each chromosome is represented as a vertical ideogram, and the distribution of directional sequencing reads is represented as horizontal lines along each chromosome, with Watson in orange and Crick in teal. WC regions that were selected for haplotype phasing are highlighted by red bars. (C) The custom phasing algorithm StrandPhase processes one chromosome at a time. Cells that inherit one Crick and one Watson template strand for a particular chromosome are selected as input, and the SNVs identified on each template strand are used to derive each single-cell haplotype. In the first iteration, anchor haplotypes are established by pairing single-cell haplotypes exhibiting the highest number of overlapping heterozygous SNVs. This is used to initialize the consensus haplotypes “H1” and “H2,” which are further built upon in subsequent iterations. In the second iteration, the second most-dense single-cell haplotype is considered and compared to both consensus haplotypes, and any new SNVs are added to the consensus haplotype showing the best concordance. With each iteration, the consensus haplotypes are extended until no additional single-cell haplotype can be reliably assigned to the one of the consensus haplotypes.
Figure 2.
Figure 2.
Accurate and dense whole-genome haplotypes are built from multiple single-cell Strand-seq libraries. Assembled haplotypes of the child derived from 183 Strand-seq libraries. Chromosome ideograms illustrate 151,700 high-confidence (covered in more than one cell) heterozygous SNV positions phased from Strand-seq data and compared with the HapMap reference. The consensus haplotypes determined by Strand-seq are depicted for each chromosome, with each SNV represented by a vertical line and color-coded based on whether it matched the child's reference homolog 1 (brown) or homolog 2 (yellow) listed in the HapMap reference. The contiguous haplotypes extend the whole length of each chromosome, spanning centromeres and reference assembly gaps (white blocks). Discordant alleles that did not match either reference haplotype are shown in red. (Asterisks) Short localized switches in haplotypes that were confirmed as homozygous inversions. (Inset) The percentage of HapMap reference SNVs covered (black line) and the median distance between these SNVs (red line) are plotted for various numbers of single-cell libraries (25, 50, 100, 150), randomly sampled from the entire data set of 183 cells.
Figure 3.
Figure 3.
Genome-wide mapping of meiotic recombination breakpoints in a family trio. (A) Circular plots of Strand-seq haplotypes (H1 and H2) assembled for a family trio (mother, child, and father) with each pair of homologs compared with the corresponding HapMap reference haplotypes. Only heterozygous SNV positions are plotted along each chromosome. Strand-seq haplotypes for the child (middle circles; yellow and brown) match the HapMap reference along the whole length of the chromosome (see also Fig. 2). Haplotypes from the mother (inner circles; light red and dark red) and father (outer circles; light blue and dark blue) show multiple switches (blue and red dots) between the Strand-seq haplotypes and those listed in the HapMap reference. (B) Comparison of the Strand-seq child's haplotypes to the Strand-seq parental haplotypes, with only the heterozygous SNV positions plotted for each homolog. We compared each of the child's haplotypes independently to both the parental haplotypes. Haplotype switches (blue and red dots) represent sites of meiotic recombination and occur at almost every chromosome, both from the maternal and paternal germline. (Red arrowhead) The switch event illustrated in C. (C,i) Similarity plot for Chromosome 4 depicting pairwise comparison of each child homolog (C1 and C2) with both parental homologs (F1 and F2, or M1 and M2, as indicated) (see Methods, “Mapping meiotic recombination breakpoints”). Lines depict continuous stretches of high (+10) and low (−10) similarity. A high similarity score (e.g., 10) indicated all SNVs were matched between the pairs, whereas a low similarity score (e.g., −10) indicated the homologs were dissimilar. This illustrates that, for this chromosome, C1 was inherited from the father and C2 was inherited from the mother. (Black arrowheads) Locations where the degree of similarity switched between the inherited parental homologs (e.g., from F1 to F2, red arrowhead) and mark locations of meiotic recombination. (ii) Enlarged region of Chromosome 4 showing the homolog-specific BAM files generated for child's homolog (C2) inherited from the father, as well as the corresponding paternal homologs (F1 and F2). Read coverage (gray) was plotted for each BAM file, with heterozygous SNVs highlighted (see legend). By use of these SNVs, the meiotic recombination breakpoint was narrowed to a 2605-bp region (bottom panel). (D) A comparison of the overlap of the meiotic recombination breakpoints predicted in this study to the hotspots reported in the deCODE project. The middle panel illustrates the genomic regions where a meiotic recombination breakpoint was found in our analysis, with each row depicting a distinct recombination event and the shade denoting overlap with the predicted deCODE recombination rates corresponding to these locations (white indicates high levels of recombination; black, low levels of recombination). The left and right panels show 50 kb upstream of and 50 kb downstream from the defined meiotic recombination breakpoint, respectively, again with the shade representing the overlap with deCODE recombination rates. We saw high concordance between our predicted breakpoints and those listed in the deCODE database, where one in three overlapped with deCODE regions predicted to have high (more than 50 standardized units) (Kong et al. 2010) meiotic recombination rates.

References

    1. Amini S, Pushkarev D, Christiansen L, Kostem E, Royce T, Turk C, Pignatelli N, Adey A, Kitzman JO, Vijayan K, et al. 2014. Haplotype-resolved whole-genome sequencing by contiguity-preserving transposition and combinatorial indexing. Nat Genet 46: 1343–1349. - PMC - PubMed
    1. Bansal V, Tewhey R, Topol EJ, Schork NJ. 2011. The next phase in human genetics. Nat Biotechnol 29: 38–39. - PubMed
    1. Broman KW, Murray JC, Sheffield VC, White RL, Weber JL. 1998. Comprehensive human genetic maps: individual and sex-specific variation in recombination. Am J Hum Genet 63: 861–869. - PMC - PubMed
    1. Brown PJB, De Pedro MA, Kysela T, Van Der Henst C, Kim J, De Bolle X, Fuqua C, Brun YV. 2012. Completely phased genome sequencing through chromosome sorting. Proc Natl Acad Sci 109: 3190–3190.
    1. Browning SR, Browning BL. 2011. Haplotype phasing: existing methods and new developments. Nat Rev Genet 12: 703–714. - PMC - PubMed

Publication types