

Genomic Prediction of Single Crosses in the Early Stages of a Maize Hybrid Breeding Pipeline
- PMID: 27646704
- PMCID: PMC5100843
- DOI: 10.1534/g3.116.031286
Genomic Prediction of Single Crosses in the Early Stages of a Maize Hybrid Breeding Pipeline
Erratum in
-
Corrigendum.G3 (Bethesda). 2017 Oct 5;7(10):3557-3558. doi: 10.1534/g3.117.300143. G3 (Bethesda). 2017. PMID: 28983070 Free PMC article. No abstract available.
Abstract
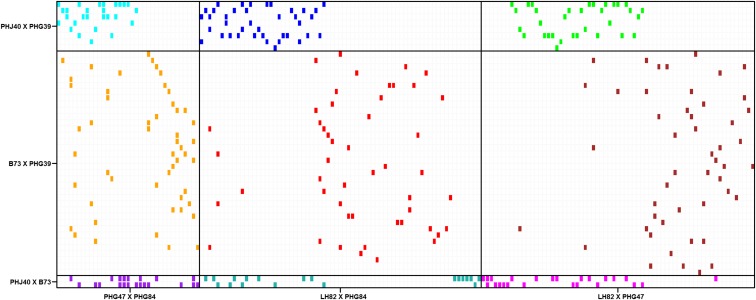
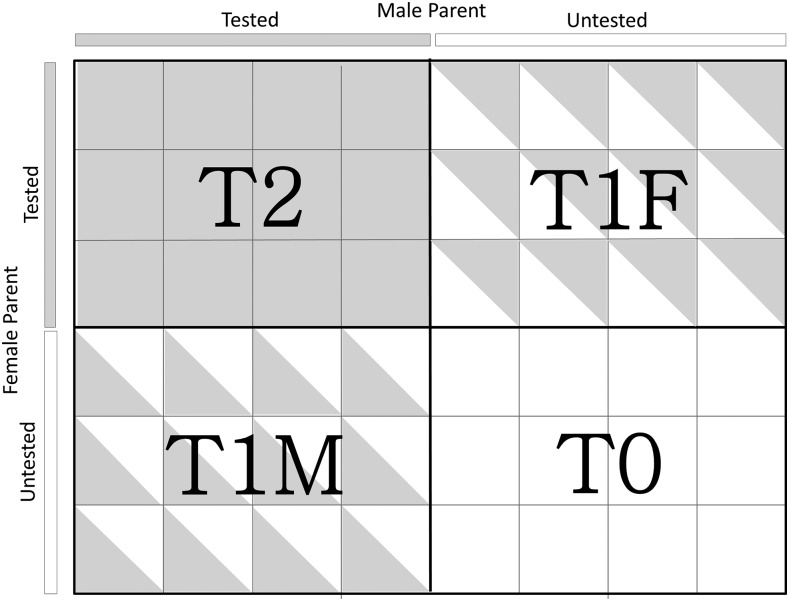
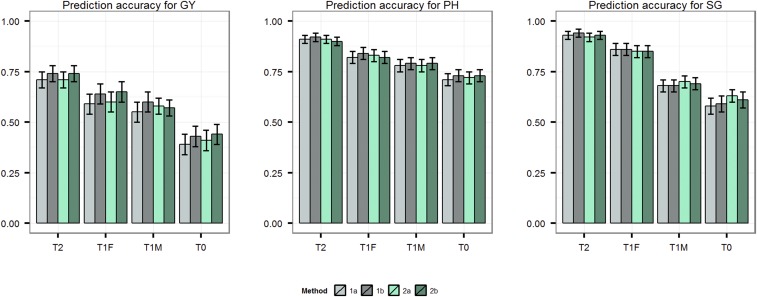
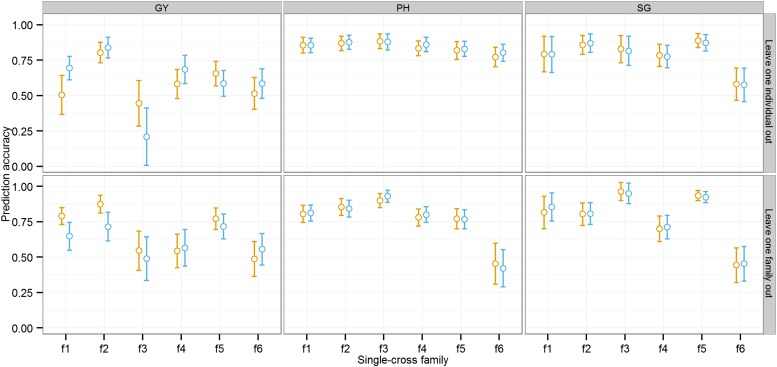
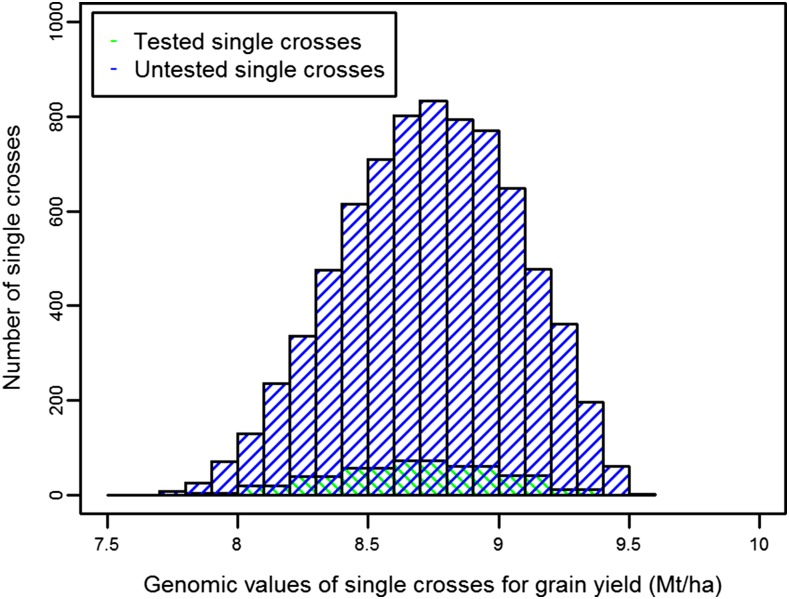
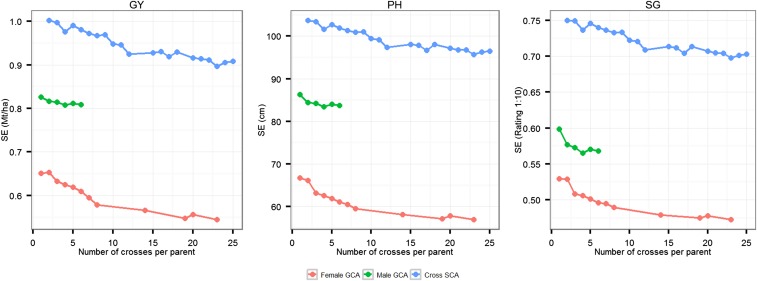
Prediction of single-cross performance has been a major goal of plant breeders since the beginning of hybrid breeding. Recently, genomic prediction has shown to be a promising approach, but only limited studies have examined the accuracy of predicting single-cross performance. Moreover, no studies have examined the potential of predicting single crosses among random inbreds derived from a series of biparental families, which resembles the structure of germplasm comprising the initial stages of a hybrid maize breeding pipeline. The main objectives of this study were to evaluate the potential of genomic prediction for identifying superior single crosses early in the hybrid breeding pipeline and optimize its application. To accomplish these objectives, we designed and analyzed a novel population of single crosses representing the Iowa Stiff Stalk synthetic/non-Stiff Stalk heterotic pattern commonly used in the development of North American commercial maize hybrids. The performance of single crosses was predicted using parental combining ability and covariance among single crosses. Prediction accuracies were estimated using cross-validation and ranged from 0.28 to 0.77 for grain yield, 0.53 to 0.91 for plant height, and 0.49 to 0.94 for staygreen, depending on the number of tested parents of the single cross and genomic prediction method used. The genomic estimated general and specific combining abilities showed an advantage over genomic covariances among single crosses when one or both parents of the single cross were untested. Overall, our results suggest that genomic prediction of single crosses in the early stages of a hybrid breeding pipeline holds great potential to redesign hybrid breeding and increase its efficiency.
Keywords: GenPred; Genomic Selection; Shared Data Resources; general combining ability; genomic prediction; genotyping by sequencing; hybrid breeding; specific combining ability.
Copyright © 2016 Kadam et al.
Figures
References
-
- Albrecht T., Wimmer V., Auinger H., Erbe M., Knaak C., et al. , 2011. Genome-based prediction of testcross values in maize. Theor. Appl. Genet. 123: 339–350. - PubMed
-
- Albrecht T., Auinger H. J., Wimmer V., Ogutu J. O., Knaak C., et al. , 2014. Genome-based prediction of maize hybrid performance across genetic groups, testers, locations, and years. Theor. Appl. Genet. 127: 1375–1386. - PubMed
-
- Bernardo R., 1992. Relationship between single-cross performance and molecular marker heterozygosity. Theor. Appl. Genet. 83: 628–634. - PubMed
-
- Bernardo R., 1994. Prediction of maize single-cross performance using RFLPs and information from related hybrids. Crop Sci. 34: 20–25.
-
- Bernardo R., 1996a Best linear unbiased prediction of maize single-cross performance. Crop Sci. 36: 50–56. - PubMed
LinkOut - more resources
Full Text Sources
Other Literature Sources