

Enrollment Trends and Disparity Among Patients With Lung Cancer in National Clinical Trials, 1990 to 2012
- PMID: 27646951
- PMCID: PMC5477832
- DOI: 10.1200/JCO.2016.67.7088
Enrollment Trends and Disparity Among Patients With Lung Cancer in National Clinical Trials, 1990 to 2012
Abstract
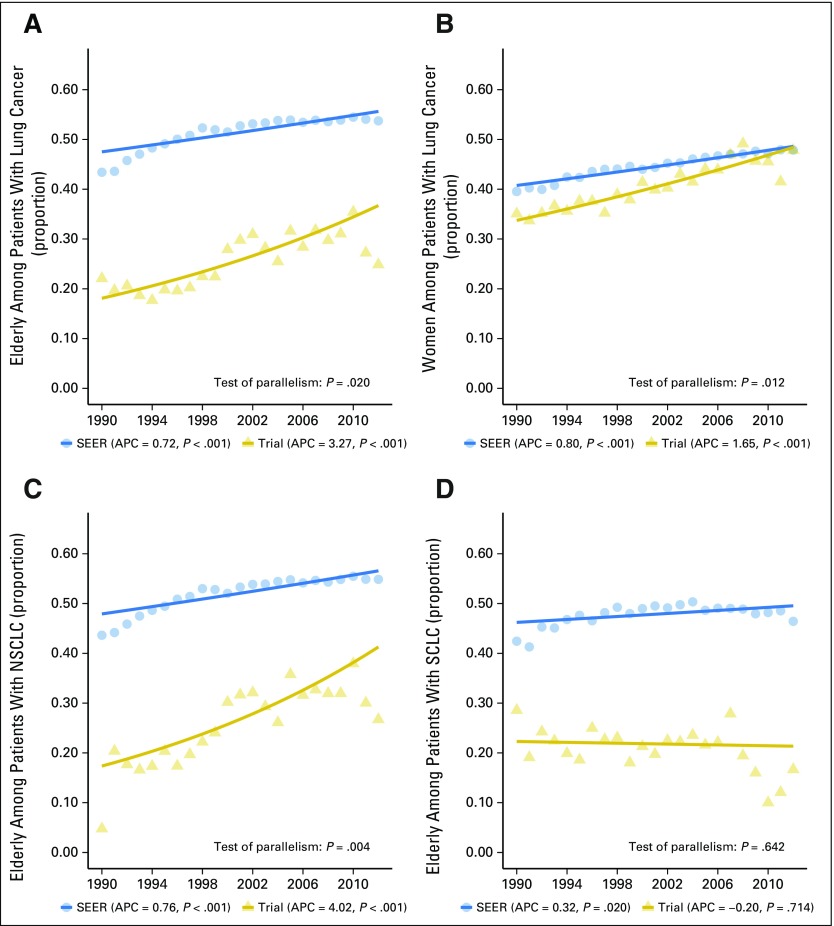
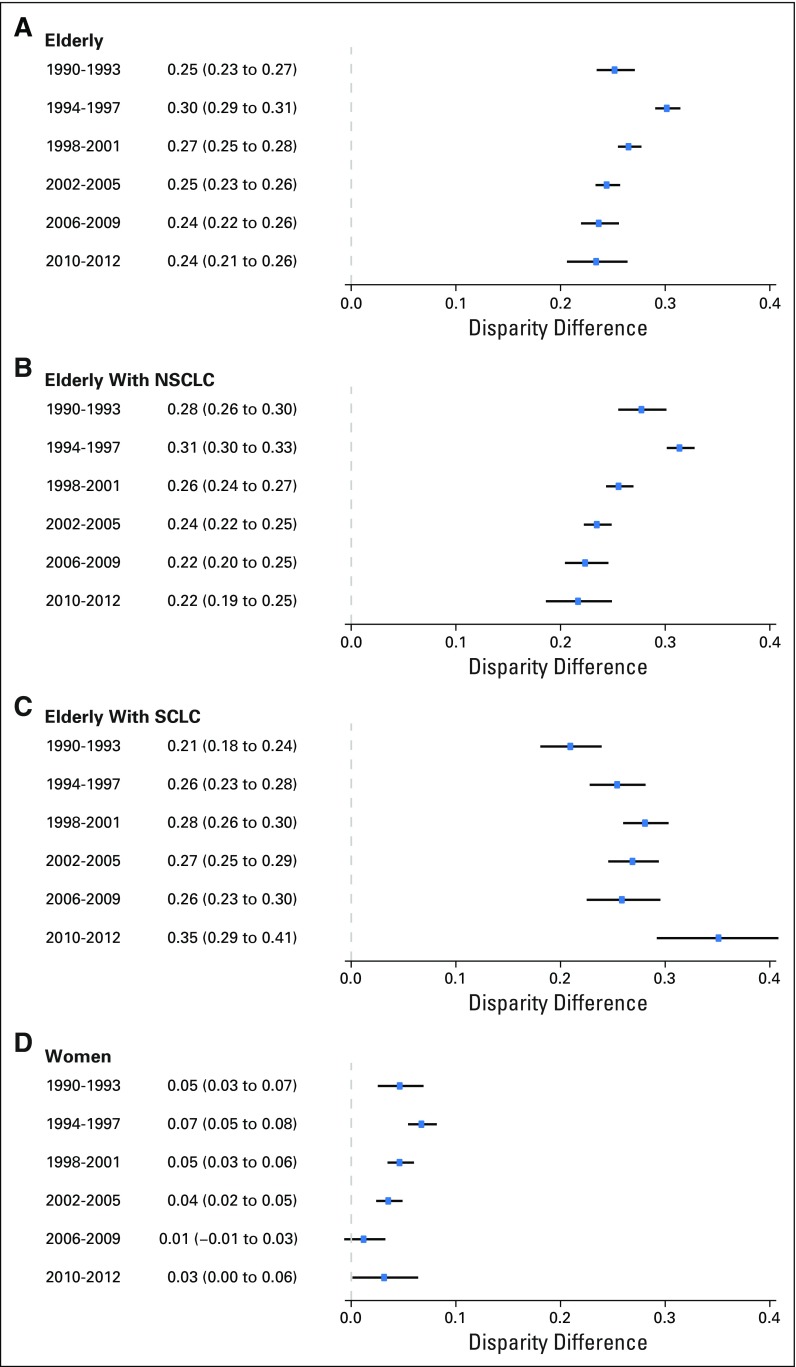
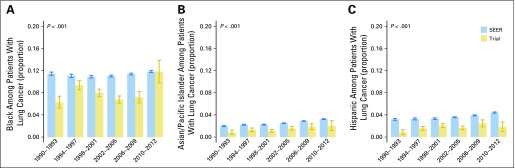
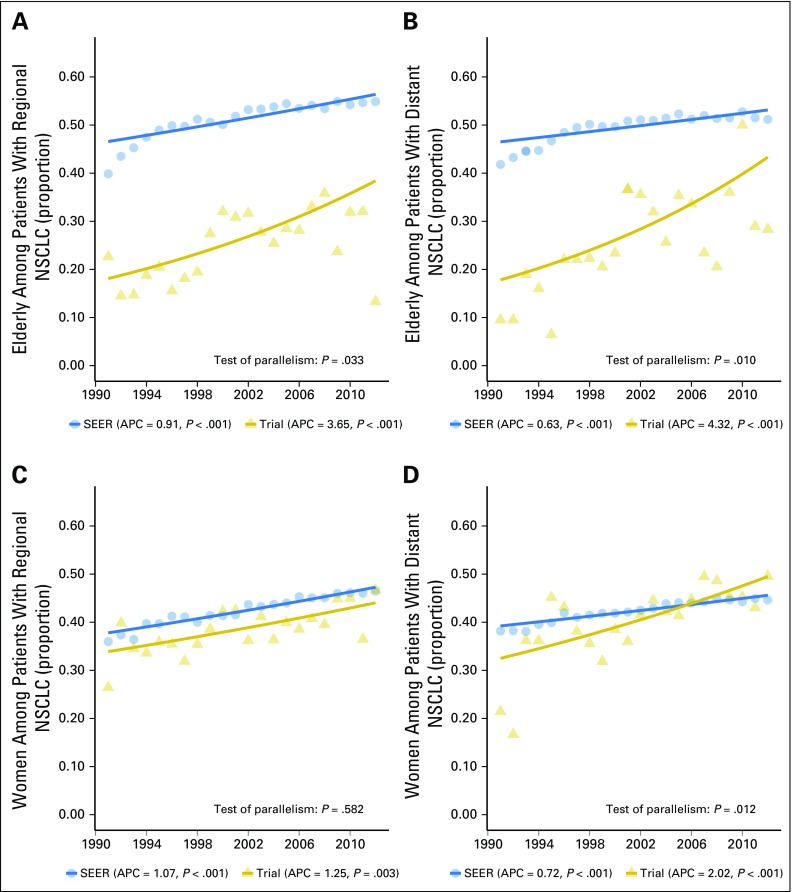
Purpose Under-representation of elderly, women, and racial/ethnic minority patients with cancer in clinical trials is of national concern. The goal of this study was to characterize enrollment trends and disparities by age, sex, and race/ethnicity in lung cancer trials. Methods We analyzed data for 23,006 National Cancer Institute cooperative group lung cancer trial participants and 578,476 patients with lung cancer from the SEER registry from 1990 to 2012. The enrollment disparity difference (EDD) and enrollment disparity ratio (EDR) were calculated on the basis of the proportion of each subgroup in the trial population and the US lung cancer population. Annual percentage changes (APCs) in the subgroup proportions in each population were compared over time. Results Enrollment disparity for patients ≥ 70 years of age with non-small-cell lung cancer improved from 1990 to 2012 (test of parallelism, P = .020), with a remaining EDD of 0.22 (95% CI, 0.19 to 0.25) and EDR of 1.65 (95% CI, 1.51 to 1.82) in 2010 to 2012. No improvement was seen for elderly patients with small-cell lung cancer (SCLC), with an APC of 0.20 ( P = .714) among trial participants, despite a rising proportion of elderly patients with SCLC in the US population (APC, 0.32; P = .020). Enrollment disparity for women with lung cancer improved overall, with the gap closing by 2012 (EDD, 0.03 [95% CI, 0.00 to 0.06]; EDR, 1.07 [95% CI, 1.00 to 1.16]). Enrollment disparities persisted without significant improvement for elderly women, blacks, Asians/Pacific Islanders, and Hispanics. Conclusion Under-representation in lung cancer trials improved significantly from 1990 to 2012 for elderly patients with non-small-cell lung cancer and for women, but ongoing efforts to improve the enrollment of elderly patients with SCLC and minorities are needed. Our study highlights the importance of addressing enrollment disparities by demographic and disease subgroups to better target under-represented groups of patients with lung cancer.
Conflict of interest statement
Authors’ disclosures of potential conflicts of interest are found in the article online at
Figures
Comment in
-
Next steps to improve disparities in lung cancer treatment clinical trial enrollment.Ann Transl Med. 2017 Mar;5(5):118. doi: 10.21037/atm.2017.01.25. Ann Transl Med. 2017. PMID: 28361083 Free PMC article. No abstract available.
References
-
- National Cancer Institute: SEER cancer statistics review, 1975-2012. http://seer.cancer.gov/csr/1975_2012/
-
- National Cancer Institute: SEER stat fact sheets: Lung and bronchus cancer. http://seer.cancer.gov/statfacts/html/lungb.html.
-
- Hurria A, Naylor M, Cohen HJ. Improving the quality of cancer care in an aging population: Recommendations from an IOM report. JAMA. 2013;310:1795–1796. - PubMed
-
- Torre LA, Bray F, Siegel RL, et al. Global cancer statistics, 2012. CA Cancer J Clin. 2015;65:87–108. - PubMed
Publication types
MeSH terms
Grants and funding
LinkOut - more resources
Full Text Sources
Other Literature Sources
Medical
Miscellaneous
