. 2016 Oct 17;213(11):2349-2364.
doi: 10.1084/jem.20160185. Epub 2016 Sep 19.

Dpy30 is critical for maintaining the identity and function of adult hematopoietic stem cells

Affiliations

Dpy30 is critical for maintaining the identity and function of adult hematopoietic stem cells

Zhenhua Yang et al. J Exp Med. .

Abstract

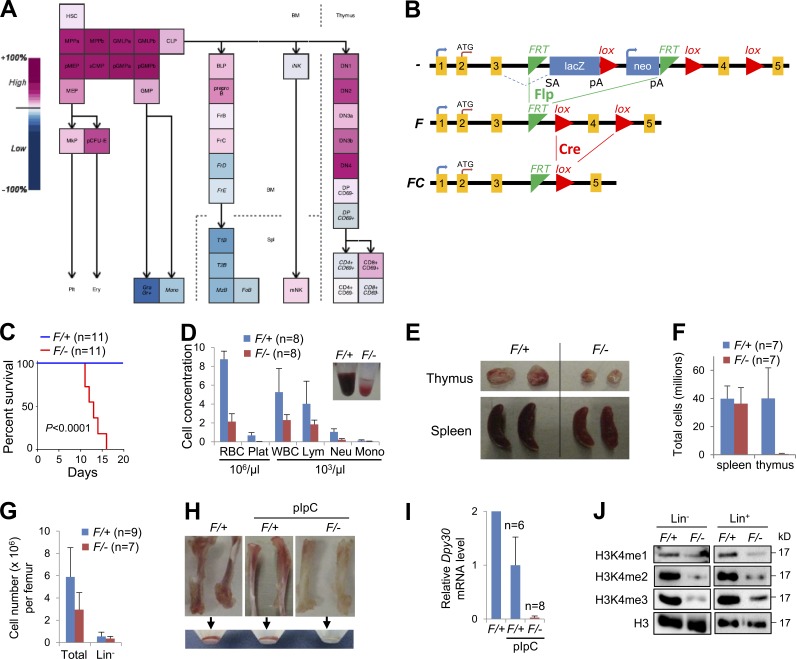
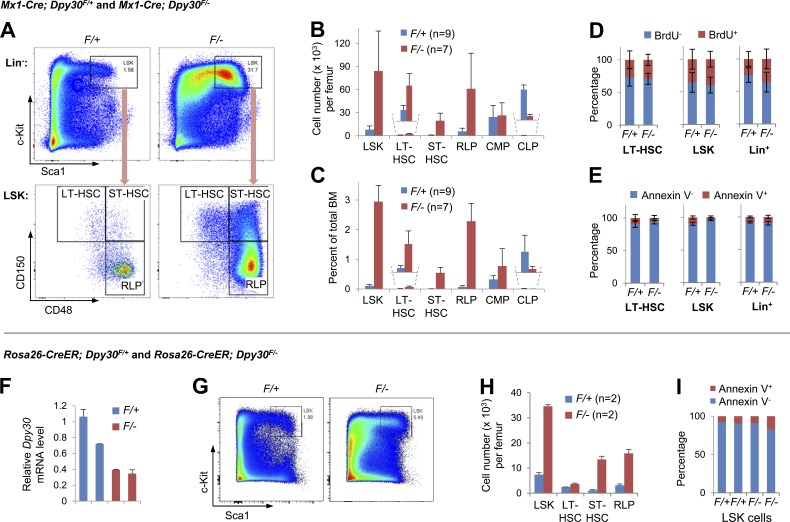
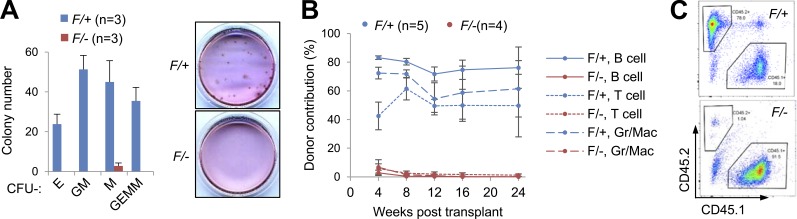
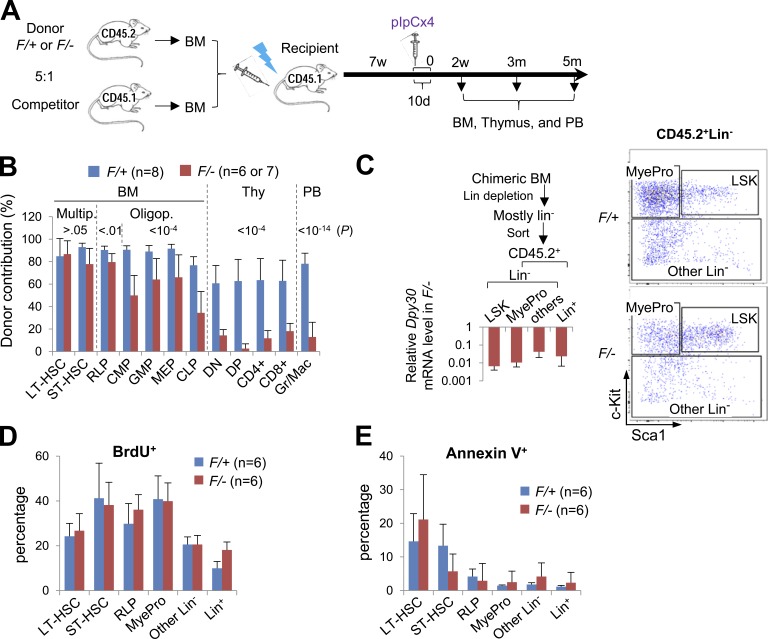
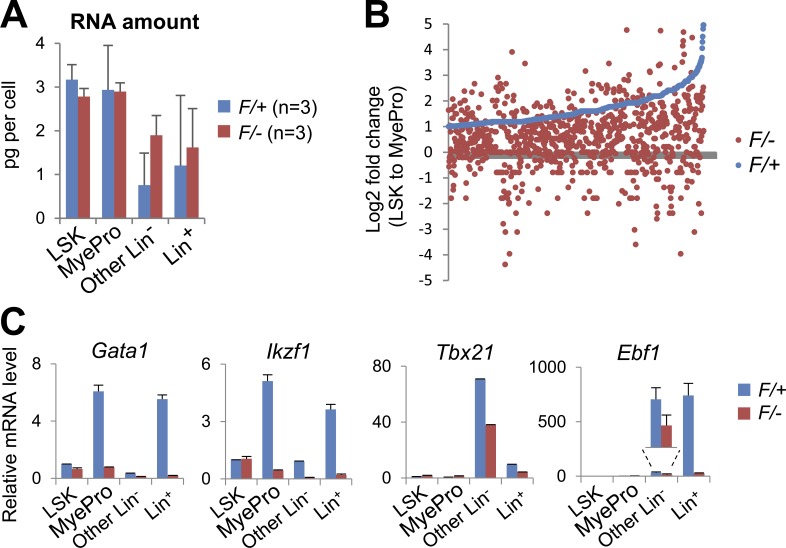
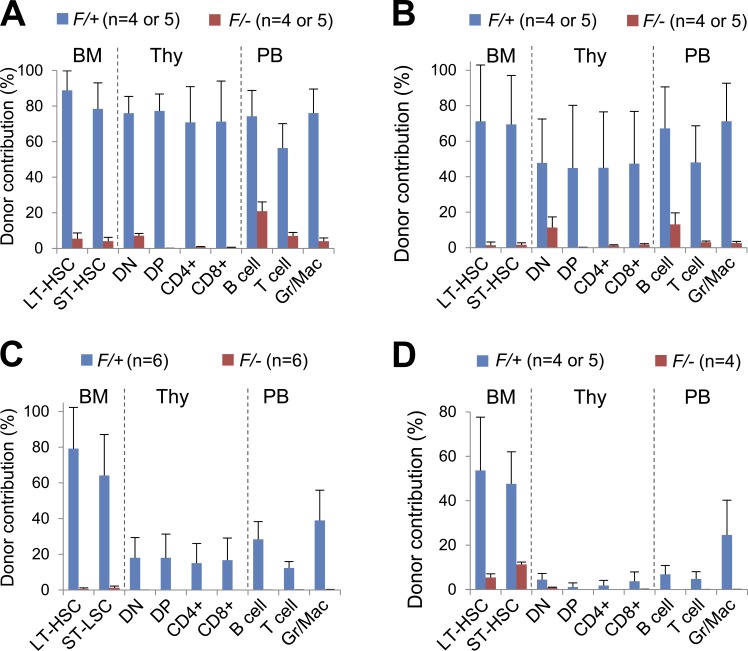
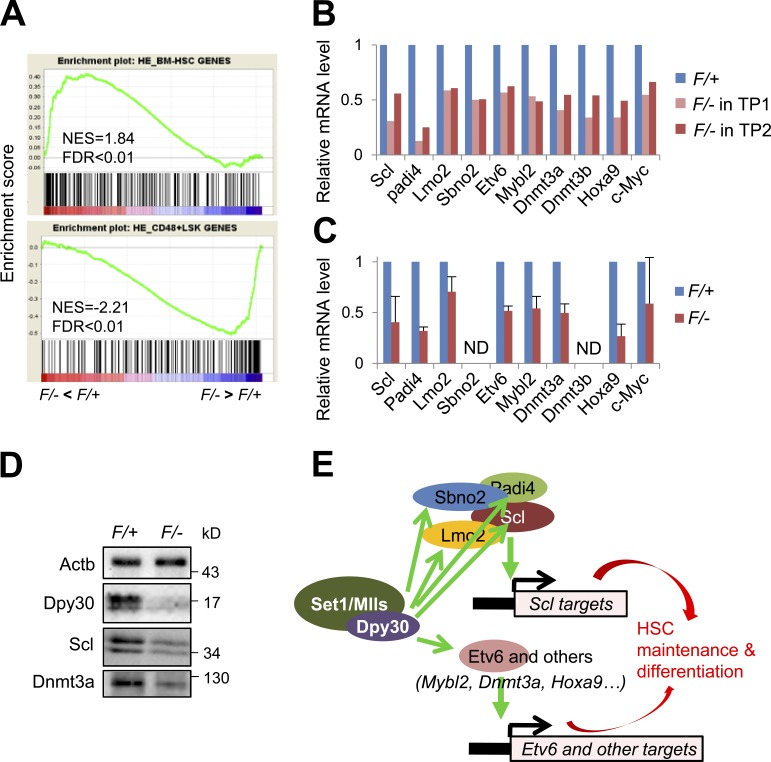
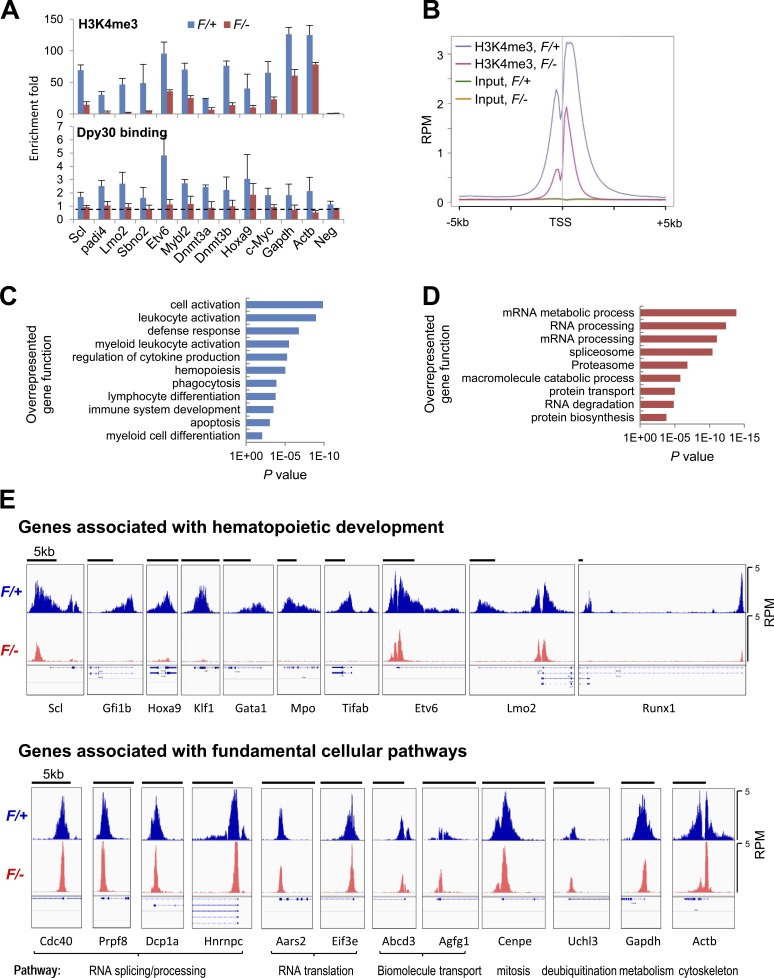
As the major histone H3K4 methyltransferases in mammals, the Set1/Mll complexes play important roles in animal development and are associated with many diseases, including hematological malignancies. However, the role of the H3K4 methylation activity of these complexes in fate determination of hematopoietic stem and progenitor cells (HSCs and HPCs) remains elusive. Here, we address this question by generating a conditional knockout mouse for Dpy30, which is a common core subunit of all Set1/Mll complexes and facilitates genome-wide H3K4 methylation in cells. Dpy30 loss in the adult hematopoietic system results in severe pancytopenia but striking accumulation of HSCs and early HPCs that are defective in multilineage reconstitution, suggesting a differentiation block. In mixed bone marrow chimeras, Dpy30-deficient HSCs cannot differentiate or efficiently up-regulate lineage-regulatory genes, and eventually fail to sustain for long term with significant loss of HSC signature gene expression. Our molecular analyses reveal that Dpy30 directly and preferentially controls H3K4 methylation and expression of many hematopoietic development-associated genes including several key transcriptional and chromatin regulators involved in HSC function. Collectively, our results establish a critical and selective role of Dpy30 and the H3K4 methylation activity of the Set1/Mll complexes for maintaining the identity and function of adult HSCs.


Figures

Figure 1.
Figure 1.
Dpy30 KO in the hematopoietic system results in depletion of H3K4 methylation and pancytopenia. (A) Dpy30 expression levels in the mouse hematopoietic system, shown as output from Gene Expression Commons. (B) The Dpy30 KO strategy, showing different status of the Dpy30 allele. Dpy30 protein has 99 aa in total, and the domain responsible for facilitating methylation is at the C-terminal half, which is encoded starting within the targeted exon 4, and is thus deleted by Cre-mediated recombination. (C–J) pIpC was injected into Mx1-Cre; Dpy30F/+ (F/+, control) and Mx1-Cre; Dpy30F/− (F/−, KO) mice for 4 times, except in H and I where no pIpC is labeled. All mice were examined 4 d after last pIpC injection. (C) Kaplan-Meier curves for survival of animals after pIpC injections (first pIpC injection on day 0). n = 11 mice for each genotype. P < 0.0001 by log-rank test. (D) Profiles of PB. Insert shows comparison of typical PB samples. n = 8 mice for each genotype. (E) Thymus and spleen in the control and KO mice. (F) Numbers of total splenocytes and thymocytes in the control and KO mice. n = 7 mice for each genotype. (G) Total and Lin BM cell numbers. n = 9 mice for F/+; n = 7 mice for F/−. (H) Representative long bones and cells flushed from these bones. (I) Relative Dpy30 mRNA levels in BM by RT-qPCR and normalized to Actb. n = 6 mice for F/+; n = 8 mice for F/−; both with pIpC injection. (J) Western blotting for total H3 and different levels of H3K4 methylation in sorted Lin and Lin+ BM. Data are shown as mean ± SD for D, F, G, and I.
Figure 2.
Figure 2.
Dpy30 KO results in accumulation of early HSPCs. (A–E) Analyses of BM from Mx1-Cre; Dpy30F/+ and Mx1-Cre; Dpy30F/− mice 4 d after the last pIpC injection. (A) Representative FACS analysis of BM cells. (B and C) Absolute numbers of BM cell populations (B) and percentages in total BM cells (C). n = 9 mice for F/+; n = 7 mice for F/-, except for n = 4 for CMP and CLP of each genotype. P < 0.001 for LSK, LT-HSCs, ST-HSCs, and CLP; P < 0.01 for RLP, by Student’s t test. (D) BrdU incorporation assay for BM. n = 10 mice for each genotype. P > 0.05 for all cell types by Student’s t test. (E) Annexin V staining for BM. n = 7 mice for F/+; n = 9 mice for F/−. P > 0.05, except for LSK cells by Student’s t test. (F–I) Analyses of BM from Rosa26-CreER; Dpy30F/+ and Rosa26-CreER; Dpy30F/− mice 4 d after the last tamoxifen injection in a series of seven injections. (F) Relative Dpy30 mRNA levels in BM of individual mice (each by a bar) was determined by RT-qPCR of duplicate measurements and normalized to Actb. (G) Representative FACS analysis of Lin BM. (H) Absolute numbers of indicated BM cell populations. n = 2 mice per group. P < 0.05 for all by Student’s t test. (I) Annexin V staining for BM LSK cells. Note that the F/− LSK cells still accumulate in H, despite the mild increase of Annexin V+ percentage in these cells. Data are shown as mean ± SD for B–F and H.
Figure 3.
Figure 3.
Dpy30 KO HSPCs are functionally defective. (A) Colony formation assay using 105 BM cells from Mx1-Cre; Dpy30F/+ and Mx1-Cre; Dpy30F/− mice 4 d after the last pIpC injection. n = 3 mice for each genotype. A representative image of the plates with formed colonies is shown on the right. (B) CAG-CreER; Dpy30F/+ and CAG-CreER; Dpy30F/− mice were injected with tamoxifen seven times and whole BMs were used in competitive transplantation (donor: competitor = 10:1), and donor contribution to indicated PB cells was determined at different times after transplantation. n = 5 mice for F/+; n = 4 mice for F/−. P < 0.001 for all by Student’s t test. (C) A representative FACS analysis of PB B cells 8 wk after transplantation shown in B. Data are shown as mean ± SD for A and B.
Figure 4.
Figure 4.
Short-term BM chimera system further reveals differentiation defects of Dpy30 KO HSPCs. (A) Scheme for the mixed BM chimera system using whole BM from Mx1-Cre; Dpy30F/+ or Mx1-Cre; Dpy30F/− mice as donors and from CD45.1+ mice as competitors (donor: competitor = 5:1). This scheme is for all panels in Figs. 4, 5, 6,and 7, except for Fig. 6 (C and D) and Fig. 7 D. (B–E) Analyses of donor-derived cells 2 wk after pIpC injections. (B) Donor contribution to different cell populations in BM chimeras. n = 8 (recipient) mice for F/+; n = 6 or 7 mice for F/-. P > 0.05 for multipotent cells; P < 0.01 for RLP; P < 10−4 for CMP, GMP, MEP, and thymocytes; P < 10−14 for PB, by Student’s t test. (C) Different populations of donor-derived cells were isolated following the scheme on the left. Dpy30 mRNA levels in sorted F/− relative to F/+ cells (set as 1) of the same cell types were determined by RT-qPCR and normalized to Actb. n = 5 mice for each genotype. Shown on the right is a representative FACS sorting of CD45.2+Lin cells. (D) BrdU incorporation assay for different (donor-derived) cell populations in chimera BM. n = 6 mice for each genotype. P > 0.2 for all cell types except Lin+ (P = 0.002) by Student’s t test. (E) Annexin V staining for different (donor-derived) cell populations in chimera BM. n = 6 mice for each genotype. P > 0.1 for all cell types except ST-HSC (P = 0.05) by Student’s t test. Data are shown as mean ± SD for B–E.
Figure 5.
Figure 5.
Impaired induction of lineage-regulatory genes after loss of Dpy30. (A–C) Gene expression analyses were performed for Mx1-Cre; Dpy30F/+ or Mx1-Cre; Dpy30F/– donor-derived cells 2 wk after pIpC injections after the schemes in Fig. 4 (A and C). (A) RNA amount per cell in sorted cell populations. n = 3 mice for each genotype. P > 0.1 for all by Student’s t test. Data are shown as mean ± SD. (B) Expression change (shown as Log2 fold change) from LSK to MyePro cells in F/− (red) and in F/+ (blue) backgrounds, as determined by RNA-seq of sorted cells. Genes (represented by each dot) were ranked according to their fold changes in F/+ cells, and only genes with fold change >2 (Log2 fold change >1) in F/+ cells are shown. Note that most of these genes show a smaller fold change in F/− than in F/+ cells. See Table S2 for the gene lists. (C) Expression levels of indicated genes in the sorted cell populations were determined by RT-qPCR and normalized to Actb, and shown as mean ± SD of duplicate measurements. The expression levels in F/+ LSK cells were set as 1. Shown are representative results from one out of three independent chimera transplantation experiments. Results from two more independent transplantation experiments (not depicted) are consistent with these results.
Figure 6.
Figure 6.
Dpy30 KO results in loss of long-term maintenance of HSCs. (A and B) Donor contribution in BM chimeras 3 (A) and 5 (B) mo after pIpC injections following the scheme in Fig. 4 A. n = 10 mice of each genotype for PB; n = 4 or 5 mice of each genotype for BM and thymus. P < 0.001 for all cell populations by Student’s t test. (C) Donor contribution in recipients 3 mo after transplantation of LT-HSCs purified from pIpC-injected Mx1-Cre; Dpy30F/+ or Mx1-Cre; Dpy30F/– mice. n = 6 mice for each genotype. P < 0.01 for all cell populations by Student’s t test. (D) Donor contribution 3 mo after secondary transplantation, in which donor-derived HSCs sorted from pIpC-injected BM chimeras (primary recipients) were competitively transplanted into secondary recipient mice. n = 4 or 5 mice for each genotype. P < 0.05 for all cell populations by Student’s t test, except for CD4+ and CD8+ thymocytes, for which the levels in control genotype were already extremely low and highly variable, preventing a manifestation of a statistically significant reduction in the KO background. Data are shown as mean ± SD for all panels.
Figure 7.
Figure 7.
Dpy30 KO results in loss of HSC identity and down-regulation of key genes for HSC maintenance and function. (A–C) Gene expression analyses of donor-derived LT-HSCs in BM chimeras 2 wk after pIpC injections following the schemes in Fig. 4 A and Fig. S1. (A) GSEA for genes affected in the Dpy30 KO (F/–) HSCs in the BM chimeras, after RNA-seq analyses. The top panel shows an enrichment of LT-HSC (LSK CD48CD150+) gene set in genes down-regulated, whereas the bottom panel shows an enrichment of RLP and ST-HSC (LSK CD48+) gene set in genes up-regulated, in Dpy30 KO HSCs. Both gene sets are from (He et al., 2011). (B) Relative expression of key HSC-regulatory genes in the control (F/+) versus Dpy30 KO (F/–) HSCs in the BM chimeras, as analyzed by RNA-seq in two independent BM transplantations (TP1 and TP2). (C) Relative expression of the same genes as in B, as analyzed by RT-qPCR and normalized to Actb using HSCs from three independent BM transplantations and shown as mean ± SD. ND, not done due to insufficient RNAs. P < 0.05 for all genes by Student’s t test, except for c-Myc. (D) Western blotting for indicated proteins in whole BMs from pIpC-injected Mx1-Cre; Dpy30F/+ and Mx1-Cre; Dpy30F/– mice. (E) A model illustrating HSC regulation by Dpy30 via multiple genes and pathways.
Figure 8.
Figure 8.
Differential effect of Dpy30 KO on genomic H3K4me3. (A) ChIP for H3K4me3 (top) and Dpy30 (bottom) using Lin BM cells from Mx1-Cre; Dpy30F/+ and Mx1-Cre; Dpy30F/− mice 4 d after the last pIpC injection, and shown as mean ± SD from three independent injection experiments. The dotted line in the bottom panel represents the approximate level of nonspecific ChIP signal that needs to be subtracted when assessing the Dpy30-specific binding level, given the thorough depletion of Dpy30 in the KO cells. (B) The composite profiles of indicated ChIP-seq results for all genes that has an H3K4me3 peak within 5 kb up- or downstream of its TSS. (C and D) Gene ontology analysis by DAVID for genes with >90% reduction (C) or <50% reduction (D) of H3K4me3 at TSS regions in the F/– (KO) compared with the F/+ (control) cells (see Table S4 for the gene lists). (E) H3K4me3 ChIP-seq profiles shown in Integrated Genomic Viewer for the representative genes associated with hematopoietic development (top) and genes associated with various fundamental cellular pathways (bottom). The black bars on top of each panel show 5-kb scale. All panels have the same signal scale of 0–5 RPM on the y axis. The expanded RefSeq genes are shown below each panel to show the transcript isoforms, including those with alternative TSSs (and thus multiple H3K4me3 peaks).

References

    1. Anders S., and Huber W.. 2010. Differential expression analysis for sequence count data. Genome Biol. 11:R106 10.1186/gb-2010-11-10-r106 - DOI - PMC - PubMed
    1. Anders S., Pyl P.T., and Huber W.. 2015. HTSeq—a Python framework to work with high-throughput sequencing data. Bioinformatics. 31:166–169. 10.1093/bioinformatics/btu638 - DOI - PMC - PubMed
    1. Artinger E.L., Mishra B.P., Zaffuto K.M., Li B.E., Chung E.K., Moore A.W., Chen Y., Cheng C., and Ernst P.. 2013. An MLL-dependent network sustains hematopoiesis. Proc. Natl. Acad. Sci. USA. 110:12000–12005. 10.1073/pnas.1301278110 - DOI - PMC - PubMed
    1. Austenaa L., Barozzi I., Chronowska A., Termanini A., Ostuni R., Prosperini E., Stewart A.F., Testa G., and Natoli G.. 2012. The histone methyltransferase Wbp7 controls macrophage function through GPI glycolipid anchor synthesis. Immunity. 36:572–585. 10.1016/j.immuni.2012.02.016 - DOI - PubMed
    1. Baker S.J., Ma’ayan A., Lieu Y.K., John P., Reddy M.V., Chen E.Y., Duan Q., Snoeck H.W., and Reddy E.P.. 2014. B-myb is an essential regulator of hematopoietic stem cell and myeloid progenitor cell development. Proc. Natl. Acad. Sci. USA. 111:3122–3127. 10.1073/pnas.1315464111 - DOI - PMC - PubMed

MeSH terms