. 2016 Oct 17;213(11):2413-2435.
doi: 10.1084/jem.20160576. Epub 2016 Sep 19.

Dual T cell- and B cell-intrinsic deficiency in humans with biallelic RLTPR mutations

Affiliations

Dual T cell- and B cell-intrinsic deficiency in humans with biallelic RLTPR mutations

Yi Wang et al. J Exp Med. .

Abstract

Combined immunodeficiency (CID) refers to inborn errors of human T cells that also affect B cells because of the T cell deficit or an additional B cell-intrinsic deficit. In this study, we report six patients from three unrelated families with biallelic loss-of-function mutations in RLTPR, the mouse orthologue of which is essential for CD28 signaling. The patients have cutaneous and pulmonary allergy, as well as a variety of bacterial and fungal infectious diseases, including invasive tuberculosis and mucocutaneous candidiasis. Proportions of circulating regulatory T cells and memory CD4+ T cells are reduced. Their CD4+ T cells do not respond to CD28 stimulation. Their CD4+ T cells exhibit a "Th2" cell bias ex vivo and when cultured in vitro, contrasting with the paucity of "Th1," "Th17," and T follicular helper cells. The patients also display few memory B cells and poor antibody responses. This B cell phenotype does not result solely from the T cell deficiency, as the patients' B cells fail to activate NF-κB upon B cell receptor (BCR) stimulation. Human RLTPR deficiency is a CID affecting at least the CD28-responsive pathway in T cells and the BCR-responsive pathway in B cells.


Figures

Figure 1.
Figure 1.
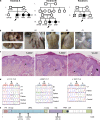
AR RLTPR deficiency. (a) Pedigrees of three families showing the familial segregation of the L372R, Q853X, and L525Q mutant RLTPR alleles. Kindreds are designated by A, B, and C. Generations are designated by Roman numerals (I, II, and III). A1, A2, A3, B1, B2, and C1 are represented by black symbols; the proband is indicated by an arrow. (b) Representative pictures of patients’ skin phenotype: Onyxis and perionyxis of all fingers of A1 and A2, pigmented plaques on the back of B1, large inflammatory and ulcerative plaques in the left armpit of B2, and seborrheic dermatitis on the scalp of C1. (c) B2’s inflammatory skin histology. (Left) Hyperplastic epidermis showing spongiosis accompanied by a slight lymphocytic exocytosis. There is a focal parakeratosis with crusting. (Middle) Psoriasiform hyperplastic epidermis with an overlying crust containing serosity and some neutrophils. A superficial perivascular infiltrate made up of lymphocytic cells is shown. (Right) Slightly spongiotic acanthotic epidermis with focal parakeratosis and lymphocytic perivascular infiltrate. White circles indicate spongiosis, thin black arrows indicate lymphocytic infiltrates, the thick black arrow indicates acanthosis, and white arrows indicate rete ridges. (d) Sequencing profiles showing the homozygous RLTPR c. 1115 T>G, p. L372R mutation of A1, A2, and A3; c. 2557 C>T, p. Q853X mutation of B1 and B2; c. 1574 T>A, p. L525Q of C1 in genomic DNA of patients, siblings, parents, and WT controls. (e) Schematic representation of the RLTPR protein. The different domains are depicted as follows: the pleckstrin homology (PH) domain in pink, the leucine-rich region (LRRs) in light blue, the HD in purple, the proline rich regions (PRR) in light green, and the CP-interacting (CPI) domain in black. The 38 exons are delineated by vertical dashed bars. The identified mutations and their amino acid positions are indicated by arrows. C-cap, C-terminal cap of the LRR; N-cap, N-terminal cap of the LRR.
Figure 2.
Figure 2.
Molecular characterization of RLTPR mutations. (a) HEK293T cells were either mock-transfected (NT) or transfected with an empty pCMV6 plasmid (EV) or pCMV6 plasmids encoding RLTPR WT or L372R, L525Q, or Q853X RLTPR mutant alleles. Whole cell lysates were subjected to immunoblots against the indicated RLTPR domains. (b) 3D representation of the CARMIL family LRR region (Zwolak et al., 2013). The L372 and L525 residues are depicted in red and blue, respectively. C-term, C terminus; N-term, N terminus. (c) Effect of mutations on RLTPR homodimerization. HEK293T cells were transfected with RLTPR WT or L372R, L525Q, or Q853X RLTPR mutant alleles tagged in the C terminus with either V5 or Myc/DDK. Full cell lysates (left) or anti-Myc immunoprecipitates (IP; right) are depicted. Data are representative of three independent experiments. Molecular mass is shown in kD.
Figure 3.
Figure 3.
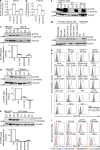
RLTPR expression in patients’ derived cells and leukocyte subsets. (a) Relative quantification of RLTPR mRNA in EBV-B cells from three independent controls (WT/WT), A1, B2, and C1 (three independent replicates). (b) Relative quantification of RLTPR mRNA in T-Saimiri cells from three independent controls (WT/WT), A1, and B1 (three independent replicates). (a and b) Human GUS was used as an endogenous gene for comparison. The ratio of RLTPR to GUS mRNA levels is shown, and error bars indicate the standard deviation for each mutant independently. (c–e) Immunoblot analysis of RLTPR expression in whole protein extracts of HEK293T cells transfected with an empty pCMV6 plasmid (EV) or pCMV6 plasmids encoding WT RLTPR or in indicated patients’ derived EBV-B cells (c; three independent replicates), T-Saimiri cells (d; four independent replicates), or PHA blasts (e; two to four independent replicates) and relative quantifications of RLTPR bands from controls (Ctl). Data are mean ± SD. (f) Immunoblot analysis of RLTPR expression in whole protein extracts of T-Saimiri cells from control or B1 not transduced (NT) or transduced with retrovirus encoding either a tag only (empty vector [EV]) or tagged WT RLTPR. Phoenix A (Pho. A) cells transfected with an empty pLZRS plasmid (EV) or pLZRS plasmid encoding WT RLTPR were used as controls. (g) Immunoblot analysis of RLTPR expression in whole protein extracts from monocytes, B cells, NK cells, CD4+ T cells, and CD8+ T cells of healthy controls and HEK293T overexpression controls. (f and g) Data are representative of three experiments. Molecular mass is shown in kD. (h) RLTPR expression determined by FACS in indicated leukocyte subsets from healthy controls. mDC, myeloid DC; mem. memory; pDCs, plasmacytoid DCs. (i) RLTPR expression determined by FACS in indicated leukocyte subsets from healthy control, A2, B2, and C1. Iso, isotypic control.
Figure 4.
Figure 4.
T cell immunophenotyping of RLTPR-deficient patients. (a) Frequency of naive (CD45RA+CCR7+), central memory (CD45RACCR7+), and effector memory (mem.; CD45RA+/−CCR7) compartments in CD4+ and CD8+ T cells of controls (Ctl) and patients. The horizontal bars represent the median. (Right) Representative FACS plots are depicted. Data show 20 controls and 6 patients. (b) Frequency of T reg cells among CD4+ T cells. Pat, patient. (c–e) Frequencies of MAIT cells (c), γδ T cells (d), and iNKT cells (e) among CD3+ T cells. (b and c) Data show 16 controls and 5 patients. (d and e) Data show 12 controls and 4 patients. (f) Frequency of Th cell subsets in CD4+ T cells. The different markers used to identify Th cell subsets are indicated above the plots. Data show 16 controls and 5 patients. (g) Frequency of CRTH2+ subset in CD4+ T cells. Data show 12 controls and 3 patients. Each symbol corresponds to an individual patient or healthy control. The horizontal bar represents the mean. (a–f) A Mann–Whitney test was used. *, P < 0.05; **, P < 0.01; ***, P < 0.001.
Figure 5.
Figure 5.
Impaired CD28 co-stimulation in patients’ CD4+ T cells. (a) Frequency of TNF +, IFN-γ+, and IL-2+ CD4+ memory T cells in healthy controls and patients after stimulation with the P815 cell line in the presence of 5 µg/ml anti-CD3 and/or 5 µg/ml anti-CD28 mAbs. 40 ng/ml PMA and 10−5 M ionomycin (Iono) stimulation was used as a positive control. One-way ANOVA and Mann–Whitney tests were used. (b) Frequency of TNF+, IFN-γ+, and CD107a+ CD8+ memory T cells in controls and patients after stimulation with the P815 cell line in the presence of 5 µg/ml anti-CD3 and/or 5 µg/ml anti-CD28 mAbs. 40 ng/ml PMA and 10−5 M ionomycin stimulation was used as a positive control. One-way ANOVA and Mann–Whitney tests were used. (a and b) Data show 20 controls and 6 patients. (c and d) Phospho-P65 (p-P65) detection by flow cytometry in CD4+ (c) and CD8+ (d) PHA blasts after cross-linking of indicated cell surface receptors. Representative FACS plot (left) and recapitulative bar graphs of eight controls (Ctl) and four patients (A3, B1, B2, and C1; right) are shown. The values represent the mean ± SEM. Wilcoxon matched-pairs signed rank test and Mann–Whitney tests were used. *, P < 0.05; **, P < 0.01; ***, P < 0.001. stim, simulated; unstim., unstimulated.
Figure 6.
Figure 6.
Proliferation and differentiation of CD4+ Th cells in vitro. (a) CFSE dilution of naive CD4+ T cells sorted from a representative control (Ctl) and patient (Pat; B2) after 4 d of culture in the presence of CD2/CD3/CD28-coated beads (Th0). (b) Percent IL-2+ naive CD4+ T cells after 4 d of culture under Th0 conditions. Data are mean ± SEM. *, P < 0.05. n = 4–5. (c) CFSE dilution of naive CD4+ T cells sorted from a representative control and patient (B2) after 4 d of culture under Th1 (IL-12), Th2 (IL-4), or Th17 (IL-1β, -6, -21, and -23; TGF-β) cell–polarizing conditions. Similar results were obtained when cells from three additional RLPTR-deficient cells were analyzed under the same conditions. (d) CFSE dilution of memory CD4+ T cells sorted from a healthy control or RLTPR-deficient patient (B2) and then cultured for 4 d in the presence of CD2/CD3/CD28-coated beads (Th0). (e) Percent IL-2+ memory CD4+ T cells after 4 d of culture under Th0 conditions. CFSE profiles are representative of data derived from five independent experiments using cells from different donors and patients. Data are mean ± SEM. (f) Expression of BCL2, BCL2L1 (Bcl-xL), and BCL2L11 (BIM) by activated CD4+ T cells from five controls and four RLTPR-deficient patients, as determined by qRT-PCR. The values represent the mean ± SEM mRNA levels of the indicated gene expressed by naive (left) and memory (right) CD4+ T cells relative to that expressed by corresponding cells from healthy controls (normalized to 1, indicated by the solid horizontal line; n = 2–3). (g–i) Secretion of Th1 (TNF and IFN-γ) and Th17 (IL-17A, IL-17F, and IL-22) cytokines (g), IL-6 and IL-10 (h), and Th2 (IL-4, IL-5, and IL-13) cytokines (i) by memory CD4+ T cells after 4 d of culture under Th0 conditions. The values represent the mean ± SEM from independent experiments using cells from five different healthy donors or four patients. *, P < 0.05; ***, P < 0.001; ****, P < 0.0001. n = 4–5. (j) Secretion of the indicated Th1 (TNF and IFN-γ), Th2 (IL-5 and IL-13), and Th17 (IL-17A, IL-17F, and IL-22) cytokines by naive CD4+ T cells after 4-d culture under Th1, Th2, or Th17 cell–polarizing conditions. The values represent the mean ± SEM and are derived from independent experiments using cells from five different healthy donors or four patients. *, P < 0.05; **, P < 0.01. (k) Expression of TBX21 (Tbet), GATA3, and RORC (RORγt), as determined by qRT-PCR, by control and RLTPR-deficient naive CD4+ T cells after culture under Th0, Th1, Th2, or Th17 conditions. The values represent the mean ± SEM fold change in expression relative to naive CD4+ T cells from healthy controls cultured under Th0 conditions (n = 2–3). (l) CD40L frequency and ICOS MFI on sorted naive CD4+ T cells from four patients and three controls after 4 d of culture under Th0 conditions. MFI was normalized to controls’ MFI. Two-way ANOVA was applied for g, I, and j. A Mann–Whitney test was applied for h.
Figure 7.
Figure 7.
B cell immunophenotyping and impaired NF-κB activation downstream the BCR of RLTPR-deficient patients. (a) Frequencies of transitional (CD10+CD27), naive (CD10CD27), and memory (CD10CD27+) B cells among CD19+ B cells. A Mann–Whitney test was used. Data show 13 controls and 4 patients. Ctl, control; Pat, patient. (b) Frequency of IgM+, IgG+, and IgA+ cells within the memory B cell subset. Each symbol corresponds to an individual patient or healthy control. The horizontal bar represents the mean. A Mann–Whitney test was used. *, P < 0.05; **, P < 0.01. Data show 12 controls and 4 patients. (c) Heat map of IgG and IgM serum auto-Abs to 94 self-antigens in four RLTPR-mutated patients (A1, B1, B2, and C1) and in two healthy donors (HD) and one patient with systemic lupus erythematosus (SLE) who served as negative and positive controls, respectively. Each line represents a different self-antigen. For each self-antigen, a colorimetric representation of RAR in each sample is shown according to the scale depicted at the top. (d and e) Phosphorylation of P65 (d) and degradation of IκBα (e) after stimulation of controls’ and patients’ PBMCs with CD40L (blue line), anti-IgM (red line), or PMA (black line). (f) Phosphorylation of ERK1/2 (pERK) after stimulation of controls’ and patients’ PBMCs with anti-IgM (red line) or PMA (black line). No stim, no stimulation.

References

    1. Acuto O., and Michel F.. 2003. CD28-mediated co-stimulation: a quantitative support for TCR signalling. Nat. Rev. Immunol. 3:939–951. 10.1038/nri1248 - DOI - PubMed
    1. Adzhubei I.A., Schmidt S., Peshkin L., Ramensky V.E., Gerasimova A., Bork P., Kondrashov A.S., and Sunyaev S.R.. 2010. A method and server for predicting damaging missense mutations. Nat. Methods. 7:248–249. 10.1038/nmeth0410-248 - DOI - PMC - PubMed
    1. Alkhairy O.K., Perez-Becker R., Driessen G.J., Abolhassani H., van Montfrans J., Borte S., Choo S., Wang N., Tesselaar K., Fang M., et al. 2015. Novel mutations in TNFRSF7/CD27: Clinical, immunologic, and genetic characterization of human CD27 deficiency. J. Allergy Clin. Immunol. 136:703–712.e10. 10.1016/j.jaci.2015.02.022 - DOI - PubMed
    1. Alkhairy O.K., Abolhassani H., Rezaei N., Fang M., Andersen K.K., Chavoshzadeh Z., Mohammadzadeh I., El-Rajab M.A., Massaad M., Chou J., et al. 2016. Spectrum of phenotypes associated with mutations in LRBA. J. Clin. Immunol. 36:33–45. 10.1007/s10875-015-0224-7 - DOI - PubMed
    1. Altin J.A., Tian L., Liston A., Bertram E.M., Goodnow C.C., and Cook M.C.. 2011. Decreased T-cell receptor signaling through Card11 differentially compromises forkhead box protein 3–positive regulatory versus TH2 effector cells to cause allergy. J. Allergy Clin. Immunol. 127:1277–1285.e5. 10.1016/j.jaci.2010.12.1081 - DOI - PMC - PubMed

MeSH terms