

High-resolution impedance manometry parameters enhance the esophageal motility evaluation in non-obstructive dysphagia patients without a major Chicago Classification motility disorder
- PMID: 27647522
- PMCID: PMC5328837
- DOI: 10.1111/nmo.12941
High-resolution impedance manometry parameters enhance the esophageal motility evaluation in non-obstructive dysphagia patients without a major Chicago Classification motility disorder
Abstract
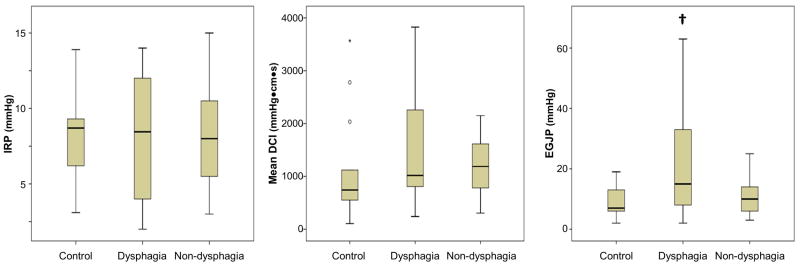
Background: High-resolution impedance manometry (HRIM) allows evaluation of esophageal bolus retention, flow, and pressurization. We aimed to perform a collaborative analysis of HRIM metrics to evaluate patients with non-obstructive dysphagia.
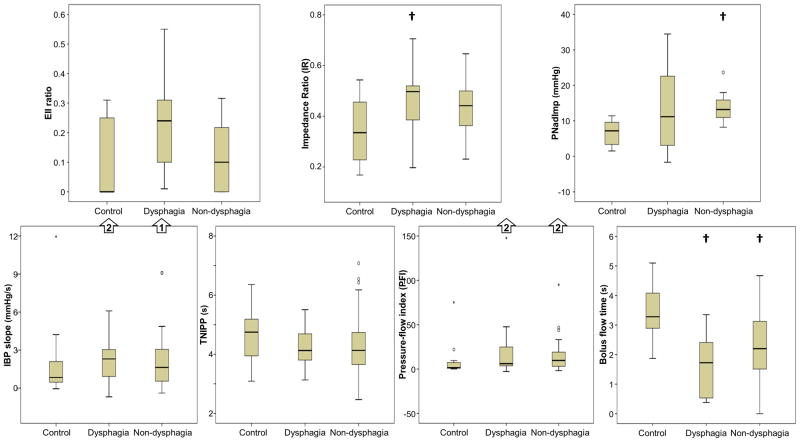
Methods: Fourteen asymptomatic controls (58% female; ages 20-50) and 41 patients (63% female; ages 24-82), 18 evaluated for dysphagia and 23 for reflux (non-dysphagia patients), with esophageal motility diagnoses of normal motility or ineffective esophageal motility, were evaluated with HRIM and a global dysphagia symptom score (Brief Esophageal Dysphagia Questionnaire). HRIM was analyzed to assess Chicago Classification metrics, automated pressure-flow metrics, the esophageal impedance integral (EII) ratio, and the bolus flow time (BFT).
Key results: Significant symptom-metric correlations were detected only with basal EGJ pressure, EII ratio, and BFT. The EII ratio, BFT, and impedance ratio differed between controls and dysphagia patients, while the EII ratio in the upright position was the only measure that differentiated dysphagia from non-dysphagia patients.
Conclusions & inferences: The EII ratio and BFT appear to offer an improved diagnostic evaluation in patients with non-obstructive dysphagia without a major esophageal motility disorder. Bolus retention as measured with the EII ratio appears to carry the strongest association with dysphagia, and thus may aid in the characterization of symptomatic patients with otherwise normal manometry.
Keywords: dysphagia; esophageal motility; high-resolution manometry; impedance.
© 2016 John Wiley & Sons Ltd.
Figures


Similar articles
-
Inter-rater agreement of novel high-resolution impedance manometry metrics: Bolus flow time and esophageal impedance integral ratio.Neurogastroenterol Motil. 2018 Jun;30(6):e13289. doi: 10.1111/nmo.13289. Epub 2018 Jan 11. Neurogastroenterol Motil. 2018. PMID: 29322591 Free PMC article.
-
High-resolution impedance manometry parameters in the evaluation of esophageal function of non-obstructive dysphagia patients.Neurogastroenterol Motil. 2019 Feb;31(2):e13505. doi: 10.1111/nmo.13505. Epub 2018 Nov 13. Neurogastroenterol Motil. 2019. PMID: 30426609 Free PMC article.
-
High-resolution impedance manometry measurement of bolus flow time in achalasia and its correlation with dysphagia.Neurogastroenterol Motil. 2015 Sep;27(9):1232-8. doi: 10.1111/nmo.12613. Epub 2015 Jun 18. Neurogastroenterol Motil. 2015. PMID: 26088614 Free PMC article.
-
Combined impedance-manometry for the evaluation of esophageal disorders.Curr Opin Gastroenterol. 2014 Jul;30(4):422-7. doi: 10.1097/MOG.0000000000000079. Curr Opin Gastroenterol. 2014. PMID: 24859805 Review.
-
How to Optimally Apply Impedance in the Evaluation of Esophageal Dysmotility.Curr Gastroenterol Rep. 2016 Nov;18(11):60. doi: 10.1007/s11894-016-0534-9. Curr Gastroenterol Rep. 2016. PMID: 27738965 Free PMC article. Review.
Cited by
-
Bolus transit of upper esophageal sphincter on high-resolution impedance manometry study correlate with the laryngopharyngeal reflux symptoms.Sci Rep. 2021 Oct 14;11(1):20392. doi: 10.1038/s41598-021-99927-0. Sci Rep. 2021. PMID: 34650171 Free PMC article.
-
When Manometry and Functional Lumen Imaging Probe Disagree: The Current Limitations of the Chicago Classification Version 4.0 and Probable Extended Indications of Functional Lumen Imaging Probe.J Neurogastroenterol Motil. 2025 Jul 30;31(3):304-312. doi: 10.5056/jnm25054. Epub 2025 Apr 18. J Neurogastroenterol Motil. 2025. PMID: 40254534 Free PMC article. Review.
-
Inter-rater agreement of novel high-resolution impedance manometry metrics: Bolus flow time and esophageal impedance integral ratio.Neurogastroenterol Motil. 2018 Jun;30(6):e13289. doi: 10.1111/nmo.13289. Epub 2018 Jan 11. Neurogastroenterol Motil. 2018. PMID: 29322591 Free PMC article.
-
Performing High-resolution Impedance Manometry After Endoscopy With Conscious Sedation Has Negligible Effects on Esophageal Motility Results.J Neurogastroenterol Motil. 2020 Jul 30;26(3):352-361. doi: 10.5056/jnm20006. J Neurogastroenterol Motil. 2020. PMID: 32606257 Free PMC article.
-
New Developments in Esophageal Motility Testing.Curr Treat Options Gastroenterol. 2019 Mar;17(1):76-88. doi: 10.1007/s11938-019-00218-5. Curr Treat Options Gastroenterol. 2019. PMID: 30712156 Free PMC article. Review.
References
-
- Clouse RE, Staiano A, Alrakawi A, Haroian L. Application of topographical methods to clinical esophageal manometry. Am J Gastroenterol. 2000;95(10):2720–30. - PubMed
-
- Pandolfino JE, Ghosh SK, Rice J, Clarke JO, Kwiatek MA, Kahrilas PJ. Classifying esophageal motility by pressure topography characteristics: a study of 400 patients and 75 controls. Am J Gastroenterol. 2008;103(1):27–37. - PubMed
-
- Tutuian R, Castell DO. Clarification of the esophageal function defect in patients with manometric ineffective esophageal motility: studies using combined impedance-manometry. Clin Gastroenterol Hepatol. 2004;2(3):230–6. - PubMed
MeSH terms
Grants and funding
LinkOut - more resources
Full Text Sources
Other Literature Sources
Medical
