

The added value of C-reactive protein measurement in diagnosing pneumonia in primary care: a meta-analysis of individual patient data
- PMID: 27647618
- PMCID: PMC5235926
- DOI: 10.1503/cmaj.151163
The added value of C-reactive protein measurement in diagnosing pneumonia in primary care: a meta-analysis of individual patient data
Abstract
Background: C-reactive protein (CRP) is increasingly being included in the diagnostic work-up for community-acquired pneumonia in primary care. Its added diagnostic value beyond signs and symptoms, however, remains unclear. We conducted a meta-analysis of individual patient data to quantify the added value of CRP measurement.
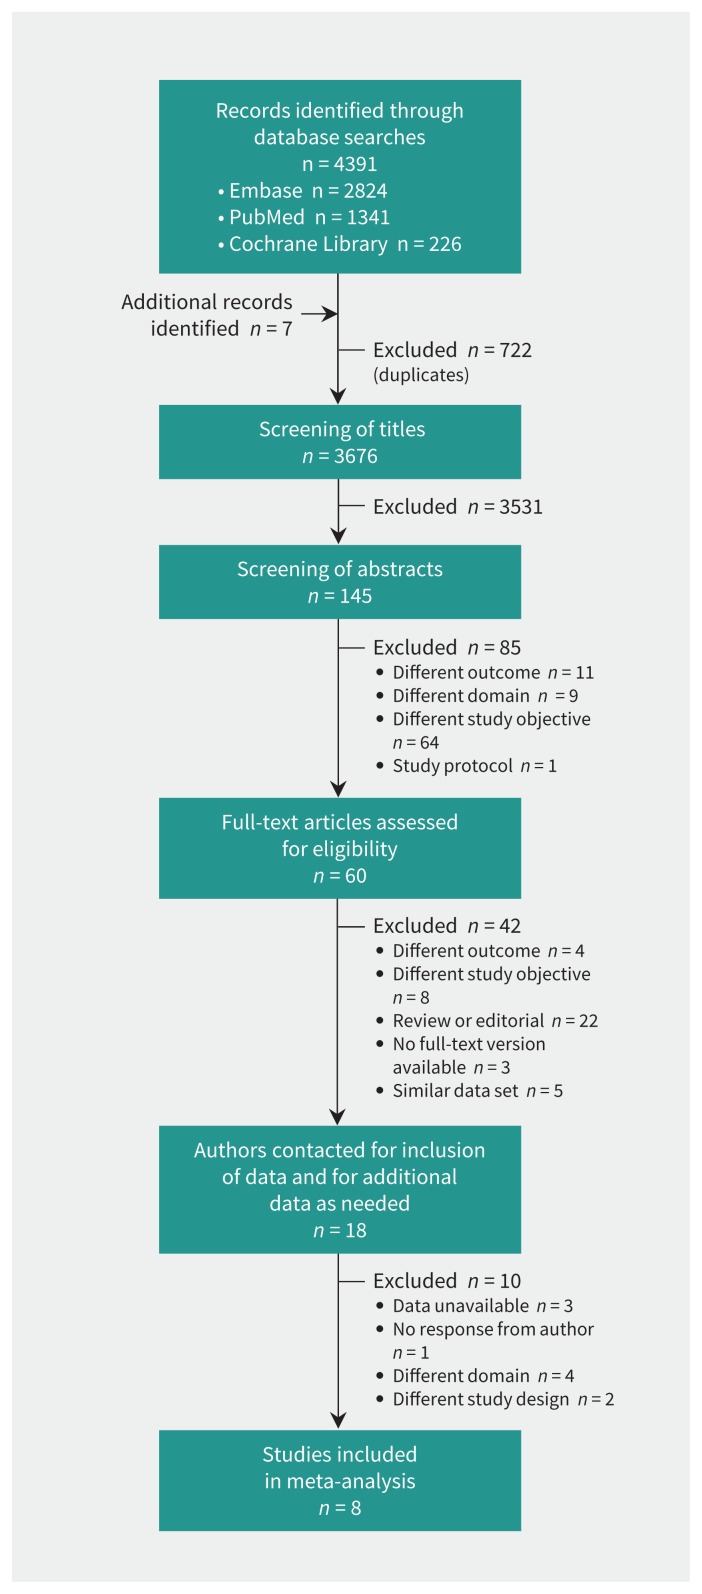
Methods: We included studies of the diagnostic accuracy of CRP in adult outpatients with suspected lower respiratory tract infection. We contacted authors of eligible studies for inclusion of data and for additional data as needed. The value of adding CRP measurement to a basic signs-and-symptoms prediction model was assessed. Outcome measures were improvement in discrimination between patients with and without pneumonia in primary care and improvement in risk classification, both within the individual studies and across studies.
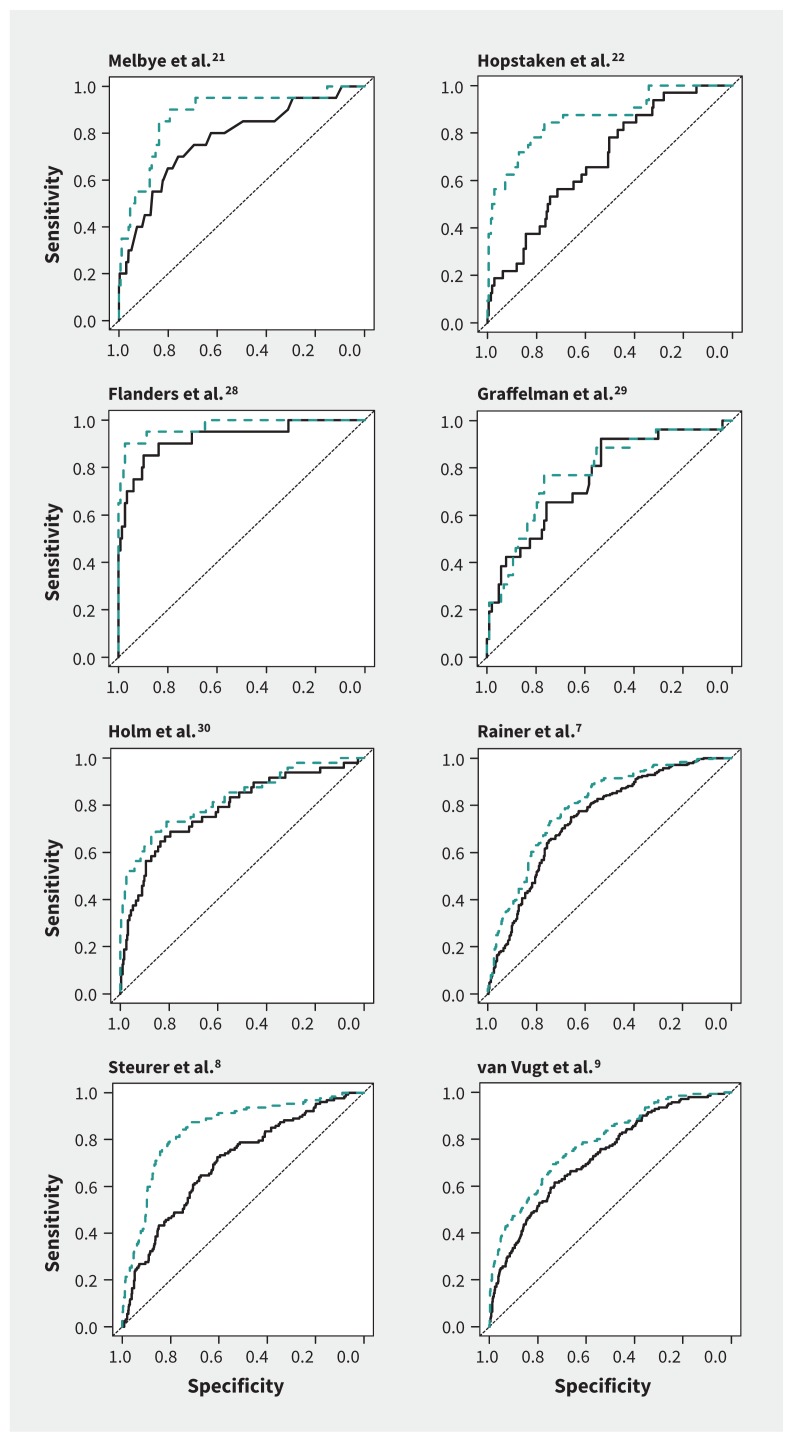
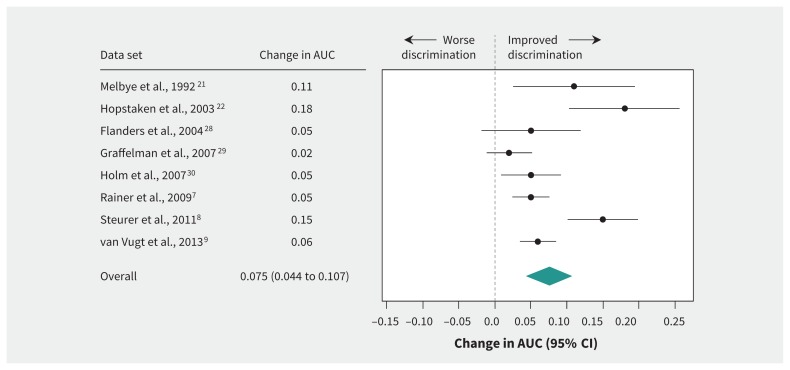
Results: Authors of 8 eligible studies (n = 5308) provided their data sets. In all of the data sets, discrimination between patients with and without pneumonia improved after CRP measurement was added to the prediction model (extended model), with a mean improvement in the area under the curve of 0.075 (range 0.02-0.18). In a hypothetical cohort of 1000 patients, the proportion of patients without pneumonia correctly classified at low risk increased from 28% to 36% in the extended model, and the proportion with pneumonia correctly classified at high risk increased from 63% to 70%. The number of patients with pneumonia classified at low risk did not change (n = 4). Overall, the proportion of patients assigned to the intermediate-risk category decreased from 56% to 51%.
Interpretation: Adding CRP measurement to the diagnostic work-up for suspected pneumonia in primary care improved the discrimination and risk classification of patients. However, it still left a substantial group of patients classified at intermediate risk, in which clinical decision-making remains challenging.
© 2017 Joule Inc. or its licensors.
Conflict of interest statement
Competing interests: Rogier Hopstaken received a grant from Alere for a study on the value of point-of-care CRP measurement in children and speaker fees from Alere for lectures on antibiotic resistance. Niek de Wit received grants from Saltro Diagnostic Center for Primary Care (a local primary care laboratory) and ZonMw (Dutch government funding agency for health research and development) paid to his institution; he is a member of the board of trustees for the Gelderse Vallei Hospital and an advisory board member for the Dutch Institute for Quality in Health Care. Theo Verheij received grants from Saltro, Pfizer, ZonMW and the European Commission; honoraria as a member of the board for IZER (a large cooperation of general practitioners in Rotterdam) and an advisor to the Health Council of the Netherlands; and a grant from Axis-Shield (for test equipment in a trial). No other competing interests were declared.
Figures
References
-
- Clyne B, Olshaker JS. The C-reactive protein. J Emerg Med 1999;17:1019–25. - PubMed
-
- Minnaard MC, van de Pol AC, Broekhuizen BDL, et al. Analytical performance, agreement and user-friendliness of five C-reactive protein point-of-care tests. Scand J Clin Lab Invest 2013; 73:627–34. - PubMed
-
- Engel MF, Paling FP, Hoepelman IM, et al. Evaluating the evidence for the implementation of C-reactive protein measurement in adult patients with suspected lower respiratory tract infection in primary care: a systematic review. Fam Pract 2012;29:383–93. - PubMed
-
- Falk G, Fahey T. C-reactive protein and community-acquired pneumonia in ambulatory care: systematic review of diagnostic accuracy studies. Fam Pract 2009;26:10–21. - PubMed
LinkOut - more resources
Full Text Sources
Other Literature Sources
Research Materials
Miscellaneous