

Modified Atkins diet induces subacute selective ragged-red-fiber lysis in mitochondrial myopathy patients
- PMID: 27647878
- PMCID: PMC5090657
- DOI: 10.15252/emmm.201606592
Modified Atkins diet induces subacute selective ragged-red-fiber lysis in mitochondrial myopathy patients
Abstract
Mitochondrial myopathy (MM) with progressive external ophthalmoplegia (PEO) is a common manifestation of mitochondrial disease in adulthood, for which there is no curative therapy. In mice with MM, ketogenic diet significantly delayed progression of the disease. We asked in this pilot study what effects high-fat, low-carbohydrate "modified Atkins" diet (mAD) had for PEO/MM patients and control subjects and followed up the effects by clinical, morphological, transcriptomic, and metabolomic analyses. All of our five patients, irrespective of genotype, showed a subacute response after 1.5-2 weeks of diet, with progressive muscle pain and leakage of muscle enzymes, leading to premature discontinuation of the diet. Analysis of muscle ultrastructure revealed selective fiber damage, especially in the ragged-red-fibers (RRFs), a MM hallmark. Two years of follow-up showed improvement of muscle strength, suggesting activation of muscle regeneration. Our results indicate that (i) nutrition can modify mitochondrial disease progression, (ii) dietary counseling should be part of MM care, (iii) short mAD is a tool to induce targeted RRF lysis, and (iv) mAD, a common weight-loss method, may induce muscle damage in a population subgroup.
Keywords: PEO; mitochondrial myopathy; modified Atkins diet; ragged‐red‐fibers.
© 2016 The Authors. Published under the terms of the CC BY 4.0 license.
Figures
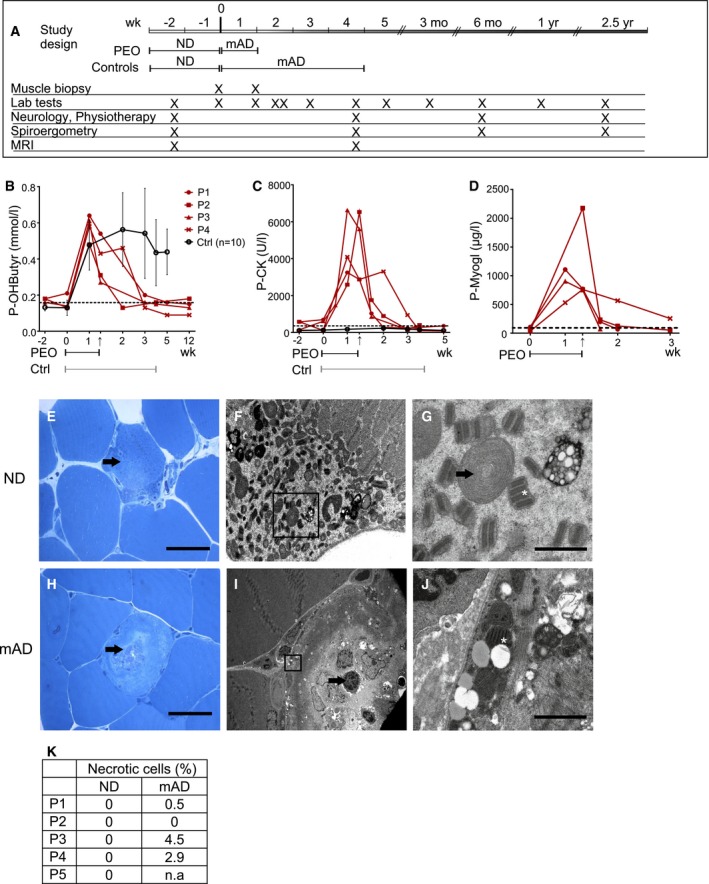
- A
Modified Atkins diet (mAD) study protocol. PEO patients followed mAD for 4–11 days; the healthy control subjects for 4 weeks. Sampling times of controls were matched with their corresponding PEO patients.
- B–D
Plasma beta‐hydroxybutyrate (ketone body; B), creatine kinase (CK; C), and myoglobin (D) concentrations. Dashed line: upper limit of control range. The individual patients are shown separately, and controls as mean with standard deviation (n = 10). Arrow: mAD endpoint in PEO patients; lines under graphs: duration of mAD.
- E–G
PEO patient (P1) muscle before diet: (E) Ultrathin section of abnormal muscle fiber (arrowhead) with subsarcolemmal accumulations of mitochondria. Scale bar, 50 μm. (F) Electron micrograph of subsarcolemmal accumulation of abnormal mitochondria (same cell as in E). (G) Enlargement of the area marked in (F); mitochondria with paracrystalline “parking lot” inclusions (arrow) and concentric cristae (asterisk). Scale bar, 1 μm.
- H–J
PEO patient (P1) muscle after mAD (H–J): (H) ultrathin section, lytic muscle fiber with centrally located organellar debris (arrow). Scale bar, 50 μm. (I) Electron micrograph of a degrading muscle fiber with an invaded macrophage (arrow) (same cell as in H). (J) Enlargement of the fiber in (I): paracrystalline inclusions within mitochondria (asterisk). Scale bar, 1 μm.
- K
Quantification of necrotic or apoptotic cells in PEO muscle from ultrathin sections. n.a., not available.
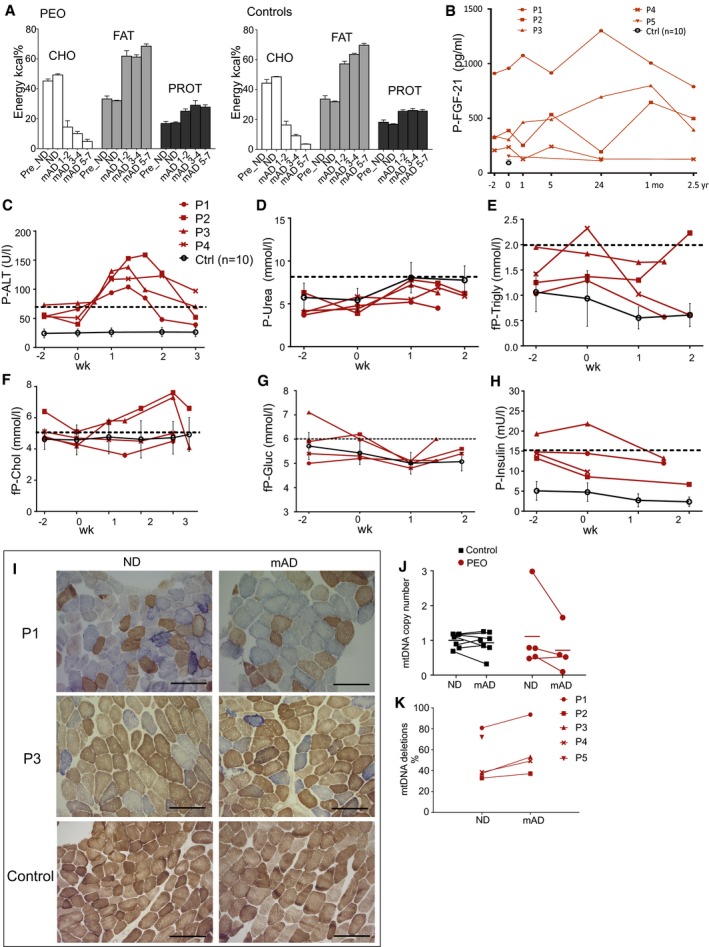
- A
Isocaloric mAD composition in PEO patients and control subjects. The amounts of fat, carbohydrates, and proteins are represented as kcal% from the total daily energy expenditure. Values shown as mean and SEM.
- B
Plasma FGF‐21 levels in individual patients and in grouped controls (n = 10) shown as mean ± SD.
- C–H
Plasma levels of alanine aminotransferase (P‐ALT), urea, triglycerides, cholesterol, glucose and insulin in PEO patients and control subjects. Controls (n = 10) are shown as mean ± SD. Dashed line: upper limit of control range.
- I
COX‐SDH histochemical activity analysis on frozen sections from quadriceps femoris muscle of the PEO patients in normal diet (ND) and after modified Atkins diet (mAD). Scale bar, 150 μm.
- J
Skeletal muscle, relative mtDNA amount compared to nuclear single‐copy APP gene.
- K
mtDNA deletion load as a percentage from total mtDNA in PEO muscle.
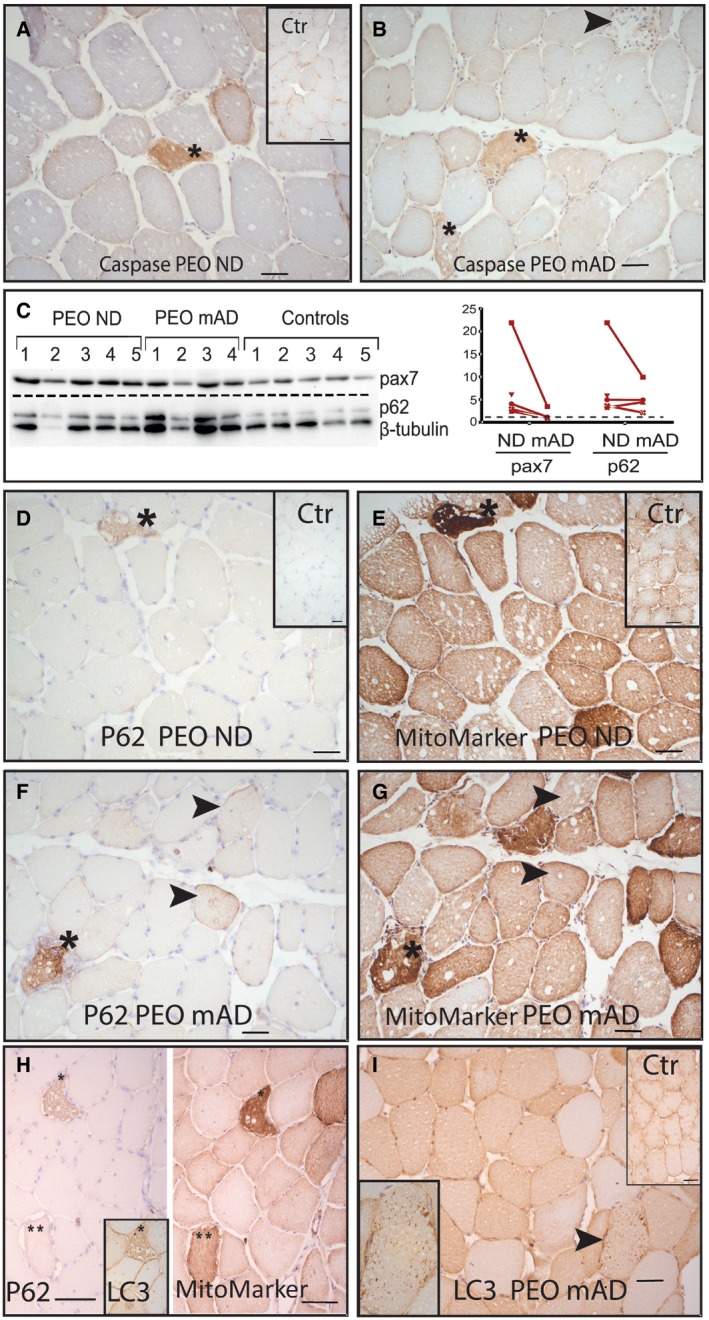
- A, B
Cleaved caspase‐3‐positive muscle fibers (*). PEO patient (P3) on normal diet (A; inset: caspase staining in healthy control individual) and after modified Atkins diet (B). Arrowhead: caspase‐negative necrotic fiber.
- C
Western blot analysis of autophagy receptor p62 and pax7 marking muscle satellite cell activation; left, blot; right, signal quantification in each patient.
- D, E
Immunohistochemical analysis of p62 and mitochondrial mass marker in consecutive sections. Asterisks indicate p62‐positive fibers and corresponding affected ragged‐red fibers.
- F, G
Immunohistochemical analysis of p62 and mitochondrial mass marker after mAD; consecutive sections. Arrowheads indicate fibers that show p62 positivity but have normal mitochondrial mass.
- H
p62‐ and LC3‐positive ragged‐red fibers (*) in PEO patient (P2) on normal diet.
- I
Muscle fibers showing granular LC3‐positivity in PEO patient (P1) after mAD. Arrowhead indicates fiber that is enlarged in the inset figure.
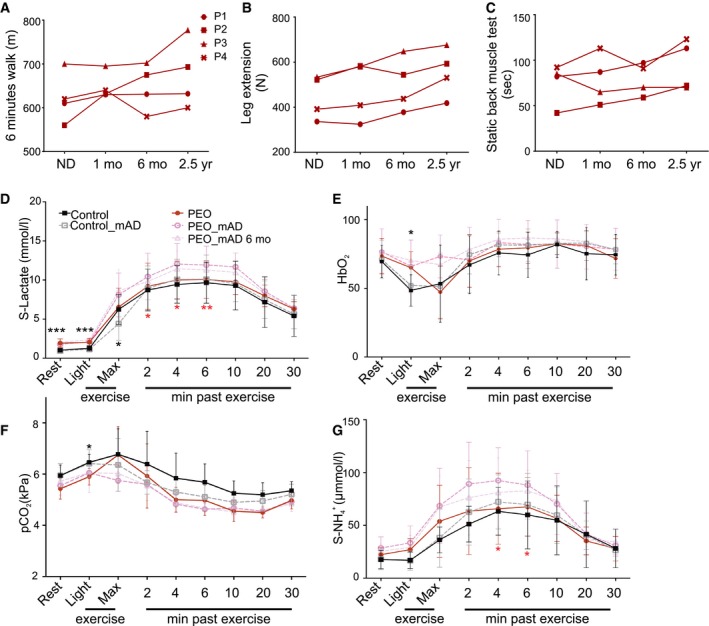
- A–C
Muscle strength and performance of PEO patients (P1‐P4) on normal diet (ND) and after modified Atkins diet (mAD) (1 and 6 months and 2.5 years after initiation of diet).
- D–G
Spiroergometry results from PEO patients and control subjects on normal diet (ND), as well as 1 and 6 months after mAD initiation. PEO patients had higher serum lactate levels, and attenuated respiratory response to exercise. These effects were further enhanced after mAD and remained after 6 months of the study. mAD increased patients' serum ammonium () levels. Data are presented as mean ± SD.
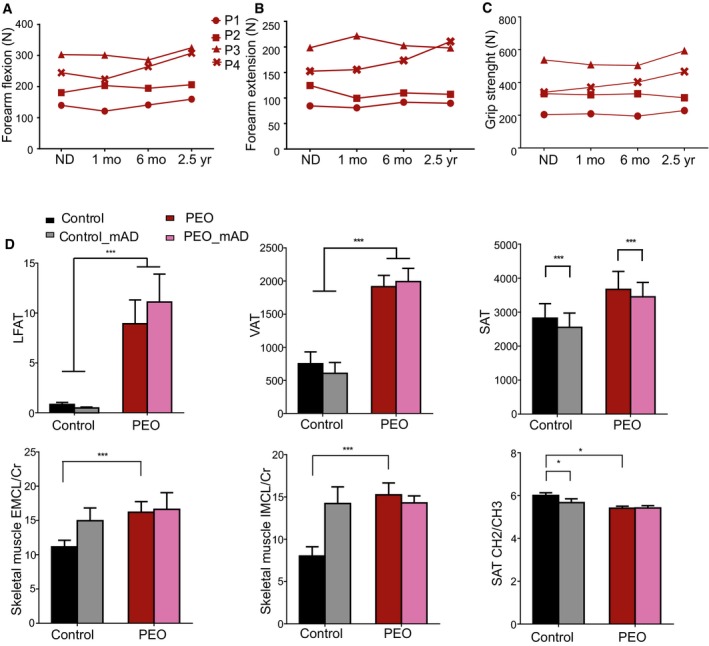
- A–C
Muscle strength and function of PEO patients on normal diet (ND) as well as 1 and 6 months and 2.5 years after initiation of mAD. P1‐4, patients 1–4.
- D
Magnetic resonance imaging and spectroscopy of liver fat (LFAT), visceral (VAT), and subcutaneous (SAT) adipose tissue, and skeletal muscle of controls and PEO patients on normal diet (ND) and 4 weeks after initiating mAD. EMCL/Cr: extramyocellular lipids (EMCL) or intramyocellular lipids (IMCL) correlated to muscle creatine (Cr). SAT showed decrease of CH2/CH3 ratio, indicating decrease in fatty acid length after the diet in controls. Values shown as mean and SEM. Statistical tests: LFAT, VAT and SAT two‐way ANOVA; ECML, IMCL and SAT CH2/CH3 Student's t‐test (two‐tailed). *P < 0.05, ***P < 0.001.
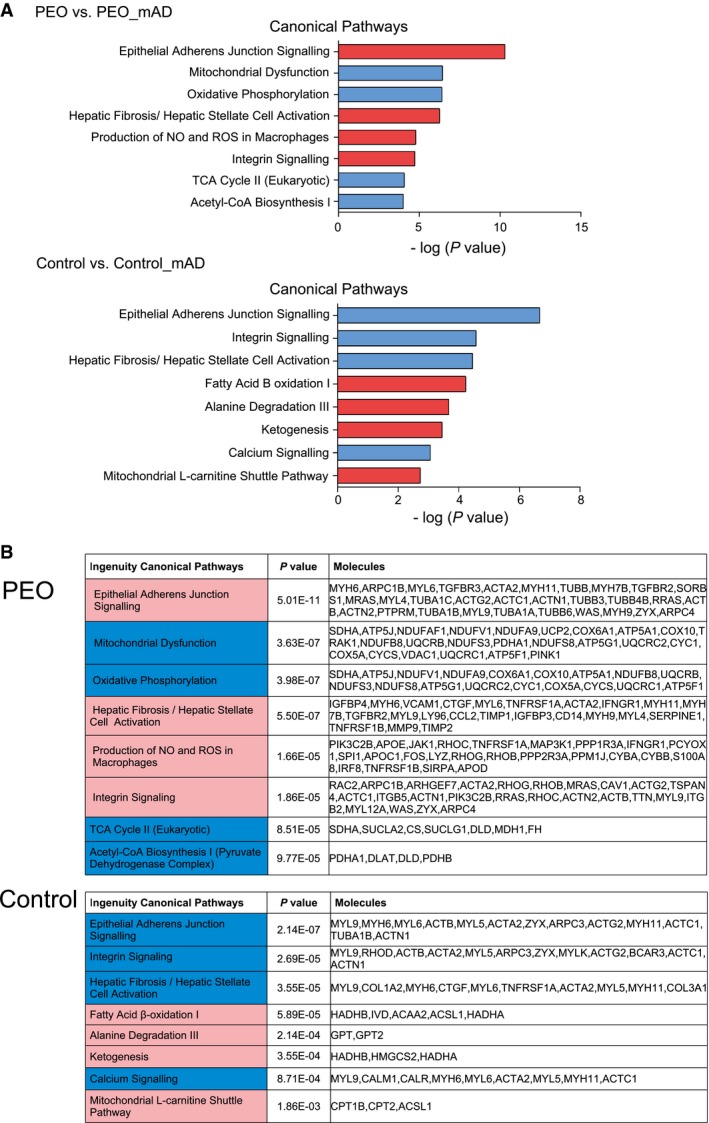
Most significantly altered transcriptomic pathways in PEO muscle (n = 4) and in control subjects muscle after mAD (n = 8). Blue color represents down‐regulated and red color represents up‐regulated pathways.
Genes, the expression levels of which formed the pathway results in (A). Statistical test: Benjamini‐Hochberg multiple testing.
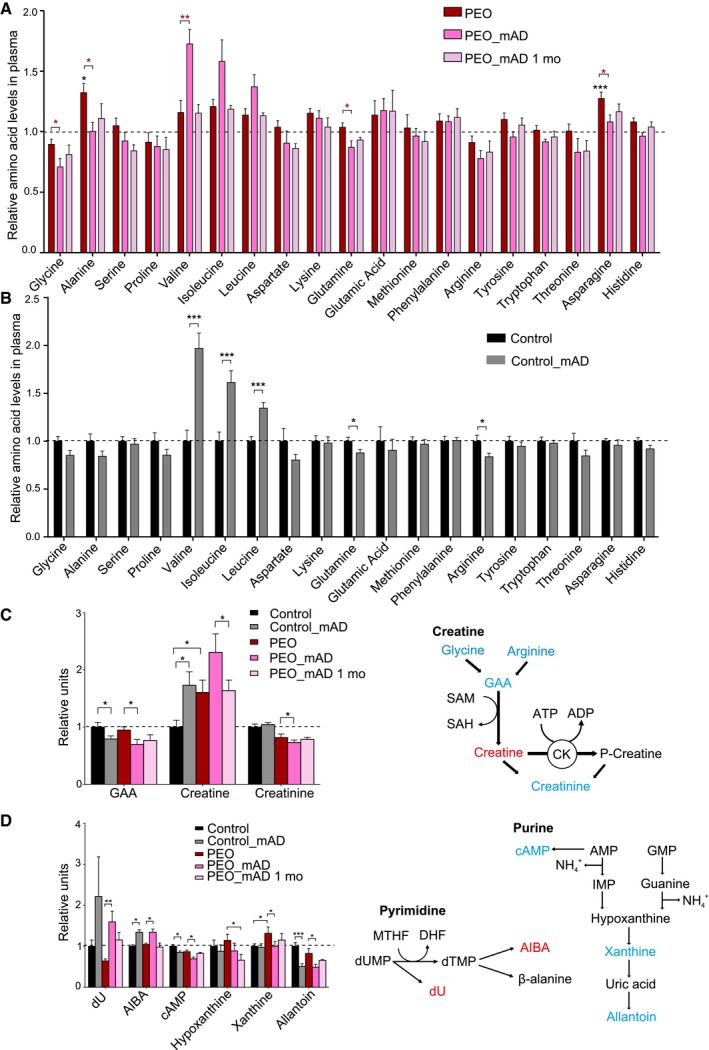
PEO patients, relative amino acid levels on normal diet (PEO), immediately after finishing mAD (PEO_mAD), and 1 month after mAD.
Control subjects, relative amino acid levels on normal diet (Control) and immediately after finishing mAD (Control_mAD).
Relative values of plasma metabolites in the creatine pathway, compared to controls on ND. Right: illustration of major metabolites and pathway of creatine synthesis.
Relative values of plasma purine and pyrimidine degradation pathway intermediates, compared to controls on ND. Right: illustration of major metabolites and synthesis of pyrimidines and purines.
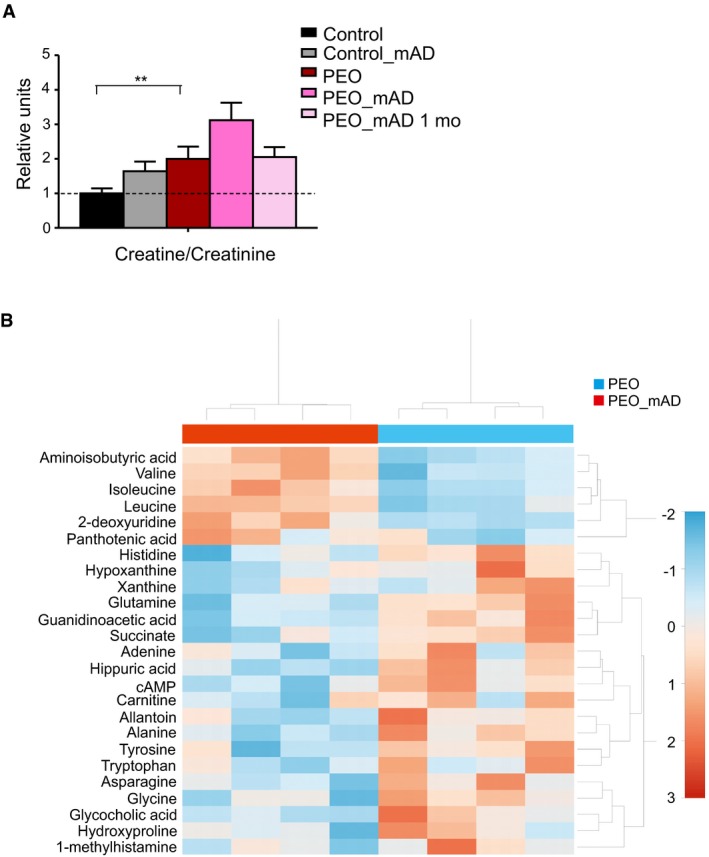
Plasma creatine to creatinine ratio; plasma metabolomics analysis. Values shown as mean and SEM. Student's t‐test (two‐tailed). **P < 0.01.
Heatmap of the 25 most significantly changed metabolites in PEO plasma before and after mAD. Values represent relative to mean in the given data set. Color key: Z‐score. Hierarchical clustering: vertical axis, metabolites; horizontal axis, patients. Abbreviations: PEO, progressive external ophthalmoplegia; mAD, modified Atkins diet; mo, month after diet initiation.
Comment in
-
Effects of ketosis in mitochondrial myopathy: potential benefits of a mitotoxic diet.EMBO Mol Med. 2016 Nov 2;8(11):1231-1233. doi: 10.15252/emmm.201606933. Print 2016 Nov. EMBO Mol Med. 2016. PMID: 27729389 Free PMC article.
References
-
- Ahola‐Erkkila S, Carroll CJ, Peltola‐Mjosund K, Tulkki V, Mattila I, Seppanen‐Laakso T, Oresic M, Tyynismaa H, Suomalainen A (2010) Ketogenic diet slows down mitochondrial myopathy progression in mice. Hum Mol Genet 19: 1974–1984 - PubMed
-
- Boden G, Sargrad K, Homko C, Mozzoli M, Stein TP (2005) Effect of a low‐carbohydrate diet on appetite, blood glucose levels, and insulin resistance in obese patients with type 2 diabetes. Ann Intern Med 142: 403–411 - PubMed
-
- Clark KM, Bindoff LA, Lightowlers RN, Andrews RM, Griffiths PG, Johnson MA, Brierley EJ, Turnbull DM (1997) Reversal of a mitochondrial DNA defect in human skeletal muscle. Nat Genet 16: 222–224 - PubMed
Publication types
MeSH terms
LinkOut - more resources
Full Text Sources
Other Literature Sources
Medical
