. 2016 Oct 4;113(40):11249-11254.
doi: 10.1073/pnas.1606786113. Epub 2016 Sep 19.

Critical reappraisal confirms that Mitofusin 2 is an endoplasmic reticulum-mitochondria tether

Affiliations

Critical reappraisal confirms that Mitofusin 2 is an endoplasmic reticulum-mitochondria tether

Deborah Naon et al. Proc Natl Acad Sci U S A. .

Abstract

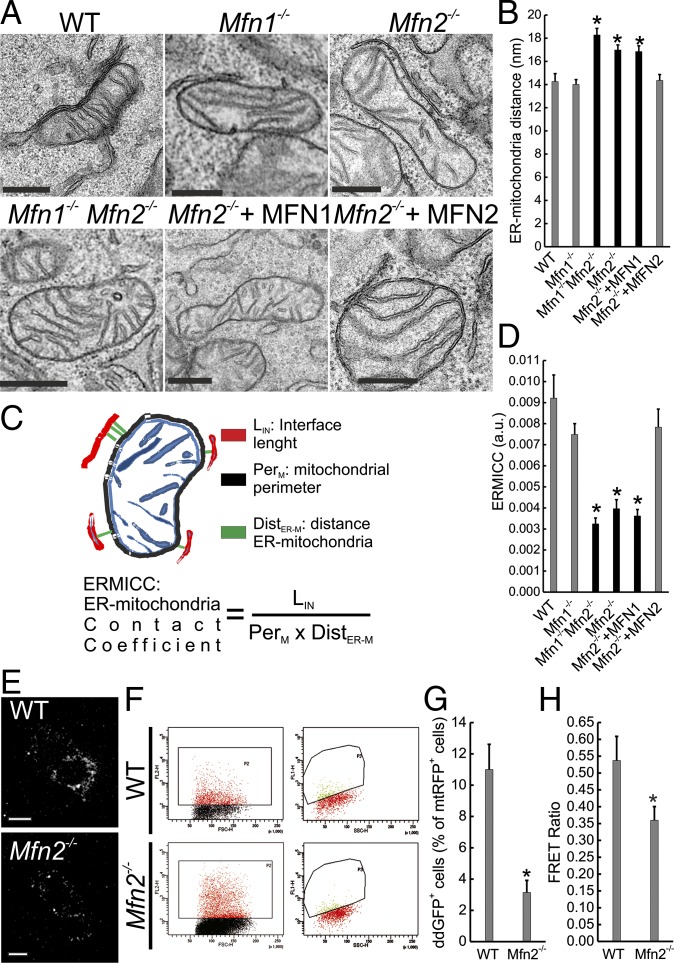
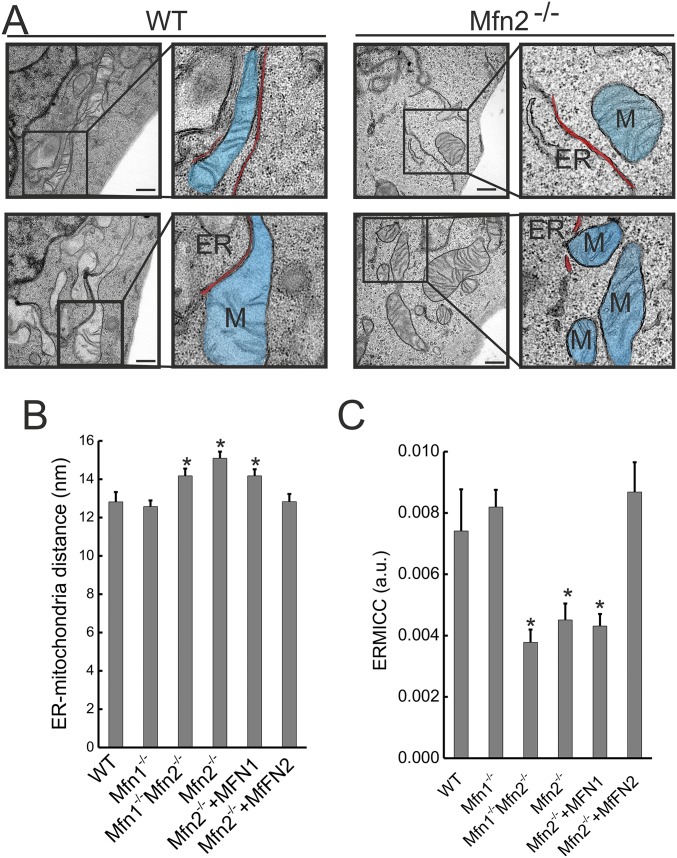
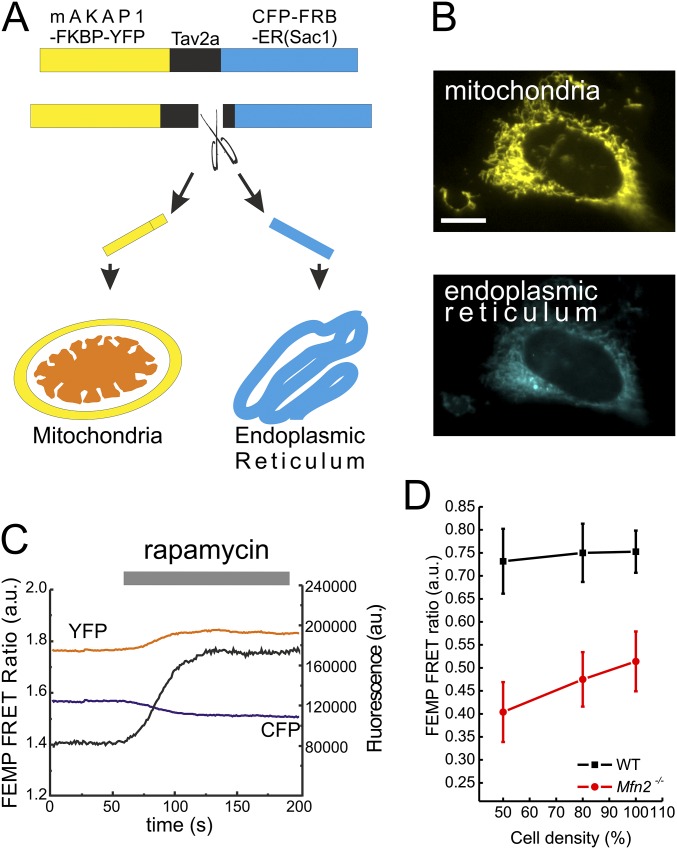
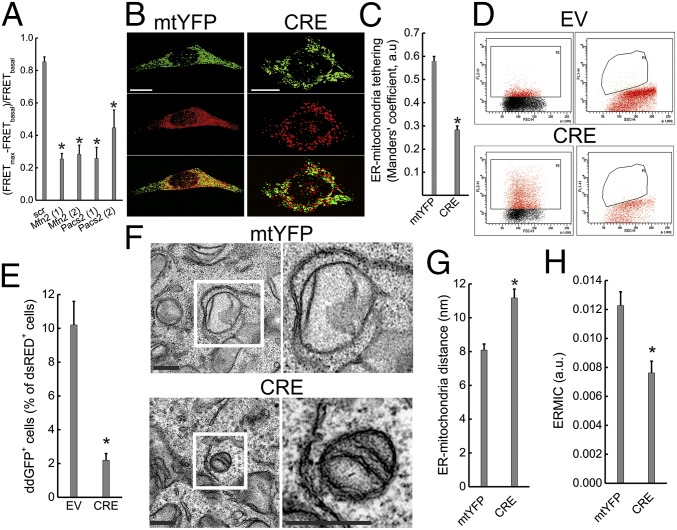
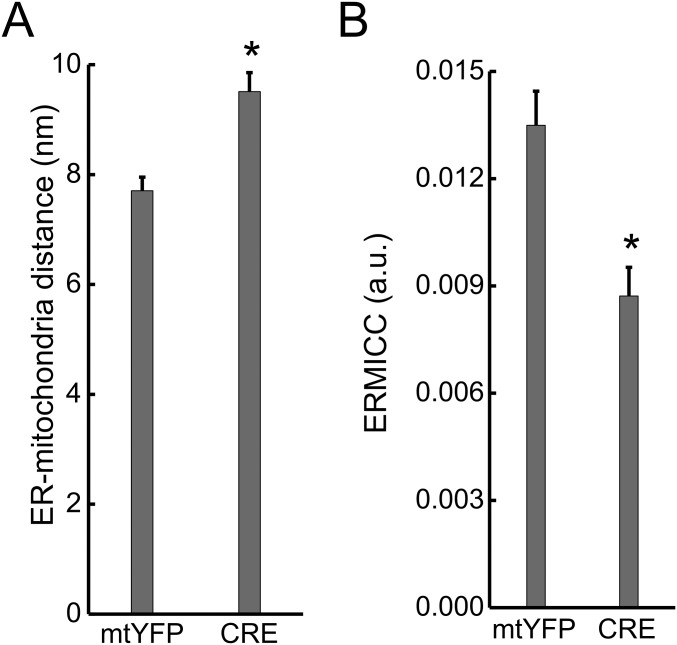
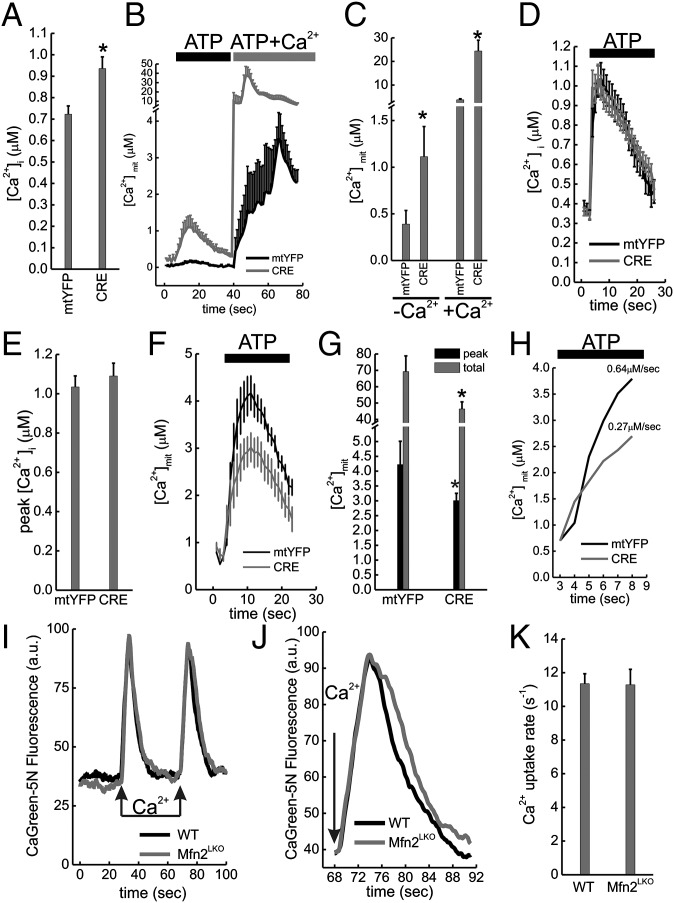
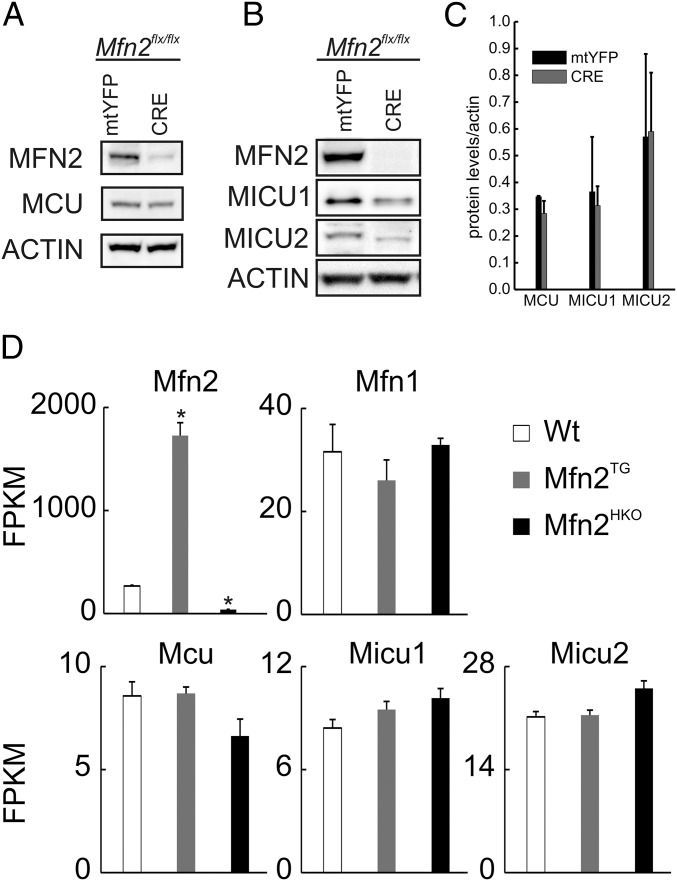
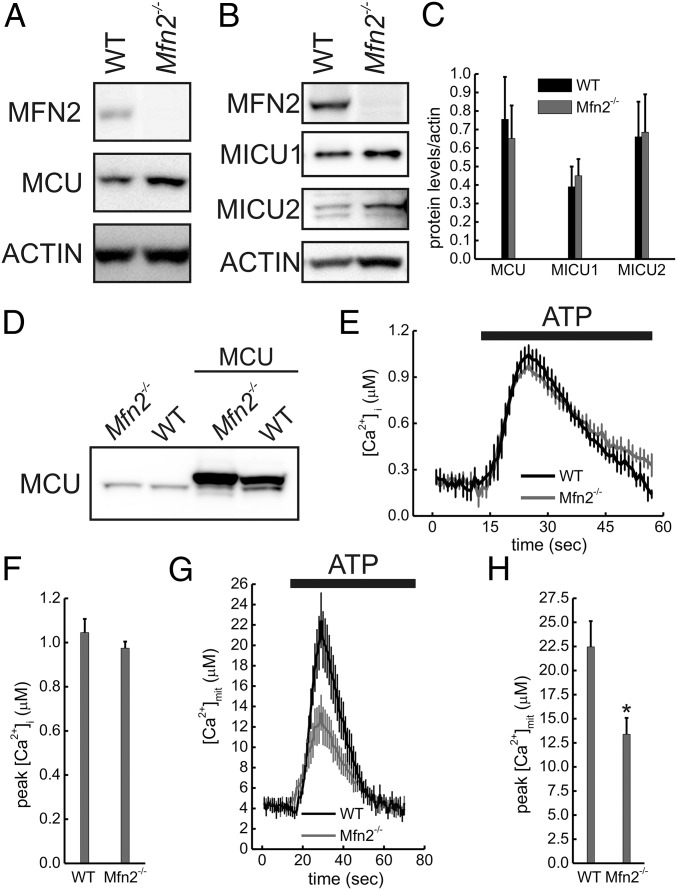
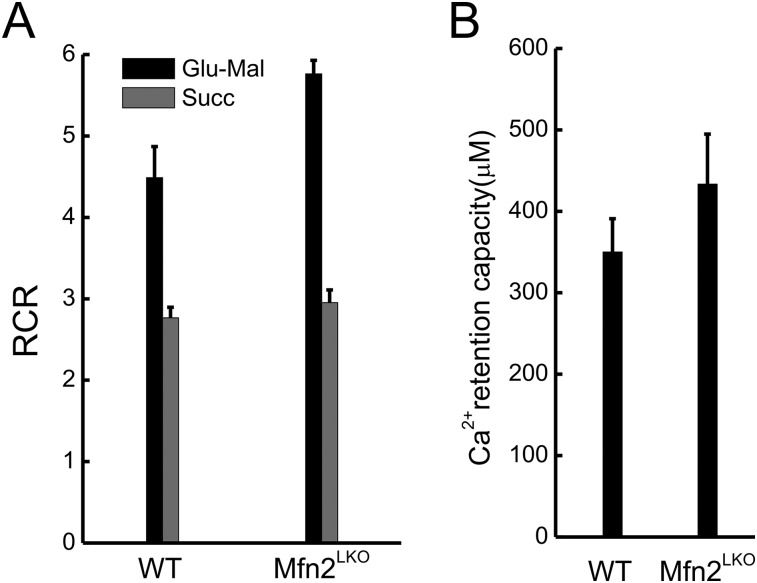
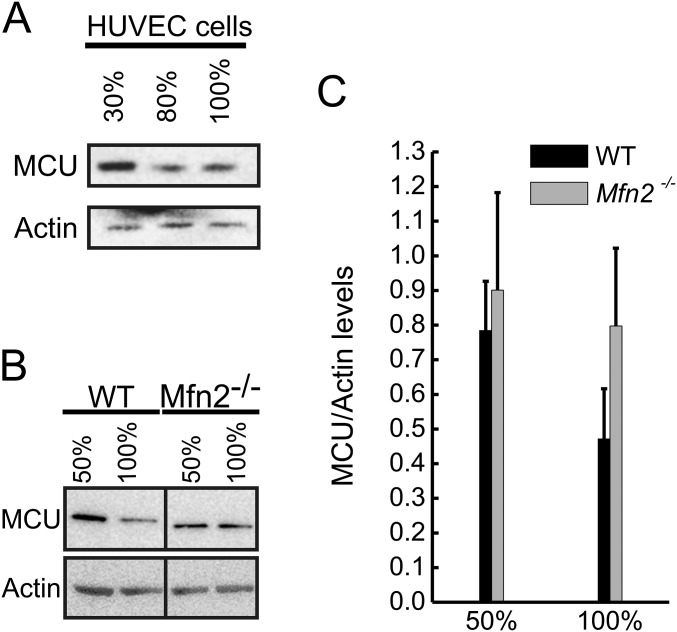
The discovery of the multiple roles of mitochondria-endoplasmic reticulum (ER) juxtaposition in cell biology often relied upon the exploitation of Mitofusin (Mfn) 2 as an ER-mitochondria tether. However, this established Mfn2 function was recently questioned, calling for a critical re-evaluation of Mfn2's role in ER-mitochondria cross-talk. Electron microscopy and fluorescence-based probes of organelle proximity confirmed that ER-mitochondria juxtaposition was reduced by constitutive or acute Mfn2 deletion. Functionally, mitochondrial uptake of Ca2+ released from the ER was reduced following acute Mfn2 ablation, as well as in Mfn2-/- cells overexpressing the mitochondrial calcium uniporter. Mitochondrial Ca2+ uptake rate and extent were normal in isolated Mfn2-/- liver mitochondria, consistent with the finding that acute or chronic Mfn2 ablation or overexpression did not alter mitochondrial calcium uniporter complex component levels. Hence, Mfn2 stands as a bona fide ER-mitochondria tether whose ablation decreases interorganellar juxtaposition and communication.

Keywords: Ca2+; Mfn2; interorganellar communication; mitochondria; tethering.


Conflict of interest statement

The authors declare no conflict of interest.

Figures

Fig. 1.
Fig. 1.
Mfn2 ablation increases ER–mitochondria distance. (A) Representative EM images of MEFs of the indicated genotype. Where indicated, Mfn2−/− MEFs were cotransfected with GFP and the indicated plasmid, sorted and processed for EM. (Scale bars, 500 nm.) (B) Mean ± SEM of mitochondria–ER distance calculated in five independent experiments as in A. *P < 0.05 vs. WT. (C) A cartoon of the ERMICC contact index. (D) Mean ± SEM of ERMICC calculated from five independent experiments performed as in A. *P < 0.05 vs. WT. (E) Representative confocal images of the ER–mitochondria ddGFP fluorescence in MEFs of the indicated genotype. (Scale bars, 30 μm.) (F) Dot plots of ddGFP fluorescence in cells of the indicated genotype cotransfected with ddGFP monomers and cytosolic dsRED. (Left) Scatterplots of the gated dsRED+ cells. (Right) ddGFP+ dsRED+ population. (G) Mean ± SEM of ddGFP+ events in MEFs of the indicated genotype in three independent experiments as in F. *P < 0.05 vs. WT. (H) Mean ± SEM of five independent experiments of FEMP measurement of ER–mitochondria contacts in MEFs of the indicated genotype. *P < 0.05 vs. WT.
Fig. S1.
Fig. S1.
Mfn2 ablation increases ER-mitochondria distance. (A) Representative EM images of MEFs of WT MEF and Mfn2 −/− cells. Boxes denotes 2.5× zoomed-in region. M, mitochondria. Organelles are marked using pseudocolored overlay masks. (Scale bars, 500 nm.) (B) Morphometric analysis of ER located at less than 20 nm from mitochondria calculated from 70 images per condition with >5 mitochondria per image. Data represent mean ± SEM of three independent experiments. *P < 0.05 vs. WT. (C) Quantification of ERMICC of ER located at 20-nm maximum distance from mitochondria. Data represent mean ± SEM of three independent experiments (n = 350 mitochondria per experiment). *P < 0.05 vs. WT.
Fig. S2.
Fig. S2.
FEMP probe measures proximity between the ER and mitochondria. (A) Schematic of the modified FEMP probe targeted to the mitochondrial outer membrane and ER. A self-cleaving Tav2A peptide was inserted following YFP sequence. Following translation, the peptide undergoes autocleavage and releases YFP and CFP, which are targeted to the mitochondria and ER by Akap1 and Sac1 targeting sequences, respectively. (B) Representative confocal images of the FEMP probe localized to mitochondria (Upper, yellow) and ER (Lower, cyan). (Scale bar: 10 μm.) (C) Time-lapse imaging of WT MEFs expressing FEMP probe. Where indicated, cells were treated with 100 nM Rapamycin. Black trace, calculated YFP/CFP FRET intensity. (D) FEMP measurement of ER–mitochondria contacts in WT and Mfn2−/− cells at indicated confluency.
Fig. 2.
Fig. 2.
Acute Mfn2 ablation increases ER–mitochondria distance. (A) Data represent mean ± SEM of FEMP measurement of ER–mitochondria contacts from nine independent experiments where WT MEFs were transduced with the indicated shRNA lentiviral particles for 24 h (two different shRNAs were used for Mfn2 and PACS2), transfected with FEMP, and imaged. *P < 0.05 vs. scramble (scr). (B) Volume-rendered 3D reconstructions of confocal z-stacks of mitochondria (Top, mtYFP, pseudocolored in green), ER (Middle, red), and merged images (Bottom) in Mfn2flx/flx MEFs infected with mtYFP or CRE-2A-mtYFP (CRE) adenoviruses. 24 h after infection cells were transfected ER-dsRED (pseudocolored in red) and, after an additional 24 h, imaged. (Scale bars, 30 µm.) (C) Data represent mean ± SEM of analysis of ER–mitochondria interaction in 10 independent experiments (n = 10 cells per experiment) performed as in B. *P < 0.05 vs. mtYFP. (D) Flow cytometry analysis of ddGFP fluorescence in Mfn2flx/flx MEFs. Cells were infected pLV-CMV (EV) or with pLV-CMV-NLSCRE (CRE) lentiviruses, cotransfected after 48 h with ddGFP monomers and cytosolic dsRED and 24 h later analyzed by flow cytometry. (Left) Scatterplots of the gated dsRED+ cells. (Right) GFP+ dsRED+ population. (E) Data represent mean ± SEM of ddGFP+ events in Mfn2flx/flx MEFs infected as indicated from three independent experiments as in D. *P < 0.05 vs. EV. (F) Representative EM images of Mfn2flx/flx MEFs infected for 48 h with mtYFP or CRE-2A-mtYFP (CRE) adenoviruses. Boxed areas are magnified 3× (Right). (Scale bars, 500 nm.) (G) Mean ± SEM of mitochondria–ER distance calculated in three independent experiments as in F. *P < 0.05 vs. mtYFP. (H) Mean ± SEM. ERMICC calculated from three independent experiments performed as in G. *P < 0.05 vs. mtYFP.
Fig. S3.
Fig. S3.
Acute Mfn2 ablation increases ER–mitochondria distance and decreases ER–mitochondria contacts. (A) Morphometric analysis of ER located at less than 30 nm from mitochondria calculated from 70 images per condition, with >5 mitochondria per image in Mfn2flx/flx MEFs infected with AAV-CMV-mtYFP (mtYFP) or AAV-CMV-CRE-2A mtYFP (CRE) adenoviruses. Data represent mean ± SEM of three independent experiments performed as in Fig. 2F. *P < 0.05 vs. mtYFP. (B) Data represent mean ± SEM of ERMICC calculated from three independent experiments performed as in A. *P < 0.05 vs. mtYFP.
Fig. 3.
Fig. 3.
Mfn2 ablation decreases mitochondrial Ca2+ uptake in situ but not in vitro. (A) Mean ± SEM of peak cytosolic Ca2+ concentrations ([Ca2+]i) in response to ATP (0.2 mM) in Ca2+-free Krebbs Ringer buffer (KRB) from in three independent experiments (n = 10 recordings per experiment) where Mfn2flx/flx MEFs were infected with mtYFP or CRE-2A-mtYFP (CRE) adenoviruses and after 48 h transfected with cytAEQ. *P < 0.05 vs. mtYFP. (B) Mean ± SEM of mitochondrial Ca2+ ([Ca2+]mit) in Ca2+-free KRB from in three independent experiments (n = 10 recordings per experiment) where Mfn2flx/flx MEFs were infected with the indicated adenoviruses and after 48 h transfected with mtAEQ. Where indicated, cells were perfused with 0.2 mM ATP and with 0.2 mM ATP + 2 mM Ca2+. (C) Average ± SEM of peak [Ca2+]mit from in three independent experiments (n = 10 recordings per experiment) performed as in B. Where indicated, cells were perfused with (+Ca2+) or without (−Ca2+) extracellular Ca2+. *P < 0.05 vs. mtYFP. (D) Mean ± SEM of [Ca2+]i from three independent experiments (n = 10 recordings per experiment) where Mfn2flx/flx MEFs were infected with the indicated adenoviruses and after 48 h transfected with cytAEQ. Cre infected cells were incubated for 30 min in Ca2+ free media. Where indicated, cells were perfused with 0.2 mM ATP. (E) Average ± SEM of peak [Ca2+]i in three independent experiments performed as in D. (F) Experiments were performed as in D except that [Ca2+]mit was recorded in in Mfn2flx/flx MEFs infected with the indicated adenoviruses and after 48 h transfected with mtAEQ. (G) Average ± SEM of three independent peak [Ca2+]mit in experiments performed as in F. *P < 0.05 vs. the corresponding mtYFP bar. (H) Expanded scale of G. The Ca2+ uptake rate is indicated. (I) Control (WT) and liver-specific Mfn2 knockout mice (Mfn2LKO) mitochondria (0.5 mg/mL) were incubated in experimental buffer supplemented with 1 µM CaGreen-5N and 2 µM cyclosporine A. Where indicated, 50 µM Ca2+ pulses were added. (J) Expanded scale of I. (K) Average ± SEM of [Ca2+]mit uptake rate recorded from three couples of littermates as in I.
Fig. 4.
Fig. 4.
Mfn2 levels do not affect components of the mitochondrial Ca2+ uptake machinery. (A and B) Equal amounts (40 μg) of protein were separated by SDS/PAGE and immunoblotted using the indicated antibodies from Mfn2flx/flx MEFs infected with mtYFP andCRE-2A mtYFP (CRE) adenoviruses for 48 h. (C) Mean ± SEM of densitometric quantification of MCU, MICU1, and MICU2 protein levels in three independent experiments as in A. (D) RNAseq results for WT, cardiomyocyte-specific Mfn2 transgenic (Mfn2tg), and cardiomyocyte-directed Mfn2 knockout (Mfn2HKO) mouse hearts, expressed as read fragments per kilobase of exon per million reads mapped (FPKM). *P < 0.02 vs. WT (one-way ANOVA).
Fig. 5.
Fig. 5.
Mfn2 ablation impairs mitochondrial Ca2+ uptake in an MCU-independent manner. (A and B) Equal amounts (40 μg) of total lysates from cells of the indicated genotypes were separated by SDS/PAGE and immunoblotted using the indicated antibodies. (C) Mean ± SEM of densitometric quantification of levels of the indicated MCU holoplex components from 3 to 10 independent experiments as in A and B. (D) MEFs of the indicated genotype were infected where indicated with MCU expressing adenoviruses and, after 48 h, were lysed and equal amount of proteins (40 µg) separated by SDS/PAGE and immunoblotted with the indicated antibodies. (E) Recordings of [Ca2+]i in Ca2+-free KRB in cells of the indicated genotypes overexpressing MCU. Where indicated, MEFs were perfused with 0.2mM (WT) or 10 µM (Mfn2−/−) ATP. (F) Mean ± SEM of three independent experiments of peak [Ca2+]i from experiments performed as in E. (G) Recordings of [Ca2+]mit in experiments performed as in E. (H) Mean ± SEM of peak of [Ca2+]mit from three independent experiments performed as in G. *P < 0.05 vs. WT.
Fig. S4.
Fig. S4.
Mfn2 ablation in liver does not alter mitochondrial function and Ca2+ retaining capacity. (A) Respiratory control ratio (RCR) in isolated mitochondria from control (WT) and Mfn2 liver specific knockout (Mfn2LKO) mice energized using glutamate/malate (Glu-Mal) or Succinate (Succ). (B) Ca2+ retention capacity in isolated mitochondria of the indicated genotypes measured using 1 μM CaGreen-5N. Pulses of 50 μM Ca2+ were added until protein-tyrosine phosphatase PTP induction.
Fig. S5.
Fig. S5.
Tethering is influenced by cell confluency. (A and B) equal amounts (40 μg) of protein from HUVEC cells (A) or WT and Mfn2−/− MEF (B) at indicated confluency were separated by SDS/PAGE and immunoblotted using the indicated antibodies. (C) Densitometric quantification of MCU protein levels in WT and Mfn2−/− MEFs at indicated confluency. Experiments were as in B. Data represent mean ± SEM of three independent experiments.

Comment in

References

    1. Hamasaki M, et al. Autophagosomes form at ER-mitochondria contact sites. Nature. 2013;495(7441):389–393. - PubMed
    1. Muñoz JP, et al. Mfn2 modulates the UPR and mitochondrial function via repression of PERK. EMBO J. 2013;32(17):2348–2361. - PMC - PubMed
    1. Szalai G, Krishnamurthy R, Hajnóczky G. Apoptosis driven by IP(3)-linked mitochondrial calcium signals. EMBO J. 1999;18(22):6349–6361. - PMC - PubMed
    1. Rizzuto R, Brini M, Murgia M, Pozzan T. Microdomains with high Ca2+ close to IP3-sensitive channels that are sensed by neighboring mitochondria. Science. 1993;262(5134):744–747. - PubMed
    1. Rizzuto R, et al. Close contacts with the endoplasmic reticulum as determinants of mitochondrial Ca2+ responses. Science. 1998;280(5370):1763–1766. - PubMed

Publication types