. 2016 Oct 4;113(40):11348-11353.
doi: 10.1073/pnas.1613273113. Epub 2016 Sep 19.

Cellulose synthase complexes act in a concerted fashion to synthesize highly aggregated cellulose in secondary cell walls of plants

Affiliations

Cellulose synthase complexes act in a concerted fashion to synthesize highly aggregated cellulose in secondary cell walls of plants

Shundai Li et al. Proc Natl Acad Sci U S A. .

Abstract

Cellulose, often touted as the most abundant biopolymer on Earth, is a critical component of the plant cell wall and is synthesized by plasma membrane-spanning cellulose synthase (CESA) enzymes, which in plants are organized into rosette-like CESA complexes (CSCs). Plants construct two types of cell walls, primary cell walls (PCWs) and secondary cell walls (SCWs), which differ in composition, structure, and purpose. Cellulose in PCWs and SCWs is chemically identical but has different physical characteristics. During PCW synthesis, multiple dispersed CSCs move along a shared linear track in opposing directions while synthesizing cellulose microfibrils with low aggregation. In contrast, during SCW synthesis, we observed swaths of densely arranged CSCs that moved in the same direction along tracks while synthesizing cellulose microfibrils that became highly aggregated. Our data support a model in which distinct spatiotemporal features of active CSCs during PCW and SCW synthesis contribute to the formation of cellulose with distinct structure and organization in PCWs and SCWs of Arabidopsis thaliana This study provides a foundation for understanding differences in the formation, structure, and organization of cellulose in PCWs and SCWs.

Keywords: cellulose microfibrils; cellulose synthase complex; live-cell imaging; plasma membrane; protein dynamics.


Conflict of interest statement

The authors declare no conflict of interest.

Figures
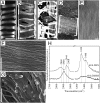
Fig. 1.
Fig. 1.
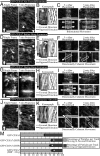
SCWs of transdifferentiated xylem cells exhibit highly aggregated, bundled cellulose microfibrils and exhibit spectral characteristics that are similar to native SCWs. (AG) 35S::VND7-GR seedlings were treated for 60 h with 20 μM DEX to induce transdifferentiation (AD and G) or an equal volume of the solvent, dimethyl sulfoxide (DMSO), as a nontransdifferentiation control (E and F). White brackets denote autofluorescent lignified SCW thickenings in a confocal image (A). Black brackets denote SCW thickenings in FE-SEM images of intact transdifferentiated cells of an epidermal peel (B and C). White brackets denote SCW thickenings at the inner surface of transdifferentiated cells that were broken open with a focused ion beam (C and D). The asterisked arrowhead in C indicates the region magnified in D. Cellulose microfibrils of PCWs at the inner surface of DMSO control, nontransdifferentiated epidermal cells are less bundled (E and F) than those of SCWs in transdifferentiated cells (D and G). (Scale bars: AC, 10 μm; DG, 200 nm.) (H) Representative SFG spectra from DMSO control, nontransdifferentiated (black) and DEX-treated, transdifferentiated (gray) seedlings.
Fig. 2.
Fig. 2.
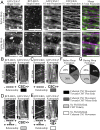
Active CSCs exhibit bidirectional movement along tracks during PCW synthesis and directionally coherent movement along tracks during SCW synthesis. (AL) GFP-CESA3 cesa3je5 was imaged in nontransdifferentiating cells as a CSC marker during PCW synthesis (AC), and GFP-CESA7 cesa7irx3-1 35S::VND7-GR was imaged during two stages of xylem cell transdifferentiation, before hoop formation (BHF) and during hoop formation (DHF), as a CSC marker during SCW synthesis (DL). (JL) The influence of CMTs on GFP-CESA7 particle behavior was assessed via 8–12 h treatment with 25 μM oryzalin. (A, D, G, and J) Representative single-frame images and 7-min projection images show the distribution and trajectories of GFP-CESA particles, respectively. Arrows indicate the apical direction. (Scale bars: 10 μm.) (B, E, H, and K) Kymographs were derived from the indicated tracks in each 7-min projection image and the directions of particle movements along the track were color-coded in schematic kymographs. (Scale bars: 5 μm.) (C, F, I, and L) Images from 5 s and 5 min after photobleaching the lateral sides of cells are shown to depict the direction of particle movement along tracks of interest. Upper images are raw images, and lower images are highlighted to show the bleached regions (gray boxes), the particles within tracks of interest (white boxes), and the favored direction of particle movements (arrows). (Scale bars: 10 μm.) The frequency of particle direction along individual tracks was quantified (M). Error bars are standard errors of the mean; n ≥ 48 tracks and 6 seedlings per data point. *P < 0.0001.
Fig. S1.
Fig. S1.
ProCESA7::GFP-CESA7 rescues the cesa7irx3-1 growth phenotype and GFP-CESA7 signal localizes to similar populations as previously visualized PCW CESA markers such as GFP-CESA3. (A) Adult WT (Col-0 ecotype), ProCESA7::GFP-CESA7 cesa7irx3-1, and cesa7irx3-1 plants revealed that ProCESA7::GFP-CESA7 rescued the cesa7irx3-1 growth phenotype. (Scale bar: 5 cm.) (BD) ProCESA3::GFP-CESA3 cesa3je5 was imaged in nontransdifferentiating cells as a CSC marker during PCW synthesis (B), and ProCESA7::GFP-CESA7 cesa7irx3-1 35S::VND7-GR was imaged during two stages of xylem cell transdifferentiation, before hoop formation and during hoop formation, as a CSC marker during SCW synthesis (C and D). Single-frame images and 5-min projection images show the distribution and trajectories of GFP-CESA particles, respectively (BD). Three arrowheads denote diffraction-limited PM-localized CSC particles and octagons denote GFP-CESA signal in globular, intracellular Golgi bodies (BD). PM-localized GFP-CESA7 often localized to swaths of signal in addition to well-defined puncta that are commonly seen in PCW CSCs such as GFP-CESA3. Arrows indicate the apical direction. (Scale bars: 10 μm.)
Fig. S2.
Fig. S2.
The distribution of GFP-CESA7 particle velocities in transdifferentiating cells during SCW synthesis is not drastically different from that of markers of CSCs during PCW synthesis. The velocities of CSC particles were quantified for the 11 CSC markers during PCW synthesis including GFP-CESA3 cesa3je5, GFP-CESA3 cesa3je5 RFP-TUA5, mCherry-CESA3 cesa3je5, GFP-CESA5, GFP-CESA6 cesa6prc1-1, YFP-CESA6 cesa6prc1-1 RFP-TUA5, mCherry-CESA6 cesa6prc1-1, GFP-CSI1 csi1-3, GFP-CSI3 csi3-1, RFP-CSI1 csi1-6, and GFP-KOR1 kor1-3 (gray). The velocities of GFP-CESA7–labeled CSCs were quantified during SCW synthesis before hoop formation (BHF), during hoop formation (DHF), and under oryzalin treatment (8–12 h; 25 μM) before hoop formation (BHF + Ory) (white). The line within each box represents the mean. The bottom and top of each box represents the first and third quartile, respectively. The error bars represent the SD of the mean; n > 5,700 particles from ≥5 seedlings for each data point.
Fig. S3.
Fig. S3.
The direction of coherent CSC movement is not correlated with the polarity of the CMTs along which the CSCs are moving. (A) In transdifferentiating cells, GFP-CESA7–labeled PM-localized CSCs traveled along trajectories that coincided with the trajectories of RFP-EB1b particles, which label the plus-ends of polymerizing microtubules, both before and during hoop formation. (Scale bars: 10 μm.) (BE) Kymograph analysis displays the direction of EB1b particle movement, from which the polarity of new microtubules can be deduced, and the direction of CSC particle movements from four representative tracks. (Scale bars: 5 μm.) The direction of coherent CSC movement was occasionally toward the plus-ends of newly synthesized CMTs (B) or toward the minus-ends of newly synthesized CMTs (C). Some tracks did not exhibit a dominant CMT polarity (D and E) or coherent CSC movement (E). The relationship between the direction of coherent CSC movement and the polarity of newly synthesized CMTs was quantified before and during hoop formation (F and G). N is 56 tracks from 7 seedlings for each pie chart.
Fig. S4.
Fig. S4.
Treatment with 25-μM oryzalin for 8–12 h disrupts CMTs. (A) Motile RFP-EB1b particles demarcate newly polymerized CMTs in mock-treated seedlings. (B) RFP-EB1b no longer localizes to particles at the cell cortex in oryzalin-treated seedlings but rather displays a faint cytosolic signal, which suggests that CMT polymerization is abolished. (C and D) GFP-MAP4 localizes to CMTs in mock-treated seedlings (C) but is diffusely distributed throughout the cytosol in oryzalin-treated seedlings, which suggests that CMTs have depolymerized (D). (Scale bars: 10 μm.)
Fig. 3.
Fig. 3.
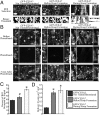
CSCs are densely distributed within hoop regions during SCW synthesis, and CSC delivery to the PM occurs at an elevated rate during SCW synthesis compared with PCW synthesis. (A) ROIs (white shapes) that exclusively contain signal from PM-localized CSCs display areas occupied by signal in white from images of GFP-CESA3 during PCW synthesis (Left) and GFP-CESA7 during SCW synthesis both before (Center) and during (Right) hoop formation. (B) The delivery of CSCs to the PM was visualized by photobleaching a ROI (gray box) and recording the repopulation of PM CSCs within the bleached region. Time points preceding the bleach (Upper), immediately following the bleach (Middle), and 5 min after the bleach (Lower) are shown. Arrows denote the apical direction (A and B). (Scale bars: 10 μm.) (C) The percentage of area of ROIs occupied by signal was quantified. Error bars are SEM; n ≥ 28 ROIs from ≥7 cells per data point. #P = 0.028; *P < 0.0001. (D) The rate of delivery of CSCs to the PM was quantified from photobleaching experiments. Error bars are standard errors of the mean; n ≥ 7 cells per data point. *P < 0.0001.
Fig. 4.
Fig. 4.
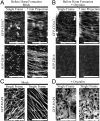
The concerted activity of densely arranged and coherently moving CSCs is responsible for the synthesis of highly aggregated cellulose microfibrils during SCW production in transdifferentiating xylem cells. The model displays a schematic aerial view of cellulose synthesis during PCW synthesis (A and B) and during SCW synthesis before hoop formation (SCW - BHF) (C and E) and during hoop formation (SCW - DHF) (D and E) in transdifferentiating xylem cells. Green CSCs represent active CSCs, which travel along brown CMTs. Yellow CSCs represent newly delivered CSCs to emphasize the differences in delivery rate of CSCs during PCW and SCW synthesis. During PCW synthesis, relatively low rates of CSC delivery maintain a disperse distribution of CSC particles at the PM that exhibit bidirectional movement along CMTs during cellulose synthesis (A). The uncoordinated activity of primary CSCs produces cellulose microfibrils with low aggregation in PCWs (B). During SCW synthesis in transdifferentiating xylem cells, high rates of CSC delivery cause the crowding of swaths of active CSCs at the PM that move coherently in a common direction both before (C) and during (D) hoop formation. The concerted activity of groups of coherently moving CSCs causes the formation of the highly aggregated cellulose microfibrils of SCWs (E). During hoop formation, CMTs and CSCs become condensed and restricted to confined regions of the PM (D) to accommodate the synthesis of cellulose within SCW thickenings (E). (Scale bars: 200 nm.)

Similar articles

Cited by

References

    1. Cosgrove DJ. Growth of the plant cell wall. Nat Rev Mol Cell Biol. 2005;6(11):850–861. - PubMed
    1. Cosgrove DJ, Jarvis MC. Comparative structure and biomechanics of plant primary and secondary cell walls. Front Plant Sci. 2012;3:204. - PMC - PubMed
    1. Kumar M, Campbell L, Turner S. Secondary cell walls: Biosynthesis and manipulation. J Exp Bot. 2016;67(2):515–531. - PubMed
    1. Pauly M, Keegstra K. Biosynthesis of the plant cell wall matrix polysaccharide xyloglucan. Annu Rev Plant Biol. 2016;67:235–259. - PubMed
    1. Anderson CT. We be jammin’: An update on pectin biosynthesis, trafficking and dynamics. J Exp Bot. 2016;67(2):495–502. - PubMed

Publication types

MeSH terms