. 2016 Oct 4;113(40):E5952-E5961.
doi: 10.1073/pnas.1612579113. Epub 2016 Sep 19.

Cell cycle progression in Caulobacter requires a nucleoid-associated protein with high AT sequence recognition

Affiliations

Cell cycle progression in Caulobacter requires a nucleoid-associated protein with high AT sequence recognition

Dante P Ricci et al. Proc Natl Acad Sci U S A. .

Abstract

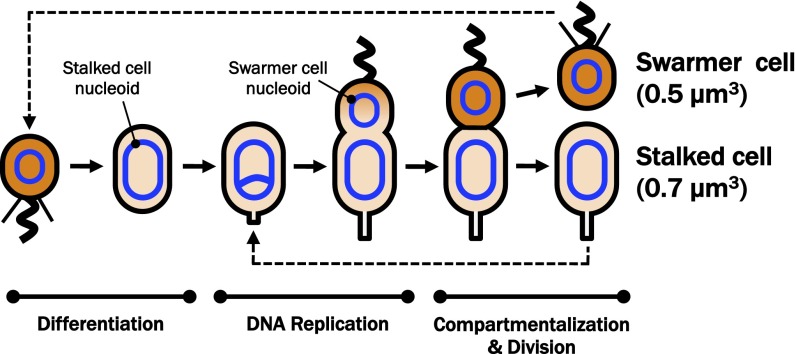
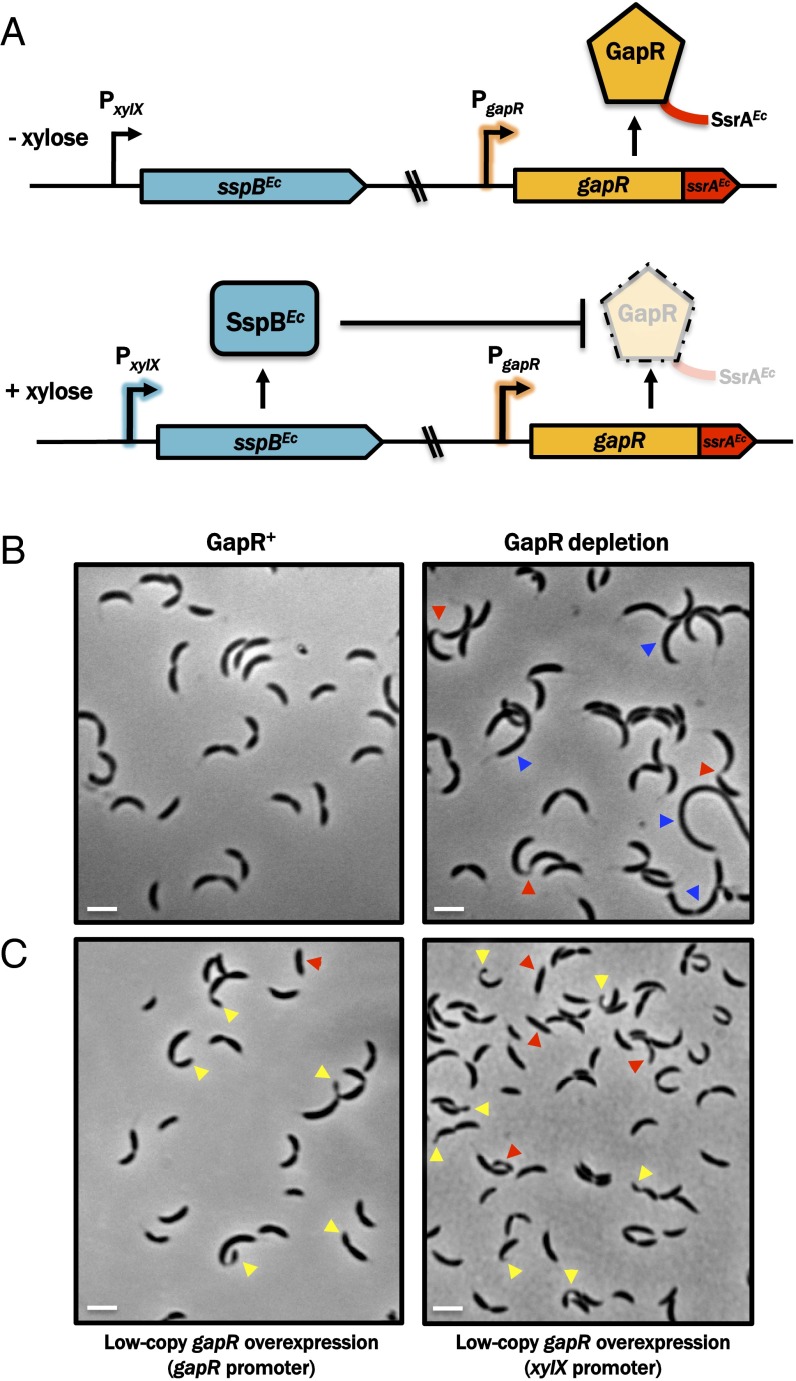
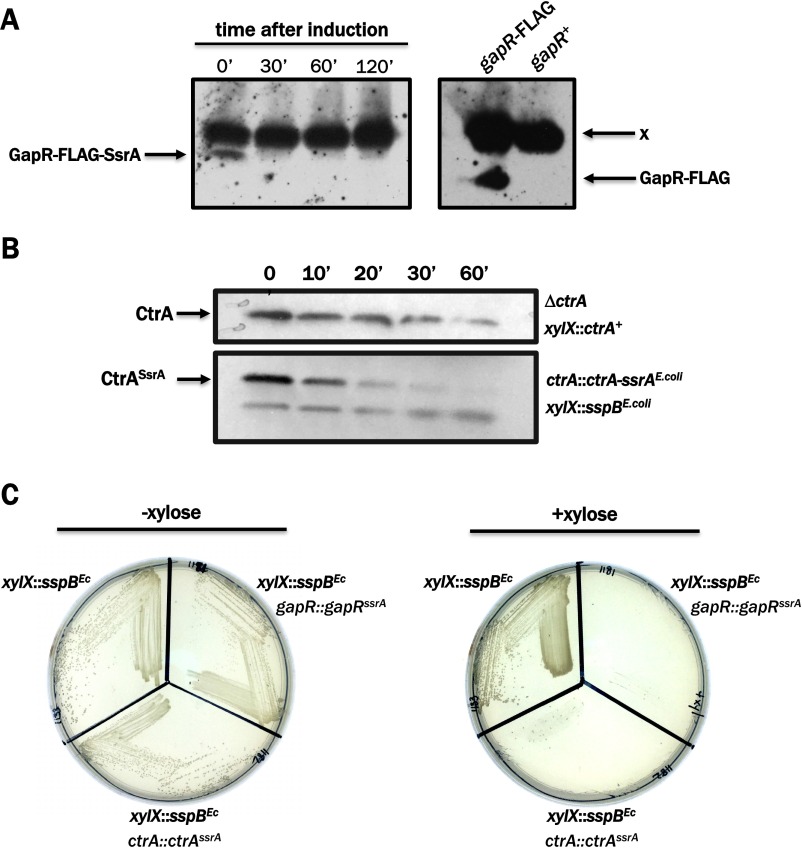
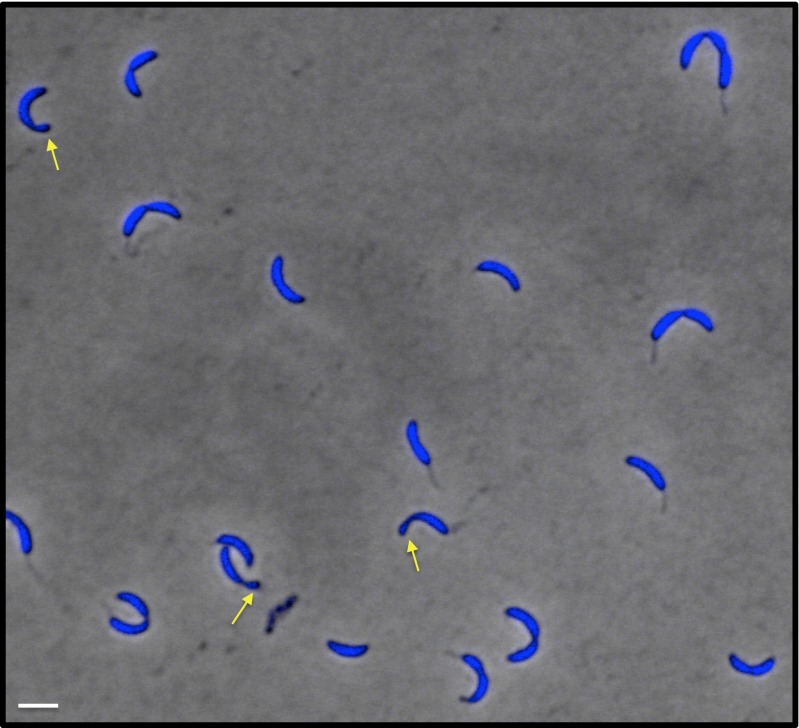
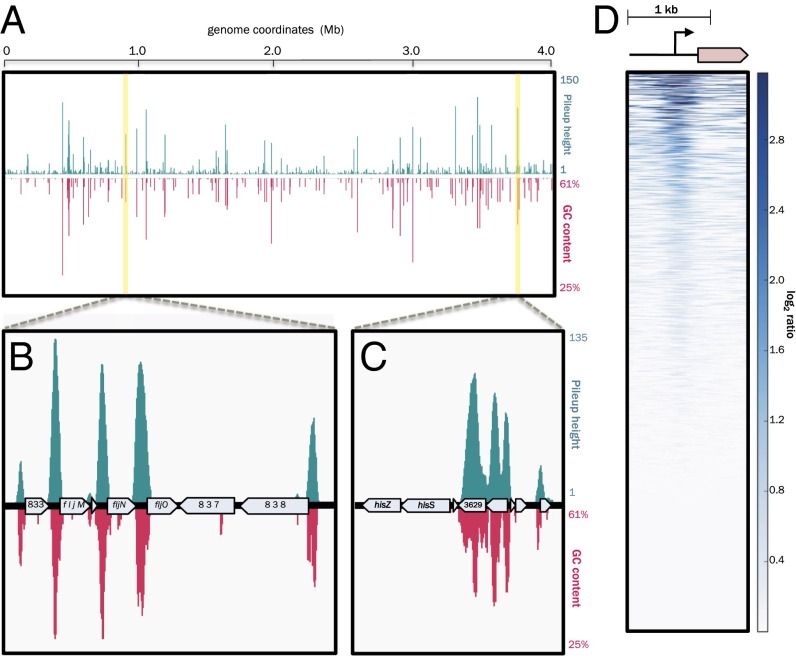
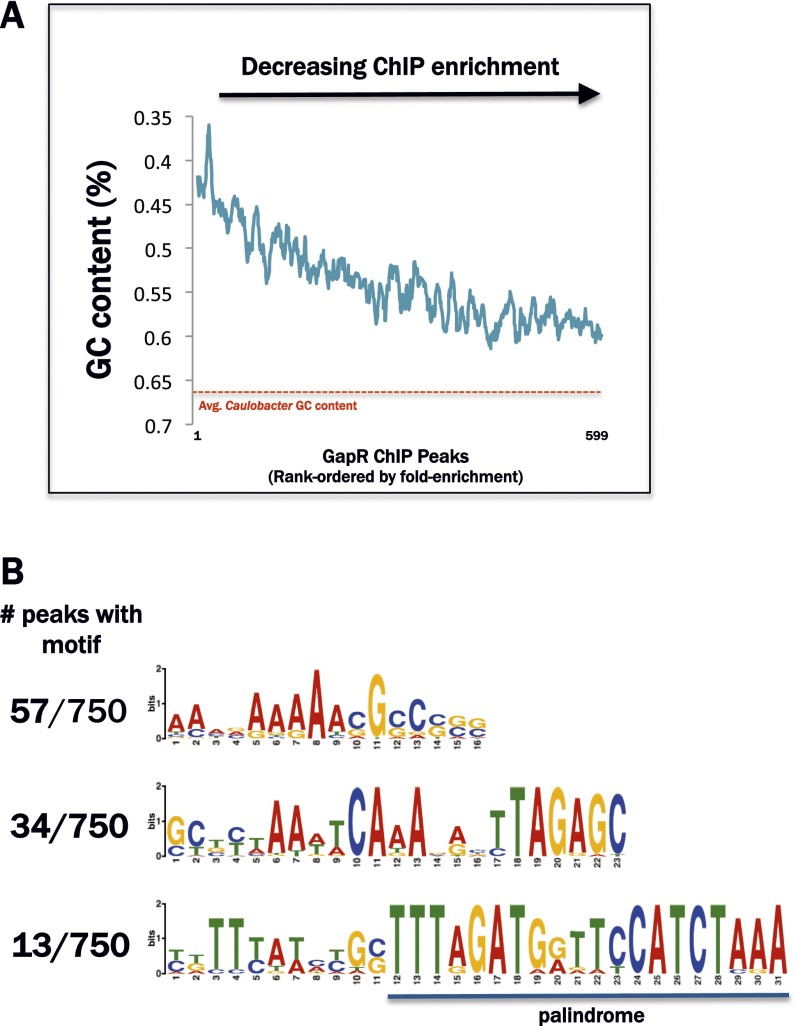
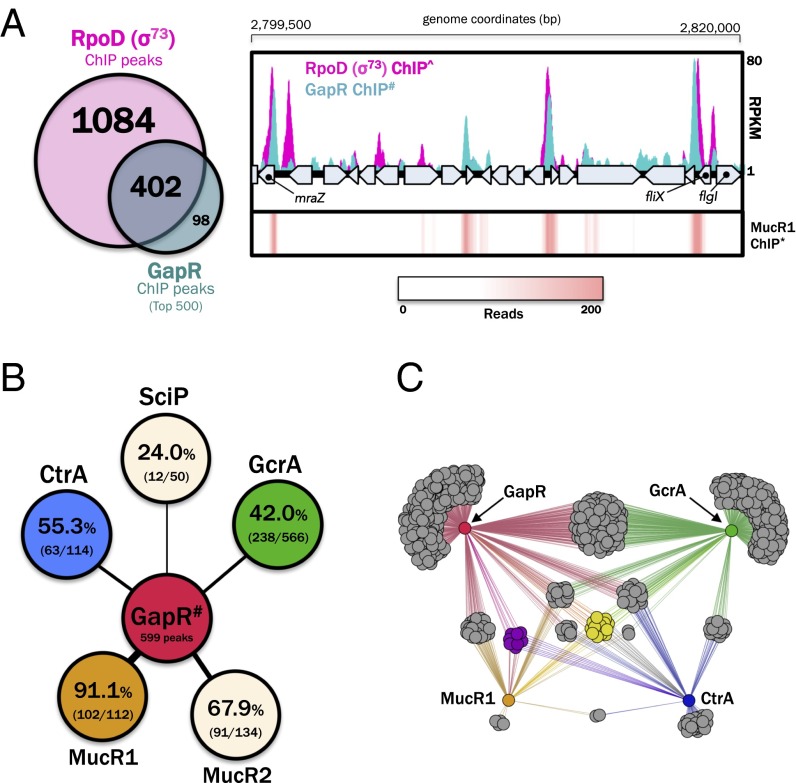
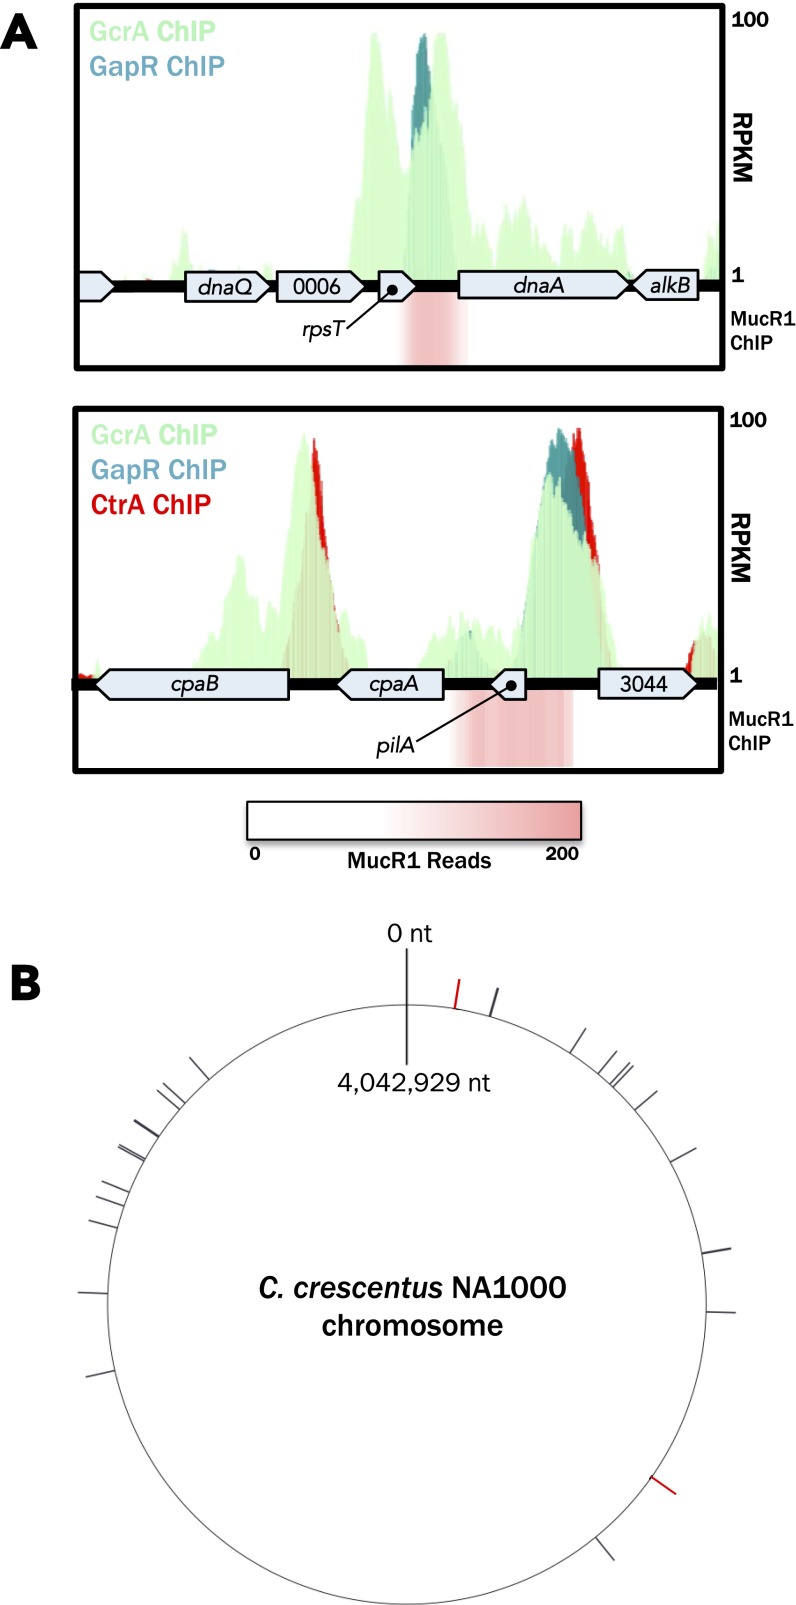
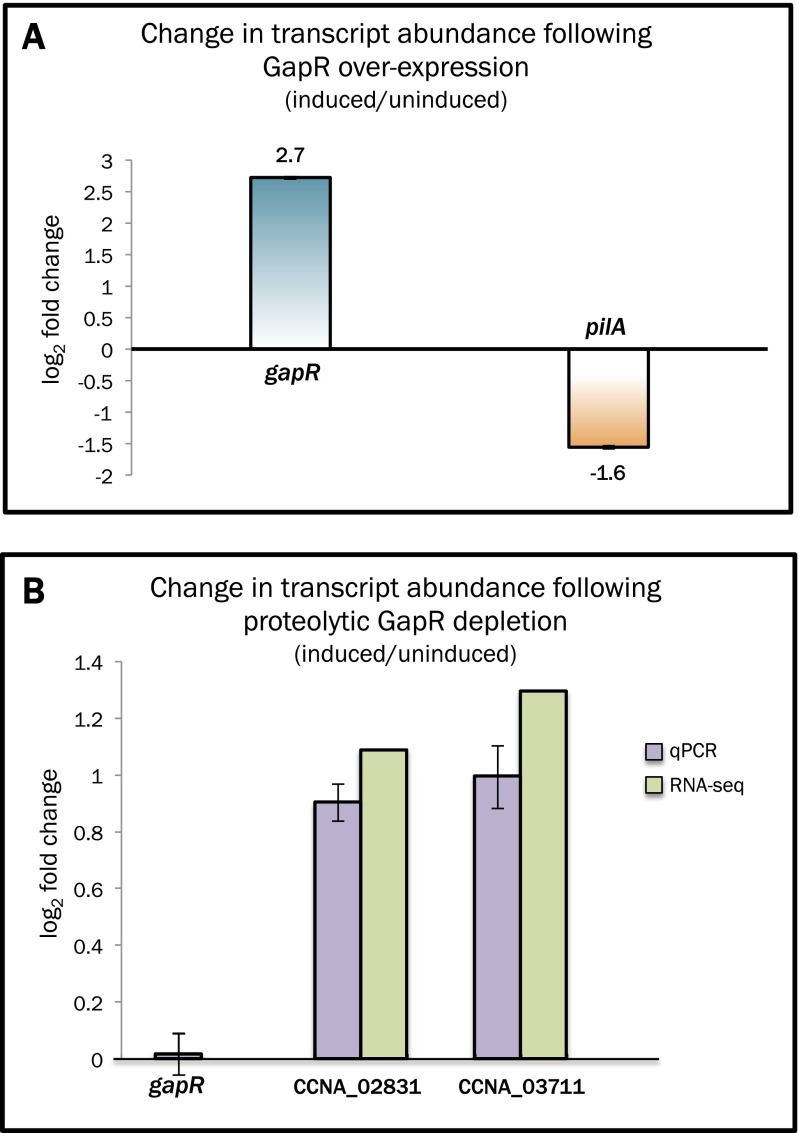
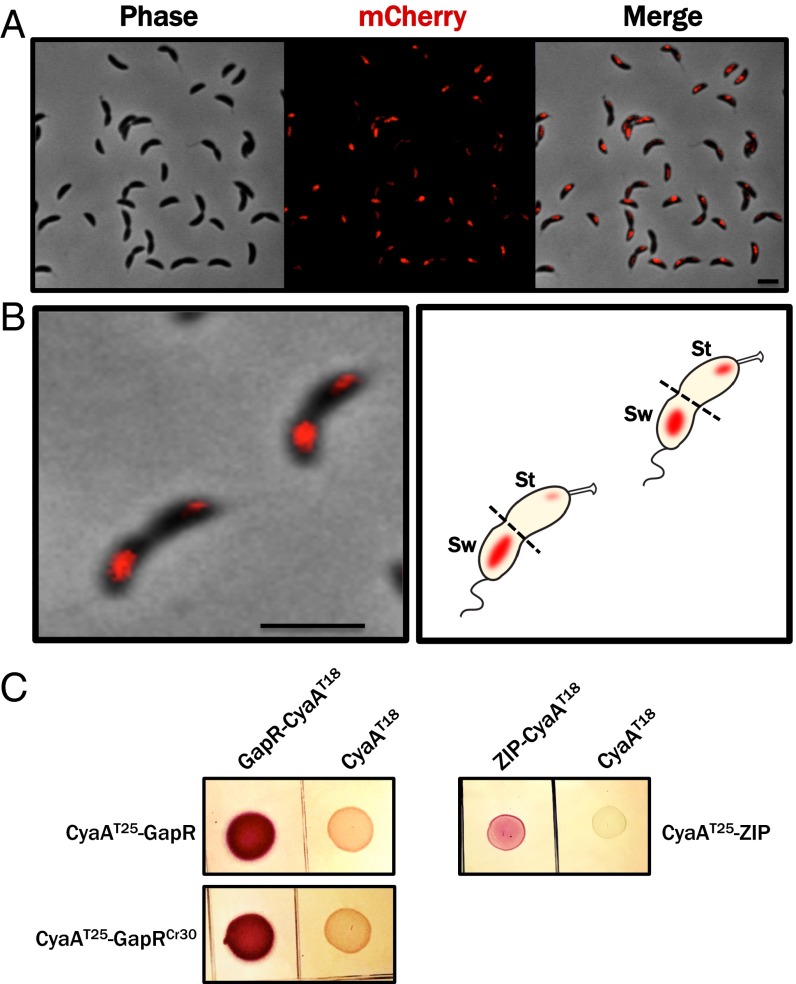
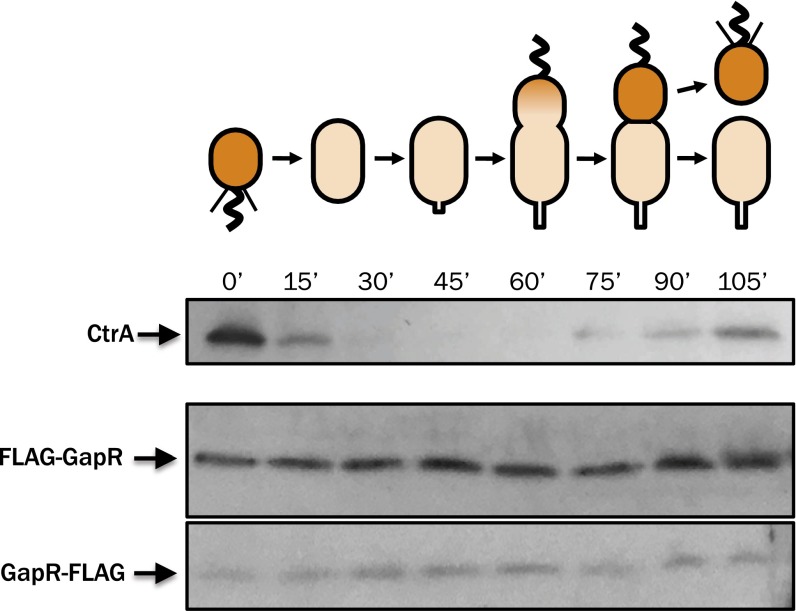
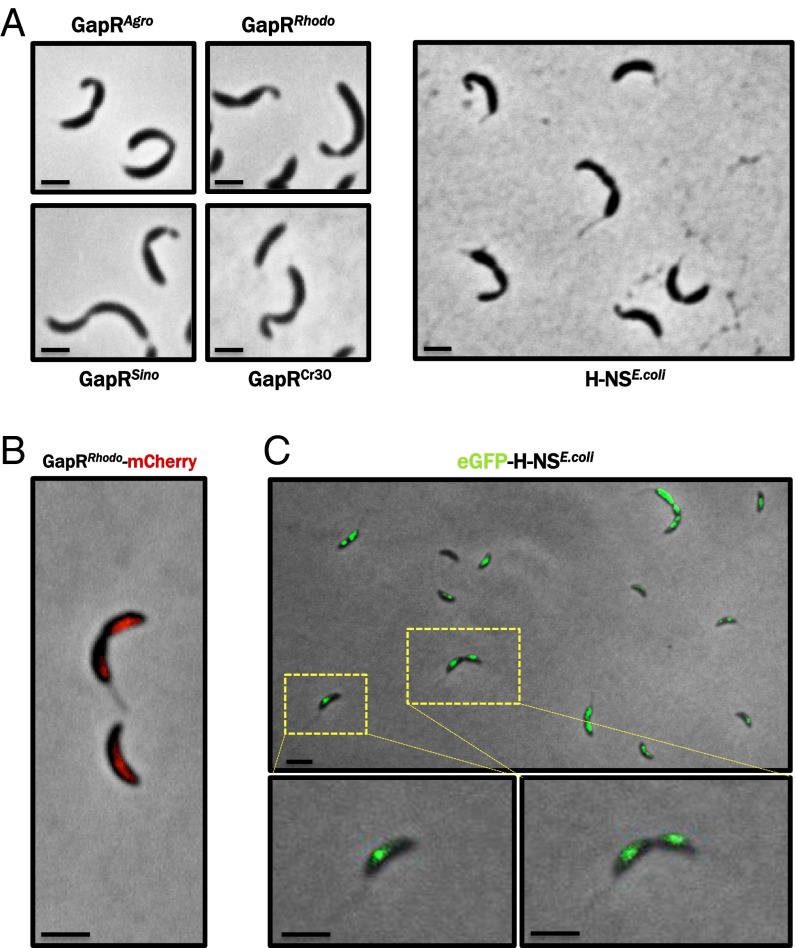
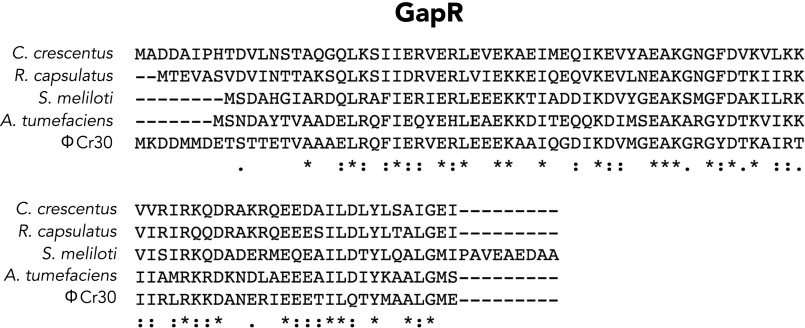
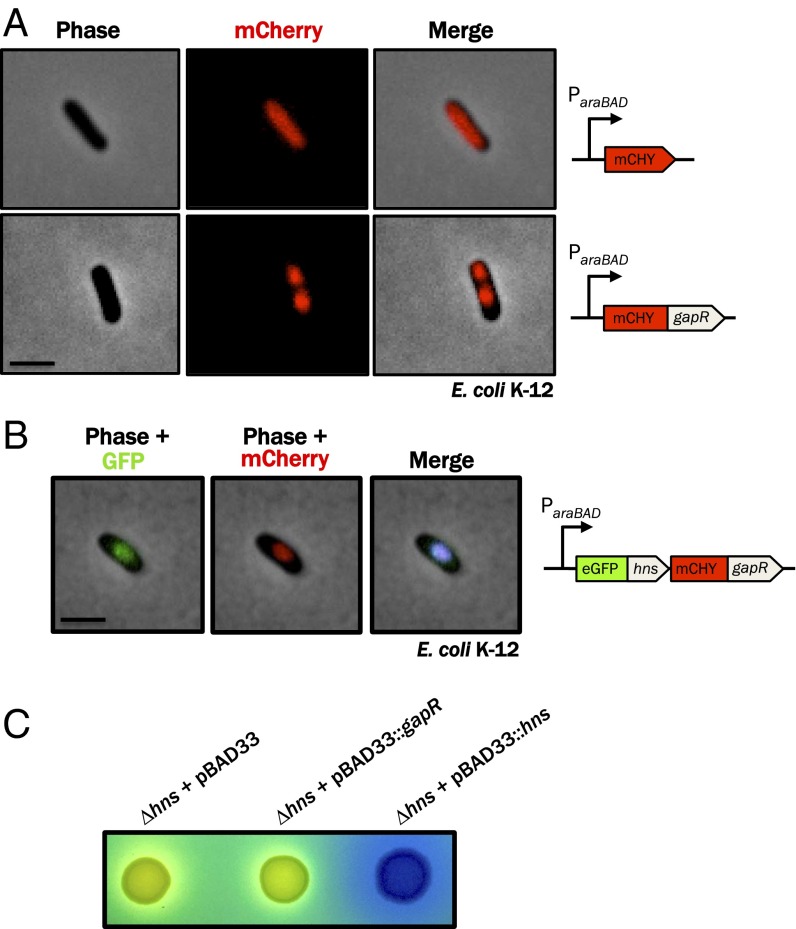
Faithful cell cycle progression in the dimorphic bacterium Caulobacter crescentus requires spatiotemporal regulation of gene expression and cell pole differentiation. We discovered an essential DNA-associated protein, GapR, that is required for Caulobacter growth and asymmetric division. GapR interacts with adenine and thymine (AT)-rich chromosomal loci, associates with the promoter regions of cell cycle-regulated genes, and shares hundreds of recognition sites in common with known master regulators of cell cycle-dependent gene expression. GapR target loci are especially enriched in binding sites for the transcription factors GcrA and CtrA and overlap with nearly all of the binding sites for MucR1, a regulator that controls the establishment of swarmer cell fate. Despite constitutive synthesis, GapR accumulates preferentially in the swarmer compartment of the predivisional cell. Homologs of GapR, which are ubiquitous among the α-proteobacteria and are encoded on multiple bacteriophage genomes, also accumulate in the predivisional cell swarmer compartment when expressed in Caulobacter The Escherichia coli nucleoid-associated protein H-NS, like GapR, selectively associates with AT-rich DNA, yet it does not localize preferentially to the swarmer compartment when expressed exogenously in Caulobacter, suggesting that recognition of AT-rich DNA is not sufficient for the asymmetric accumulation of GapR. Further, GapR does not silence the expression of H-NS target genes when expressed in E. coli, suggesting that GapR and H-NS have distinct functions. We propose that Caulobacter has co-opted a nucleoid-associated protein with high AT recognition to serve as a mediator of cell cycle progression.

Keywords: AT-rich; Caulobacter; asymmetry; cell cycle; nucleoid-associated protein.


Conflict of interest statement

The authors declare no conflict of interest.

Figures

Fig. 1.
Fig. 1.
The C. crescentus cell cycle. Caulobacter exists as one of two independent morphotypes, the swarmer cell and stalked cell, which are differently sized and which have distinct polar appendages. The swarmer cell is unable to initiate chromosome replication and does not grow or divide. Following differentiation, the stalked cell initiates DNA replication and segregation of DNA. As the cell cycle progresses, an asymmetric predivisional cell arises that elaborates a flagellum at the nascent swarmer cell pole, which forms opposite the stalked pole. Completion of chromosome segregation is followed by the compartmentalization of a small swarmer and large stalked cell cytoplasmic space and ultimately by complete cytokinesis. Each asymmetric division event yields two cells with identical genomes but significantly different cytoplasmic volumes into which those genomes must be packaged.
Fig. 2.
Fig. 2.
Depletion and overexpression of GapR cause morphological defects. (A) Schematic of the E. coli SsrA/SspB-based inducible proteolysis system co-opted for the specific degradation of GapR in Caulobacter, which is tagged with an SspB-dependent E. coli SsrA tag (SsrAEc) and expressed at the native genomic locus to preserve native levels and regulation. In the absence of xylose, the xylX promoter is inactive and sspB is not expressed. Addition of xylose leads to production of E. coli SspB (SspBEc), which promotes ClpXP-dependent proteolysis of SsrAEc-tagged GapR. (B) The GapR proteolytic depletion strain described in A was grown to midexponential phase in M2G and then propagated for an additional 2 h in the absence (permissive condition; Left) or presence (depletion condition; Right) of 0.3% (wt/vol) xylose. GapR-depleted cells exhibit incomplete separation (red arrowheads) and filamentation (blue arrowheads). (Scale bar, 1 μm.) (C) gapR was overexpressed in WT Caulobacter NA1000 on low-copy plasmids constitutively from the native promoter (Left) or for 4 h from the xylose-inducible xylX promoter [0.3% (wt/vol) xylose; Right]. GapR overexpression leads to morphological defects (red arrowheads) and aberrant division events (yellow arrowheads). (Scale bar, 1 μm.)
Fig. S1.
Fig. S1.
The E. coli SsrA/SspB system promotes efficient clearance of tagged proteins in Caulobacter. (A) A Caulobacter strain carrying xylose-inducible sspBEc and expressing SsrA-tagged GapR-FLAG was grown to midexponential phase in M2G and then grown in the presence of 0.3% xylose with samples collected for SDS/PAGE at 30, 60, and 120 min following the initiation of depletion. Western blotting was performed using α-FLAG polyclonal antisera. “x” indicates an endogenous protein that cross-reacts with the antisera used and represents a convenient loading control. (B) Kinetic comparison of a conventional gene depletion method with the SsrA/SspB proteolytic depletion method. A Caulobacter strain expressing the sole allele of ctrA from the xylX promoter (Top) was grown to midexponential phase in M2+xylose (permissive condition), washed and resuspended in M2G (depletion condition), and then incubated for 60 min. Additionally, a Caulobacter strain carrying xylose-inducible sspBEc and expressing SsrA-tagged CtrA from the native ctrA promoter (Bottom) was grown to midexponential phase in M2G (permissive condition) and then incubated for 60 min following the addition of 0.3% xylose (depletion condition). In both cases, samples were collected for SDS/PAGE at 10, 20, 30, and 60 min following the initiation of depletion, and Western blotting was performed using α-CtrA antisera. (C) Caulobacter strains carrying xylose-inducible sspBEc and expressing SsrA-tagged GapR, SsrA-tagged CtrA, or no tagged protein were grown in rich media (PYE) in the absence (Left) or presence (Right) of 0.3% xylose.
Fig. S2.
Fig. S2.
Polar minicells induced by GapR depletion contain DNA. The GapR proteolytic depletion strain was grown to midexponential phase in M2G, propagated for 4 h in the presence of 0.3% xylose, stained with DAPI, and imaged by phase-contrast and epifluorescence microscopy. Small minicells periodically observed at the new poles GapR-depleted cells exhibit incomplete separation (yellow arrows). (Scale bar, 1 μm.)
Fig. 3.
Fig. 3.
GapR binds globally to AT-rich regions of the Caulobacter genome. (A) Genome-wide FLAG-GapR ChIP-seq profile (blue peaks) with read counts normalized to reads per kilobase per million (RPKM) plotted against local GC content (magenta peaks) as calculated using a 100-bp sliding window across the NA1000 genome. Regions highlighted in yellow are featured in greater detail to reveal intergenic (B) and intragenic (C) GapR ChIP-seq enrichment. Seventy-six percent of the top 200 GapR ChIP-seq peak summits lie within intergenic regions. (D) Enrichment of GapR peaks in promoter regions. Each row in the heatmap represents a Caulobacter ORF (stretched or compressed to 750 bp and oriented as shown in the gene cartoon above the plot such that the start codon occupies the same position in each row), as well as the 1,000 bp preceding the translation start site of each ORF (not stretched or compressed). Rows were subdivided into 10-bp bins, with each bin colored to reflect the degree of GapR ChIP-seq signal enrichment (bluer color = greater GapR enrichment). Finally, rows were sorted by maximum bin value (log2 of GapR ChIP-seq signal enrichment) from highest (Top) to lowest (Bottom). Heatmaps were generated using deepTools (SI Materials and Methods).
Fig. S3.
Fig. S3.
GapR associates nonspecifically with AT-rich loci in the Caulobacter genome. (A) Line graph of GC content surrounding GapR ChIP-seq peak summits. All called GapR ChIP-seq peaks (q-value < 0.0001) were rank ordered by relative enrichment above background and sliding window averages in GC content (10-bp window size) of the 100-bp region centered on each corresponding peak summit were plotted. The red dashed line indicates the average GC content of the Caulobacter genome. (B) Position weight matrices (PWMs) of top hits from MEME-based motif analysis of GapR ChIP-seq peaks. For each PWM, a fraction is given that corresponds to the number of GapR peaks containing at least one occurrence of the associated motif.
Fig. 4.
Fig. 4.
GapR binds at active promoters controlled by master regulators of cell cycle progression. (A) Overlap between the top 500 FLAG-GapR ChIP-seq peaks and all RpoD ChIP-seq peaks (Left), with a specific genomic region featured (Right) to indicate the presence of shared binding sites between RpoD, GapR, and MucR1 (RpoD ChIP data obtained from ref. ; MucR1 ChIP-seq data from ref. 12). MucR1 ChIP-seq signal is presented as a heatmap of piled reads. (B) ChIP-seq peak overlap between GapR and master transcriptional regulators bound to promoters of cell cycle-regulated genes. Percentages in the colored circles represent the proportion of ChIP-seq peaks for the indicated master regulator (e.g., CtrA and SciP) that intersect a GapR ChIP-seq peak (median peak width = 400 bp), with each fraction expressing the number of peaks that intersect a GapR binding site out of the total number of peaks identified for that TF. The length and thickness of the lines connecting the shapes reflect the degree of overlap in occupancy between GapR and the master TFs shown. MucR1/2 and SciP ChIP-seq data and peak calls were obtained from ref. ; GcrA ChIP-seq data were obtained from ref. and peaks were called using the same workflow used for GapR/CtrA (see SI Materials and Methods for details). (C) Network diagram of intergenic regions (gray, purple, and yellow nodes) associated with different proteins (red, green, blue, and orange nodes). Connections (lines) indicate the presence of a ChIP-seq peak connecting an intergenic region to one or more of the proteins. Intergenic regions are clustered with others that share the same combination of connections to given proteins. Three-way intersection of the three proteins MucR1, CtrA, and GapR is represented by two clusters of intergenic regions: the purple cluster (no GcrA peak associated) and the yellow cluster (GcrA peak also associated). The total number of observed three-way intersections in intergenic regions is greater than expected (under the assumption that ChIP-seq peaks of these three proteins are independently distributed over the chromosome; 21 observed vs. 11.2 expected; SI Materials and Methods). Genes associated with all of the chromosomal GapR-CtrA-MucR1 overlapping sites are listed in Table S2.
Fig. S4.
Fig. S4.
Overlap between the GapR ChIP-seq peaks and master regulator ChIP-seq peaks. (A) Specific genomic regions are shown to indicate the presence of shared binding sites between GapR, CtrA, and GcrA. MucR1 ChIP-seq signal is presented as a heatmap of piled reads. (B) A circular map of the Caulobacter NA1000 genome indicating the positions of all overlapping MucR1 and CtrA ChIP-seq peaks (tick marks). All but two of these sites (colored in red) also overlap with a GapR ChIP-seq peak. Nearly all of these sites lie in the origin-proximal half of the chromosome. The genes associated with these binding sites are largely swarmer specific in timing of expression or function, in agreement with the hypothesis that MucR1 represses swarmer-specific CtrA-regulated genes in S-phase (12) (Table S2).
Fig. S5.
Fig. S5.
GapR modulation influences expression of GapR-bound genes. (A) Bar graph showing the fold change (log2) in expression of the gapR and pilA from in a strain of Caulobacter where the PgapR promoter on a low-copy replicating plasmid promotes constitutive expression of gapR (pRMCS::gapR), as determined by qRT-PCR. (B) Bar graph showing the fold change (log2) in expression of the indicated GapR-bound genes following induction of GapR proteolysis (1 h) as determined by qRT-PCR and RNA-seq.
Fig. 5.
Fig. 5.
GapR exhibits biased subcellular localization and self-associates in vivo. (A) WT Caulobacter NA1000 containing chromosomal mCherry-gapR under control of the PxylX promoter was grown to midexponential phase in M2G, grown an additional 2 h in the presence of 0.3% xylose, and then imaged by phase contrast and epifluorescence microscopy. (Scale bar, 1 μm.) (B) Biased swarmer compartment localization of mCherry-GapR in predivisional cells, presented as a fluorescence/phase contract overlay (Left) and as a diagrammatic projection (Right). (Scale bar, 1 μm.) (C) Bacterial two-hybrid assay indicating direct GapR-GapR and GapR-GapRCr30 interactions in vivo. Reconstitution of split adenylate cyclase (CyaA) activity, which implies a direct interaction between the domains fused to the T18 and T25 subunits of CyaA, is indicated by a Lac+ (red colony) phenotype on MacConkey agar. GapR or GapRCr30 was fused in-frame to the C terminus of CyaAT25 and coexpressed with GapR-CyaAT18 or, as a negative control, CyaAT18 alone (Right). As a positive control, the self-associating leucine zipper domain of yeast GCN4 (ZIP) was fused to the T18 and T25 fragments of CyaA (Left).
Fig. S6.
Fig. S6.
GapR expression is constitutive across the cell cycle. Synchronous cultures of Caulobacter NA1000 (Top) or derivative strains expressing FLAG-GapR or GapR-FLAG (Middle and Bottom, respectively) were allowed to proceed through the cell cycle in M2G. SDS/PAGE samples were harvested in 15-min increments, and Western blots were performed using α-CtrA or α-FLAG antisera.
Fig. 6.
Fig. 6.
GapR-like activity and localization of GapR homologs and E. coli H-NS in Caulobacter. (A) GapR homologs from divergent α-proteobacteria and Caulobacter-specific bacteriophage ΦCr30 (Left) or E. coli hns (Right) were introduced into C. crescentus NA1000 on a low-copy replicating plasmid driven by the vanillate-inducible vanA promoter, grown for 4 h in M2G after addition of 0.5 mM vanillate and imaged by phase contrast microscopy. Agro, Agrobacterium tumefaciens; Rhodo, Rhodobacter capsulatus; Sino, Sinorhizobium meliloti; Cr30, Caulophage ΦCr30. (Scale bar, 1 μm.) (B) The GapR homolog from R. capsulatus (Rcc02587) was tagged with mCherry, expressed in NA1000 from the chromosomal PxylX promoter in the presence of 0.3% xylose and visualized by epifluorescence microscopy (shown overlaid with the phase contrast image), revealing an asymmetric distribution within predivisional cells. (Scale bar, 1 μm.) (C) eGFP-tagged H-NS from E. coli was expressed from the xylose promoter and its localization visualized as described above, showing a symmetric distribution within predivisional cells. (Scale bar, 1 μm.)
Fig. S7.
Fig. S7.
Sequence alignment of GapR homologs shown to induced GapR-like toxicity. GapR and its four homologs characterized in this report (GapRRhodo, GapRSino, GapRAgro, and GapRCr30; Fig. 6A) were aligned using ClustalW. Columns are marked when all homologs share the same residue (*), physicochemically similar residues (:), or residues with more generic common feature (.).
Fig. 7.
Fig. 7.
GapR recapitulates the subcellular localization, but not the function, of H-NS in E. coli. (A) An E. colihns mutant expressing mCherry alone (Top) or mCherry-GapR (Bottom) under control of the arabinose-inducible araBAD promoter was grown for 2 h in rich media with induction (0.02% arabinose) and imaged by epifluorescence and phase contrast microscopy. (Scale bar, 1 μm.) (B) An E. colihns mutant containing a plasmid expressing both mCherry-GapR and eGFP-HNS from a single araBAD promoter was grown and imaged as in A. (C) E. colihns mutant strains transformed with pBAD33 containing gapR, pBAD33 containing hns (positive control), or empty vector (negative control) were spotted onto salicin agar (which reports on expression of the cryptic bgl operon) seeded with 0.02% arabinose. Yellow colony color, Bgl+ (no complementation); blue colony color, Bgl (complementation). (Scale bar, 1 μm.)

Similar articles

Cited by

References

    1. Dillon SC, Dorman CJ. Bacterial nucleoid-associated proteins, nucleoid structure and gene expression. Nat Rev Microbiol. 2010;8(3):185–195. - PubMed
    1. Cagliero C, Grand RS, Jones MB, Jin DJ, O’Sullivan JM. Genome conformation capture reveals that the Escherichia coli chromosome is organized by replication and transcription. Nucleic Acids Res. 2013;41(12):6058–6071. - PMC - PubMed
    1. Dorman CJ. Genome architecture and global gene regulation in bacteria: Making progress towards a unified model? Nat Rev Microbiol. 2013;11(5):349–355. - PubMed
    1. Le TB, Imakaev MV, Mirny LA, Laub MT. High-resolution mapping of the spatial organization of a bacterial chromosome. Science. 2013;342(6159):731–734. - PMC - PubMed
    1. Marbouty M, et al. Condensin- and replication-mediated bacterial chromosome folding and origin condensation revealed by Hi-C and super-resolution imaging. Mol Cell. 2015;59(4):588–602. - PubMed

Publication types

MeSH terms

LinkOut - more resources