Review
. 2016 Sep 7;3(5):e279.
doi: 10.1212/NXI.0000000000000279. eCollection 2016 Oct.

The topographical model of multiple sclerosis: A dynamic visualization of disease course

Affiliations
Review

The topographical model of multiple sclerosis: A dynamic visualization of disease course

Stephen C Krieger et al. Neurol Neuroimmunol Neuroinflamm. .

Abstract

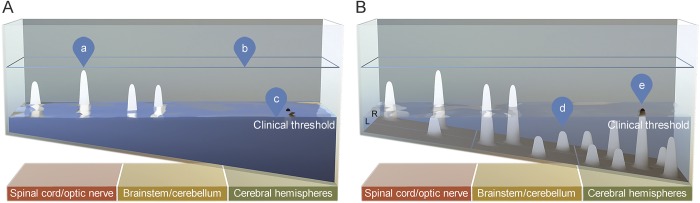
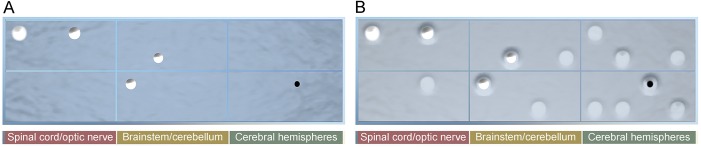
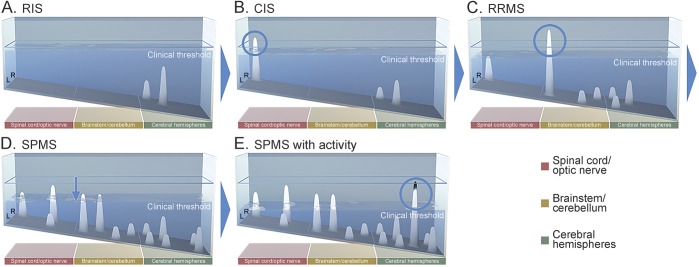
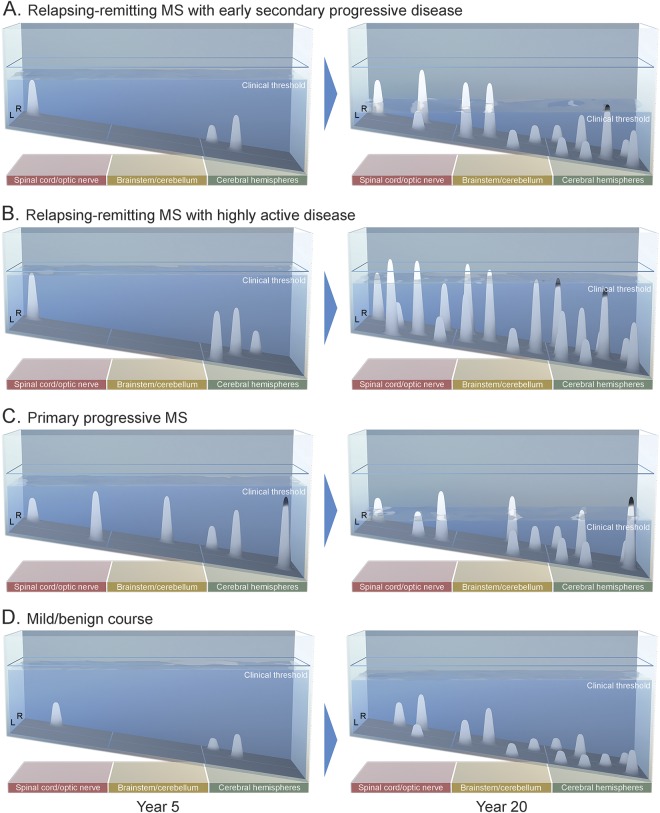
Relapses and progression contribute to multiple sclerosis (MS) disease course, but neither the relationship between them nor the spectrum of clinical heterogeneity has been fully characterized. A hypothesis-driven, biologically informed model could build on the clinical phenotypes to encompass the dynamic admixture of factors underlying MS disease course. In this medical hypothesis, we put forth a dynamic model of MS disease course that incorporates localization and other drivers of disability to propose a clinical manifestation framework that visualizes MS in a clinically individualized way. The topographical model encapsulates 5 factors (localization of relapses and causative lesions; relapse frequency, severity, and recovery; and progression rate), visualized utilizing dynamic 3-dimensional renderings. The central hypothesis is that, like symptom recrudescence in Uhthoff phenomenon and pseudoexacerbations, progression clinically recapitulates prior relapse symptoms and unmasks previously silent lesions, incrementally revealing underlying lesion topography. The model uses real-time simulation software to depict disease course archetypes and illuminate several well-described but poorly reconciled phenomena including the clinical/MRI paradox and prognostic significance of lesion location and burden on disease outcomes. Utilization of this model could allow for earlier and more clinically precise identification of progressive MS and predictive implications can be empirically tested.


Figures

Figure 1
Figure 1. The topographical model of multiple sclerosis, clinical (A) and subclinical (B) views
(A) Clinical view: water is opaque, only above-threshold peaks are visible. (a) Above-threshold topographical peaks depict relapses and quantified Expanded Disability Status Scale/functional system disability measures. Each peak yields localizable clinical findings; the topographical distribution defines the clinical picture for an individual patient. (b) Water level at outset reflects baseline functional capacity and may be estimated by baseline brain volume. (c) Water level decline reflects loss of functional reserve and may be estimated by metrics of annualized brain atrophy. (B) Subclinical view: water is translucent, both clinical signs and subthreshold lesions are visible. (d) Subthreshold topographical peaks depict T2 lesion number and volume. (e) The tallest peaks (i.e., the most destructive) in the cerebral hemispheres are shown capped in black as T1 black holes.
Figure 2
Figure 2. Lesion localization visualized in the top view of the model
In this view, the topographical distribution of lesions is shown in the anatomical grid, grouped across the 3 key regions with lateralization, replicating a distilled MRI perspective. Both T2 lesions and a representative T1 black hole are shown. (A) Top (clinical) view: water is opaque, only above-threshold peaks are visible. (B) Top (subclinical) view: water is translucent, subthreshold lesions are visible.
Figure 3
Figure 3. Archetypal MS clinical course depicted over 20 years
Still images from 5 key time points in this 20-year clinical course depiction are shown. (A) RIS: lesions emerge as topographical peaks that are apparent as T2 lesions on MRI but have not crossed the clinical threshold. (B) CIS: the first lesion (circled) to cross the clinical threshold denotes CIS. Lesions arising in the shallow end are more likely to cross the clinical threshold, as there is less functional reserve in these regions. (C) RRMS: the emergence of subsequent subthreshold lesions defines RRMS by the McDonald criteria. The second clinical relapse (circled) defines clinically definite MS—in this example, a brainstem attack. Additional lesions denote ongoing disease activity, i.e., “base effects.” (D) SPMS is characterized by a gradual decline in functional capacity, revealing the underlying lesion topography above the clinical threshold. Disability is driven here principally by the dropping threshold, i.e., “surface effects” (downward arrow). Progression takes the form of a patient's particular disease topography, unmasking existing deficits and recapitulating symptoms of prior relapse—in this example, multifocal myelopathy and brainstem/cerebellar signs. (E) SPMS with activity is demonstrated by a new relapse (circled) occurring in the context of progressive disease. CIS = clinically isolated syndrome; MS = multiple sclerosis; RIS = radiologically isolated syndrome; RRMS = relapsing-remitting MS; SPMS = secondary progressive MS.
Figure 4
Figure 4. Four representative disease-course archetypes
The model conceptualizes relapsing and progressive contributions to disease course along a continuum: an individual's disease course can be driven predominantly by relapses, or predominantly by progression, and those with very mild or stable disease may demonstrate neither. Each archetypal disease course is shown at year 5 and year 20. (A) Relapsing-remitting MS with early secondary progressive disease: relapsing disease transitions to secondary progressive MS with disability being driven in the early years by relapse (“base effects”) and in the later years primarily by the declining threshold (“surface effects”). (B) Relapsing-remitting MS with highly active disease is characterized topographically by extensive clinical and subclinical inflammatory activity. Here, several lesions in the spinal cord and brainstem do not resolve below the clinical threshold, demonstrating lesions with high severity and low recovery capacity. (C) Primary progressive MS: several subthreshold lesions denote underlying disease activity, which do not cross the clinical threshold until functional reserve declines. Disability is driven here by the dropping threshold. (D) Mild course: no demonstrable disability is accumulated at 20 years of disease. All relapses resolve below the clinical threshold—demonstrating lesions with a high recovery capacity—and there is little depletion of functional reserve beyond that of normal aging. MS = multiple sclerosis.

References

    1. Lublin FD, Reingold SC. Defining the clinical course of multiple sclerosis: results of an international survey. Neurology 1996;46:907–911. - PubMed
    1. Mahad DH, Trapp BD, Lassmann H. Pathological mechanisms in progressive multiple sclerosis. Lancet Neurol 2015;14:183–193. - PubMed
    1. Confavreux C, Vukusic S. Natural history of multiple sclerosis: a unifying concept. Brain 2006;129:606–616. - PubMed
    1. Leray E, Yaouanq J, Le Page E, et al. . Evidence for a two-stage disability progression in multiple sclerosis. Brain 2010;133:1900–1913. - PMC - PubMed
    1. Lublin FD, Reingold SC, Cohen JA, et al. . Defining the clinical course of multiple sclerosis: the 2013 revisions. Neurology 2014;83:278–286. - PMC - PubMed

LinkOut - more resources