. 2016 Sep 20;17(1):133.
doi: 10.1186/s12882-016-0348-x.

Relationship of clusterin with renal inflammation and fibrosis after the recovery phase of ischemia-reperfusion injury

Affiliations

Relationship of clusterin with renal inflammation and fibrosis after the recovery phase of ischemia-reperfusion injury

Jia Guo et al. BMC Nephrol. .

Abstract

Background: Long-term outcomes after acute kidney injury (AKI) include incremental loss of function and progression towards chronic kidney disease (CKD); however, the pathogenesis of AKI to CKD remains largely unknown. Clusterin (CLU) is a chaperone-like protein that reduces ischemia-reperfusion injury (IRI) and enhances tissue repair after IRI in the kidney. This study investigated the role of CLU in the transition of IRI to renal fibrosis.

Methods: IRI was induced in the left kidneys of wild type (WT) C57BL/6J (B6) versus CLU knockout (KO) B6 mice by clamping the renal pedicles for 28 min at the body temperature of 32 °C. Tissue damage was examined by histology, infiltrate phenotypes by flow cytometry analysis, and fibrosis-related gene expression by PCR array.

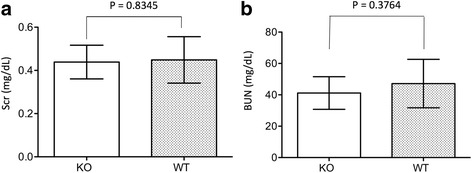
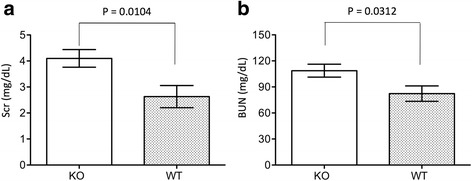
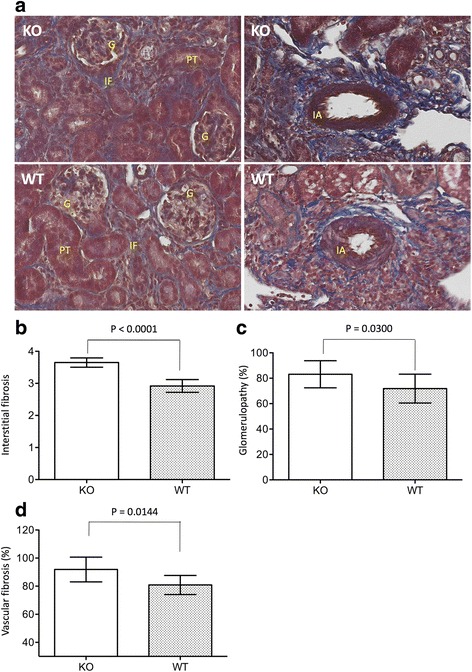
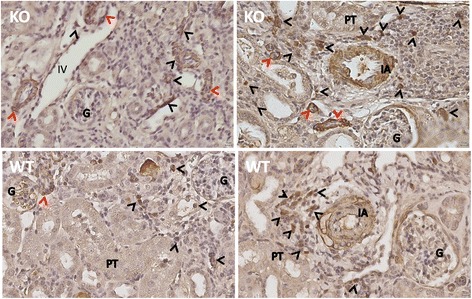
Results: Reduction of kidney weight was induced by IRI, but was not affected by CLU KO. Both WT and KO kidneys had similar function with minimal cellular infiltration and fibrosis at day 14 of reperfusion. After 30 days, KO kidneys had greater loss in function than WT, indicated by the higher levels of both serum creatinine and BUN in KO mice, and exhibited more cellular infiltration (CD8 cells and macrophages), more tubular damage and more severe tissue fibrosis (glomerulopathy, interstitial fibrosis and vascular fibrosis). PCR array showed the association of CLU deficiency with up-regulation of CCL12, Col3a1, MMP9 and TIMP1 and down-regulation of EGF in these kidneys.

Conclusion: Our data suggest that CLU deficiency worsens renal inflammation and tissue fibrosis after IRI in the kidney, which may be mediated through multiple pathways.

Keywords: Acute kidney injury; Chronic kidney disease; Clusterin; Fibrosis; Kidney ischemia-reperfusion.


Figures

Fig. 1
Fig. 1
No difference in the progression of kidney atrophy between CLU KO mice and WT controls after IRI. Renal IRI in left kidneys of CLU KO versus WT mice was induced by clamping renal pedicles for 28 min at the body temperature of 32 °C, and the weight of the left kidney and contralateral right kidney from each mouse was recorded at different time points after reperfusion. Data are presented in the figure as mean ± standard error of the mean (SEM) of each group. KO-IRI: the left kidneys of CLU KO mice (n = 4–15) after IRI (p = 0.0073, one-way ANOVA); KO-Contralateral: the right/contralateral kidneys of CLU KO mice (p = 0.0553, one-way ANOVA); WT-IRI: the left kidneys of WT mice (n = 4–22) after IRI (p = 0.0060, one-way ANOVA); and WT-Contralateral: the right/contralateral kidneys of CLU KO mice (p = 0.5140, one-way ANOVA). Kidney atrophy in KO versus WT mice, p = 0.3542 (two-way ANOVA)
Fig. 2
Fig. 2
No difference in renal function between CLU KO and WT mice on day 14 after IRI. On day 13 after IRI, contralateral kidneys were removed. After 24 h of surgery, serum from each mouse was collected, and the levels of both serum creatinine (Scr) and blood urea nitrogen (BUN) were measured as biomarkers of renal function. Data are presented as mean ± standard derivation (SD) of each group. a Scr in CLU KO group (n = 8) compared to WT control (n = 8), p = 0.8345 (two-tailed t-test). b BUN in CLU KO group (n = 8) compared to WT control (n = 8), P = 0.3764 (two-tailed t-test)
Fig. 3
Fig. 3
No difference in tissue architecture of the kidneys between CLU KO and WT mice on day 14 after IRI. The sections of the left kidneys of WT versus CLU KO mice, harvested on day 14 after reperfusion, were stained with hematoxylin and eosin (HE) or Masson’s trichrome (MT). Data are presented as a typical microscopic image of renal cortex. KO: CLU null kidney sections; WT: WT kidney sections. a Typical microscopic images of HE-stained sections showing intact tubules with minimal cellular infiltration in the perivascular space. b Typical microscopic images of MT-stained sections showing red cytoplasm and mild blue collagen in the perivascular space. Black arrows: glomeruli; IA: interlobular artery; and IV: interlobular vein. c The infiltration was semi-quantitatively scored in two separate sections of each injured left kidney, and was presented in average per view. Data are presented as mean ± SD of each group. KO group vs. WT control: P = 0.1510 (two-tailed t-test, n = 9). d The interstitial fibrosis was semi-quantitatively scored in two separate sections of each injured left kidney, and was presented in average per view. Data are presented as mean ± SD of each group. KO group vs. WT control: P = 0.1284 (two-tailed t-test, n = 9)
Fig. 4
Fig. 4
An association of CLU deficiency with worse kidney function after 30 days of IRI. On day 29 after IRI, contralateral kidneys were removed. After 24 h of surgery, the serum levels of both serum creatinine (Scr) and blood urea nitrogen (BUN) were measured. Data are presented as mean ± SEM of each group. a Scr in CLU KO group (n = 21) compared to WT control (n = 22), p = 0.00104 (two-tailed t-test). b BUN in CLU KO group (n = 16) compared to WT control (n = 11), P = 0.0312 (two-tailed t-test)
Fig. 5
Fig. 5
An association of CLU deficiency with worse cellular infiltration after 30 days of IRI. As described in Fig. 4, the contralateral right kidneys were harvested on day 29, and the injured left kidney on day 30 after IRI. The sections (two per each kidney) of both kidneys (the left and right from KO or WT) were stained with HE for the examination of the content of mononuclear infiltrates, labeled by dark/black nuclear staining. a A typical microscopic image of renal cortex in each group (KO: CLU null kidneys; WT: WT kidney sections). Left column: tubule damage and cellular infiltration of the injured left kidneys; right column: normal tissue architecture of the contralateral right kidneys. G: glomerulus; PT: proximal convoluted tubule; DT: distal convoluted tubule; IA: interlobular artery; and IV: interlobular vein. b The infiltration was semi-quantitatively scored in at least 20 randomly selected views in two separate sections of each injured left kidney, and was presented in average per view. Data are presented as mean ± standard derivation (SD) of each group. KO group vs. WT control: P < 0.0001 (two-tailed t-test, n = 8)
Fig. 6
Fig. 6
An association of CLU deficiency with more renal tubular injury after 30 days of IRI. The sections of CLU null and WT kidneys, harvested after 30 days of IRI, were stained with periodic acid-Schiff (PAS), and the number of injured tubules, including cellular loss (atrophy), intratubular cast formation, tubular cell flattening and vacuolation, in renal cortex was counted in each microscopic view (200x magnification). a Typical microscopic views of kidney sections in each group (KO: CLU KO kidneys; WT: WT kidneys). G: glomerulus; *: damaged tubules. b The number of injured tubules was counted in at least 20 randomly selected views in two separate sections of each kidney and was presented in average per view. Data are presented as mean ± SD of each group. KO group vs. WT control: P < 0.0001 (two-tailed t-test, n = 8)
Fig. 7
Fig. 7
An association of CLU deficiency with more renal fibrosis (tubulointerstitial fibrosis, glomerulopathy and vascular fibrosis) after 30 days of IRI. The sections of CLU KO and WT kidneys, harvested after 30 days of IRI, were stained with MT. a Typical microscopic views of kidney sections in each group (KO: CLU KO kidneys; WT: WT kidneys), showing blue stain of collagen accumulation in the tubulointerstitial area, inside the glomerulus and interlobular arterial wall, and in the perivascular space. G: glomerulus; PT: proximal convoluted tubule; IA: interlobular artery; IF: interstitial fibrosis. b The extent of tubulointerstitial fibrosis was semi-quantitatively scored in at least 20 randomly selected views in two separate sections of each kidney and was presented in average per view. Data are presented as mean ± SD of each group. KO group vs. WT control: P < 0.0001 (two-tailed t-test, n = 8). c The percentage of affected glomeruli (glomerulopathy), including glomerulosclerosis (focal and seqmental sclerosis) and glomerular hypertrophy, was counted in two separate sections of each kidney, and the range of 180 to 250 glomeruli of each kidney was examined. Data are presented as mean ± SD of each group. KO group vs. WT control: P = 0.0300 (one-tailed t-test, n = 8). d The percentage of affected interlobular arterioles or arteries, determined by the presence of the fibrous intima, was counted in two separate sections of each kidney, and the range of 10 to 20 interlobular arteries or arterioles of each kidney was examined. Data are presented as mean ± SD of each group. KO group vs. WT control: P = 0.0144 (two-tailed t-test, n = 8)
Fig. 8
Fig. 8
An association of CLU deficiency with more positivity in α-SMA stain. The expression of α-SMA (a myofibroblast marker) in the sections of CLU null and WT kidneys, harvested after 30 days of IRI, was examined by using a routine immunohistochemical method. Data were a typical microscopic view of the renal cortex in each group (KO: CLU KO kidneys; WT: WT kidneys), showing dark brown stain of α-SMA-expressing cells in the tubulointerstitial area and tubular epithelium, inside the glomerulus and interlobular arterial wall, and in the perivascular space. G: glomerulus; PT: proximal convoluted tubule; IA: interlobular artery; and IV: interlobular vein. Black arrows: infiltrating α-SMA+ cells; red arrows: tubular α-SMA+ cells

Similar articles

Cited by

References

    1. Le Dorze M, Legrand M, Payen D, Ince C. The role of the microcirculation in acute kidney injury. Curr Opin Crit Care. 2009;15(6):503–8. doi: 10.1097/MCC.0b013e328332f6cf. - DOI - PubMed
    1. Bonventre JV, Yang L. Cellular pathophysiology of ischemic acute kidney injury. J Clin Invest. 2011;121(11):4210–21. doi: 10.1172/JCI45161. - DOI - PMC - PubMed
    1. Liano F, Pascual J. Epidemiology of acute renal failure: a prospective, multicenter, community-based study. Madrid Acute Renal Failure Study Group. Kidney Int. 1996;50(3):811–8. doi: 10.1038/ki.1996.380. - DOI - PubMed
    1. Kaufman J, Dhakal M, Patel B, Hamburger R. Community-acquired acute renal failure. Am J Kidney Dis. 1991;17(2):191–8. doi: 10.1016/S0272-6386(12)81128-0. - DOI - PubMed
    1. Bahloul M, Ben Hamida C, Damak H, Kallel H, Ksibi H, Rekik N, et al. Incidence and prognosis of acute renal failure in the intensive care unit. Retrospective study of 216 cases. Tunis Med. 2003;81(4):250–7. - PubMed

Publication types