. 2016 Nov 15;88(22):10876-10883.
doi: 10.1021/acs.analchem.6b01410. Epub 2016 Oct 27.

Automated, Multiplexed Electrical Impedance Spectroscopy Platform for Continuous Monitoring of Microtissue Spheroids

Affiliations

Automated, Multiplexed Electrical Impedance Spectroscopy Platform for Continuous Monitoring of Microtissue Spheroids

Sebastian C Bürgel et al. Anal Chem. .

Abstract

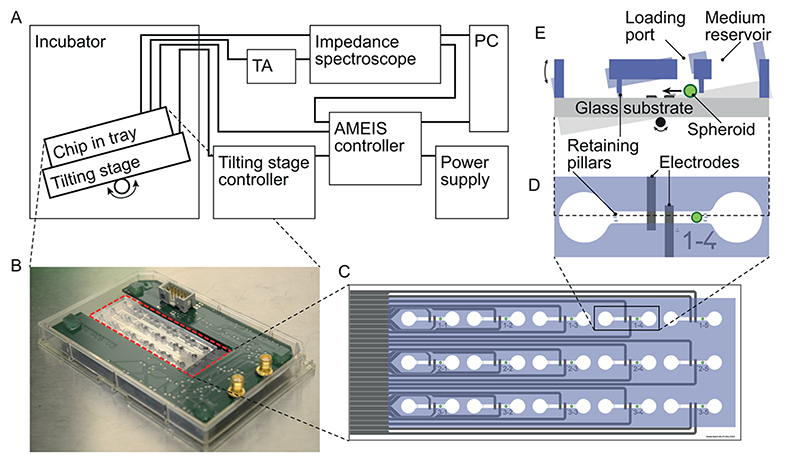
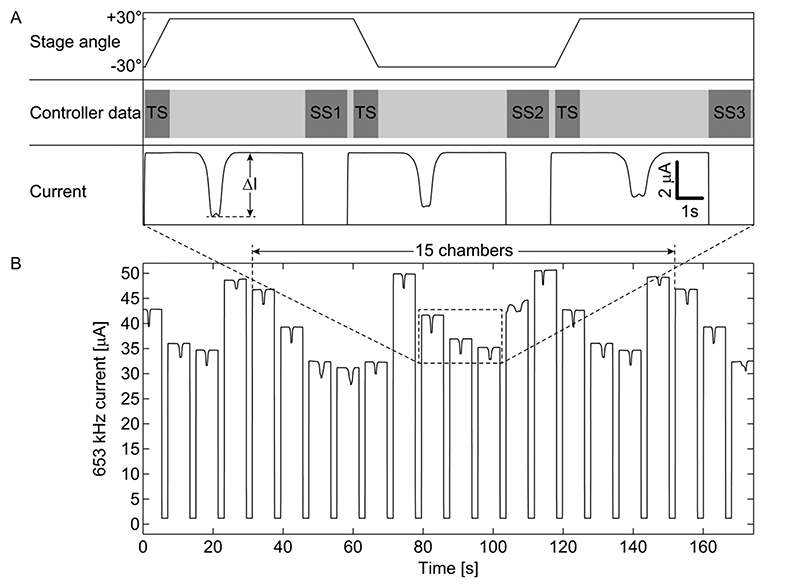
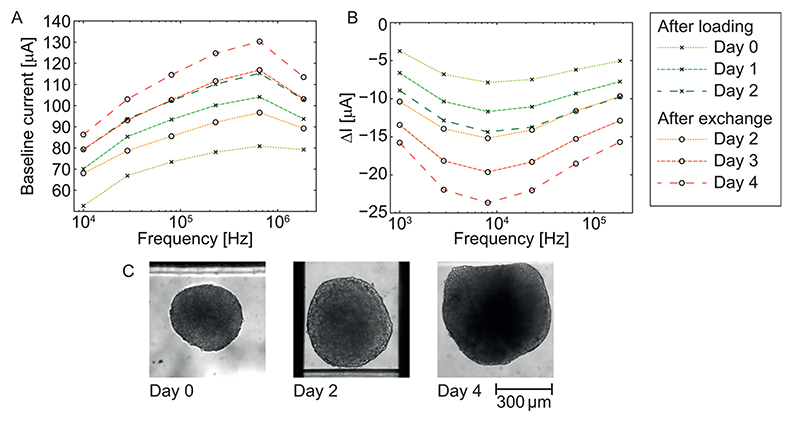
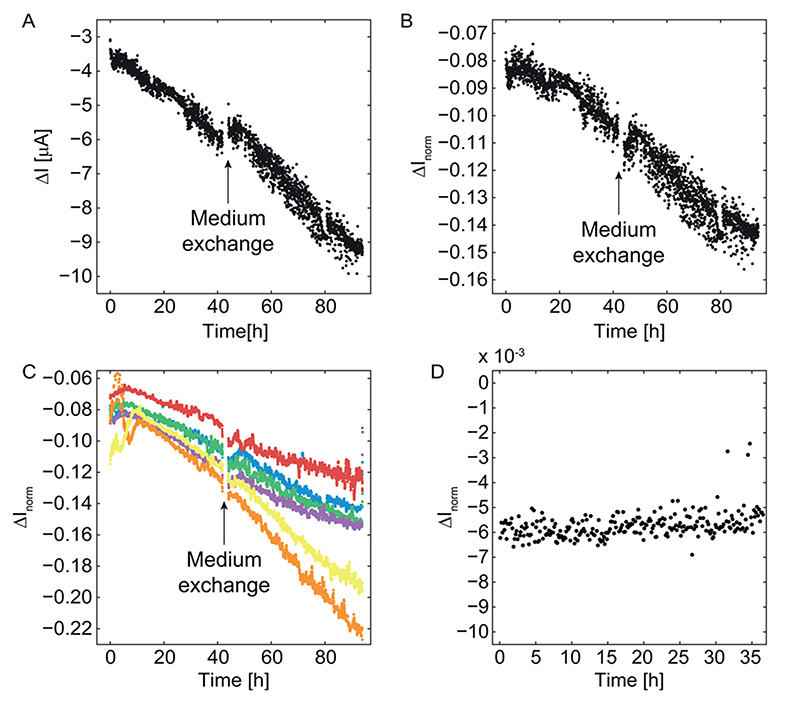
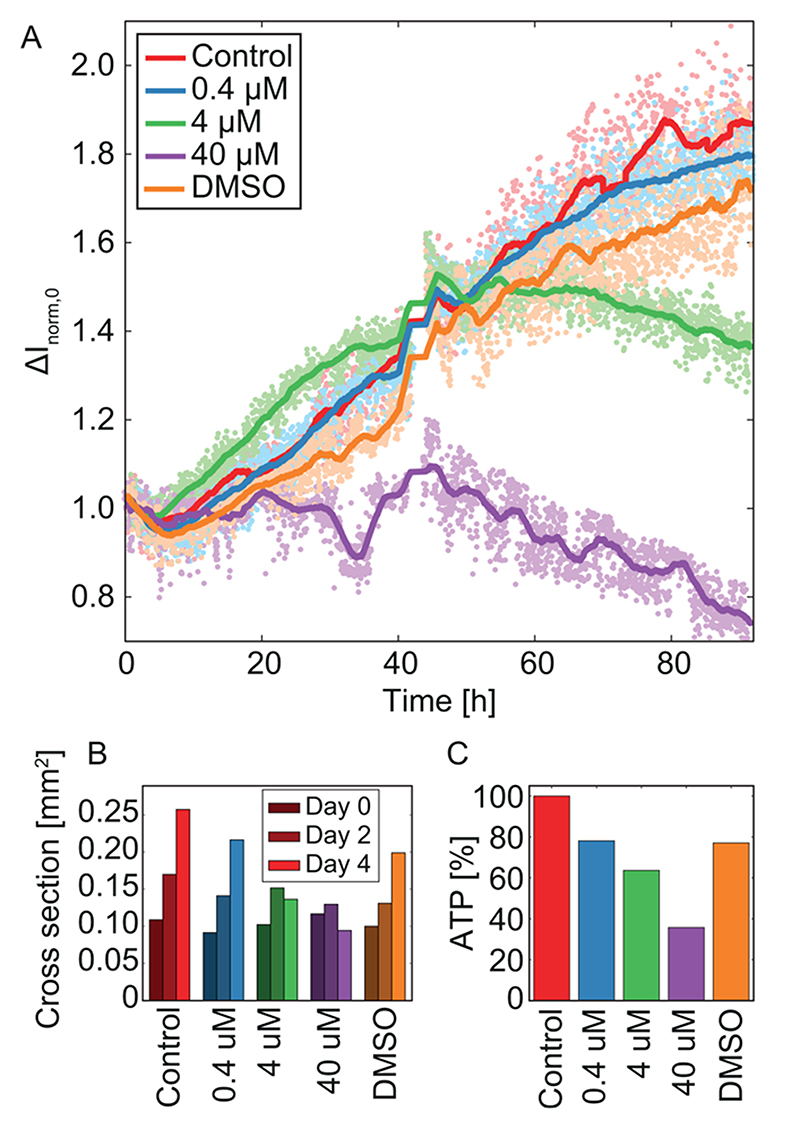
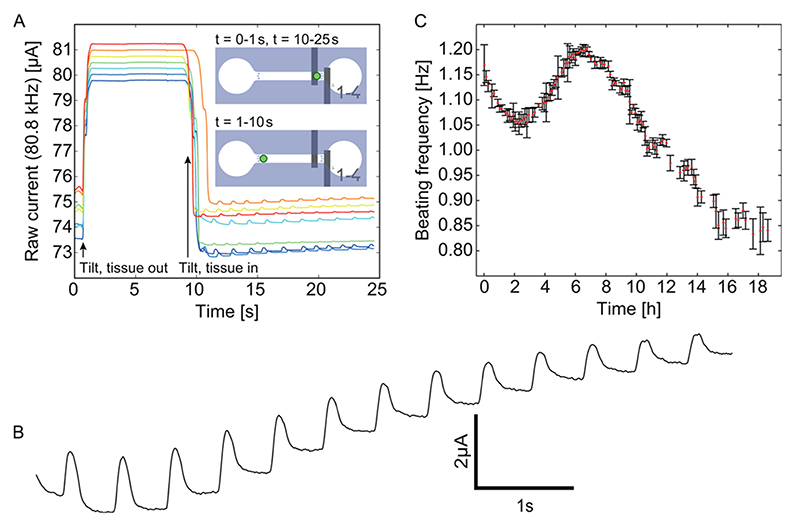
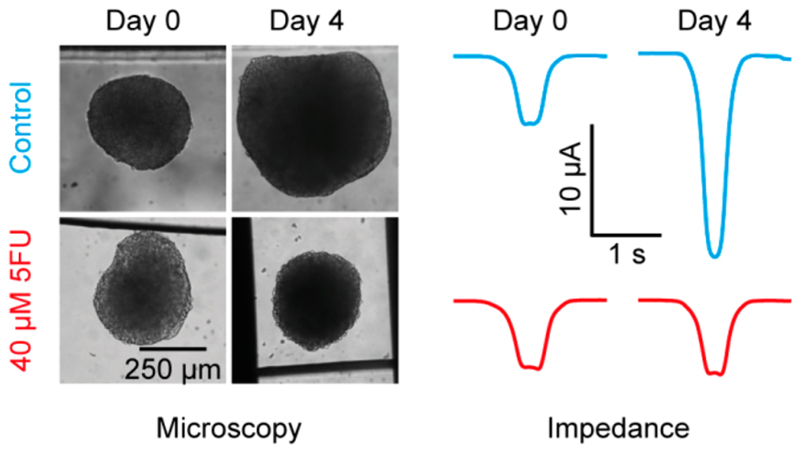
Microtissue spheroids in microfluidic devices are increasingly used to establish novel in vitro organ models of the human body. As the spheroids are comparably sizable, it is difficult to monitor larger numbers of them by optical means. Therefore, electrical impedance spectroscopy (EIS) emerges as a viable alternative to probing spheroid properties. Current spheroid EIS systems are, however, not suitable for investigating multiple spheroids in parallel over extended time in an automated fashion. Here we address this issue by presenting an automated, multiplexed EIS (AMEIS) platform for impedance analysis in a microfluidic setting. The system was used to continuously monitor the effect of the anticancer drug fluorouracil (5-FU) on HCT116 cancer spheroids. Simultaneous EIS monitoring of up to 15 spheroids was performed in parallel over 4 days at a temporal resolution of 2 min without any need for pumps. The measurements were continuous in nature, and the setup was kept in a standard incubator under controlled conditions during the measurements. A baseline normalization method to improve robustness and to reduce the influence of slow changes in the medium conductivity on the spheroid EIS readings has been developed and validated by experiments and means of a finite-element model. The same method and platform was then used for online monitoring of cardiac spheroids. The beating frequency of each cardiac spheroid could be read out in a completely automated fashion. The developed system constitutes a promising method for simultaneously evaluating drug impact and/or toxic effects on multiple microtissue spheroids.


Conflict of interest statement

Notes

The authors declare no competing financial interest.

Figures

Figure 1
Figure 1. Overview of the AMEIS platform
(A) schematics of the entire system (TA, transimpedance amplifier); (B) chip (highlighted in dashed red line) and switch board placed in omni-tray; (C) schematic of the chip with 15 separate chambers featuring gray electrodes and blue PDMS structures; (D) close-up of one chamber with reservoirs on the left and right. The spheroid movement in the central channel (580 μm × 700 μm cross section) was confined by retaining pillars on both sides of the channel, and the coplanar EIS electrode set was arranged centrally in the channel; (E) schematic side view showing the medium reservoir and spheroid loading port, as well as the tilting-induced motion of the spheroid over the electrodes.
Figure 2
Figure 2. Measurement principle in the time domain.
(A) Temporal sequence of stage tilting, controller signals (switching sequences, indicated as SS, and tilting sequence, indicated as TS) and corresponding current dips caused by spheroids moving over the electrodes. (B) Raw current signals of an entire measurement cycle of all 15 chambers measured at 653 kHz. ΔI denotes peak-to-baseline signal heights.
Figure 3
Figure 3. Current spectra of a cancer spheroid at selected time points
(A) baseline current spectra; (B) ΔI peak-to-baseline spectra. Spectra are shown for selected time points between days 0 and 4; on day 2, the medium in all reservoirs was exchanged so that data before and after medium exchange on the same day are shown. (C) Optical monitoring of the growth of the very same spheroid measured by EIS in panel B.
Figure 4
Figure 4
Current vs time curves for growing cancer spheroids (A-C) and a pancreatic microislet, which was not expected to grow (D). (A) Continuous recordings during 90 h show a noticeable discontinuity upon medium exchange after 42 h in the peak-to-baseline (ΔI) current at 81 kHz. (B) The same data have been normalized with the corresponding baseline currents so that a growth curve without discontinuity upon medium exchange results. (C) Normalized ΔI norm currents of six exemplary cancer spheroids after applying a movingaverage method including 10 subsequent measurement values. (D) ΔI norm for a pancreatic microislet, which expectedly does not grow. In contrast to the cancer spheroids, there are no large variations or a current decrease. The significantly smaller values in panel D compared to panel C are a consequence of the smaller size of the microislet (150 μm diameter).
Figure 5
Figure 5. Impact of the drug 5-FU on HCT116 cancer spheroids.
(A) The start-point-normalized current ΔI norm,0 of cancer spheroids which were grown in 0.4, 4, and 40 μM 5-FU, a control condition without drug, and a second control condition with just DMSO in the same concentration as has been used for the 40 μM concentration of 5-FU. The medium was exchanged after 42 h. (B) Cross section assessed via microscopy every 2 days. (C) Control-normalized ATP values at the end of the experiment. EIS data, optical size, and ATP were measured on the same tissues, respectively.
Figure 6
Figure 6. Measurements of cardiac spheroids.
(A) Tilting the chip with an off-center electrode arrangement allows for analysis of the cardiac beating. (B) Detailed view of a typical beating pattern when the spheroid is located between the electrodes. (C) An 18 h recording of the beating rate of a single spheroid; at each measurement point the mean beating rate and standard deviation are shown for a recording time span of 15 s (t = 10-25 s in panel A).
None

References

    1. Abbott A. Nature. 2003;424:870–2. - PubMed
    1. Kelm JM, Fussenegger M. Trends Biotechnol. 2004;22:195–202. - PubMed
    1. Santini MT, Rainaldi G, Indovina PL. Int J Radiat Biol. 1999;75:787–799. - PubMed
    1. Pampaloni F, Reynaud EG, Stelzer EHK. Nat Rev Mol Cell Biol. 2007;8:839–845. - PubMed
    1. Williamson A, Singh S, Fernekorn U, Schober A. Lab Chip. 2013;13:3471. - PubMed

Publication types