. 2017 Jan;173(1):256-268.
doi: 10.1104/pp.16.00813. Epub 2016 Sep 20.

Natural Variation in Brachypodium Links Vernalization and Flowering Time Loci as Major Flowering Determinants

Affiliations

Natural Variation in Brachypodium Links Vernalization and Flowering Time Loci as Major Flowering Determinants

Jan Bettgenhaeuser et al. Plant Physiol. 2017 Jan.

Abstract

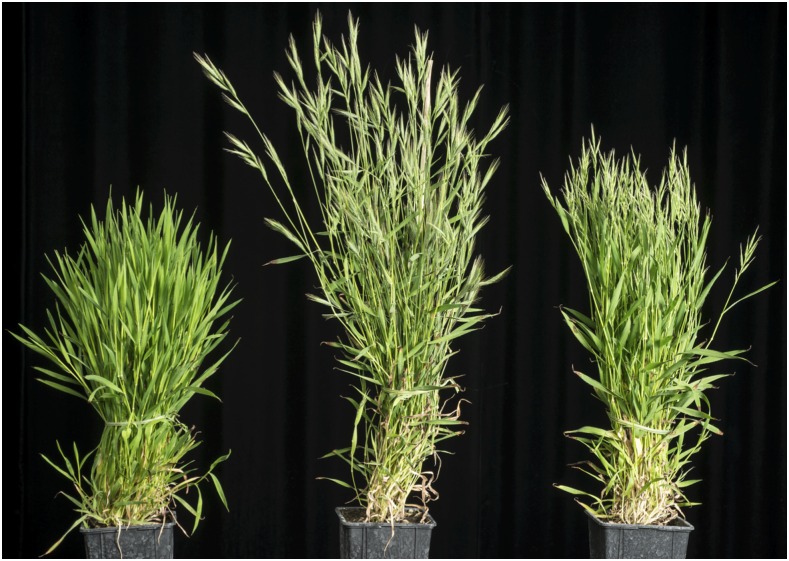
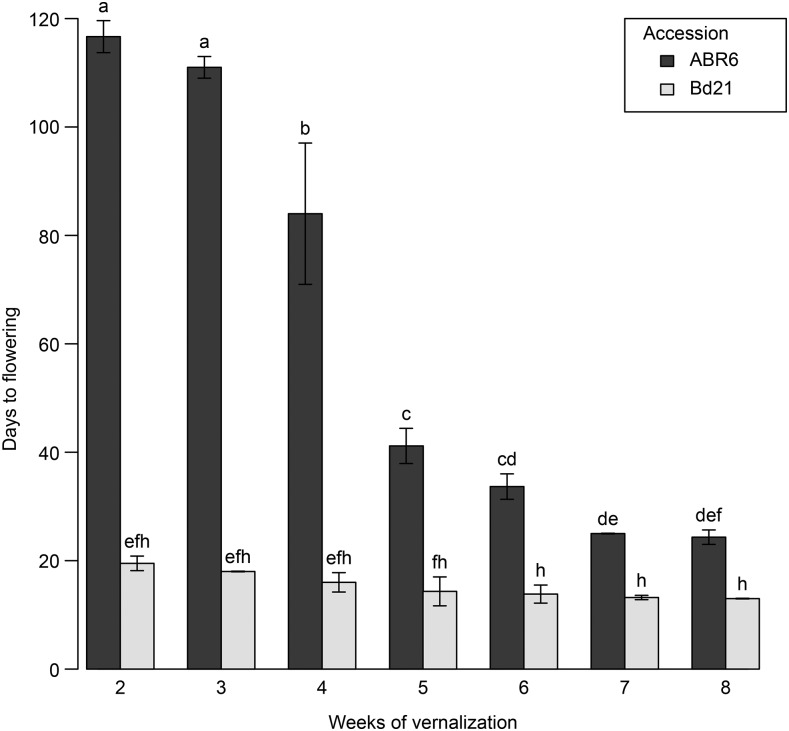
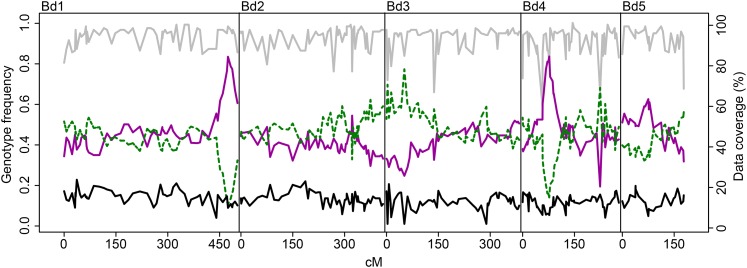
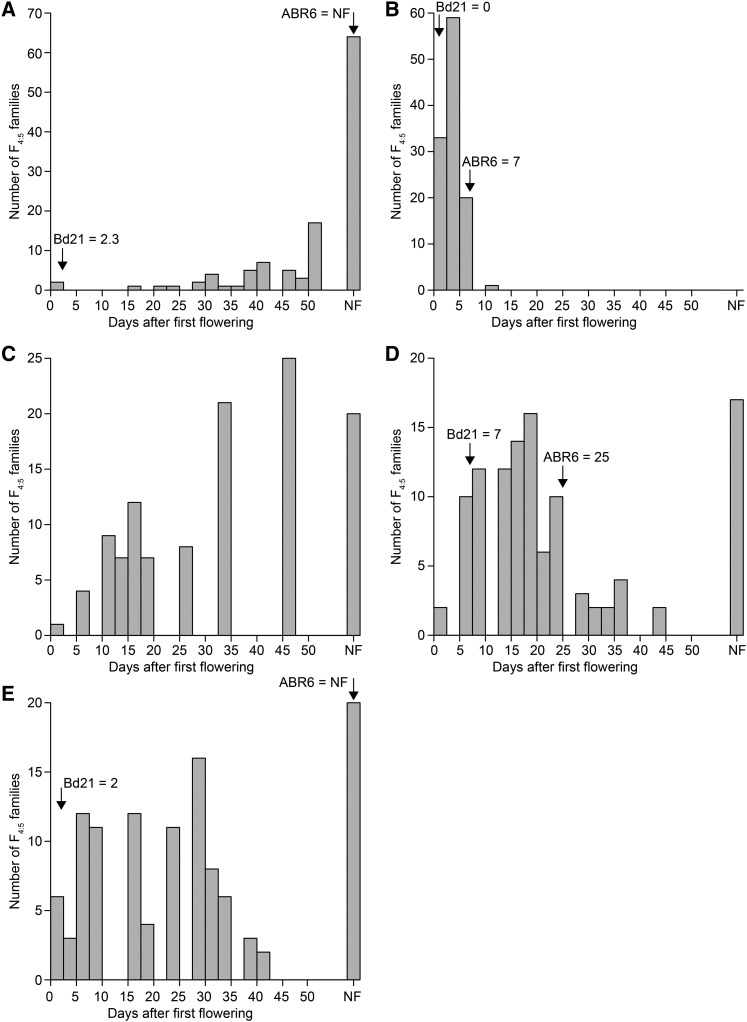
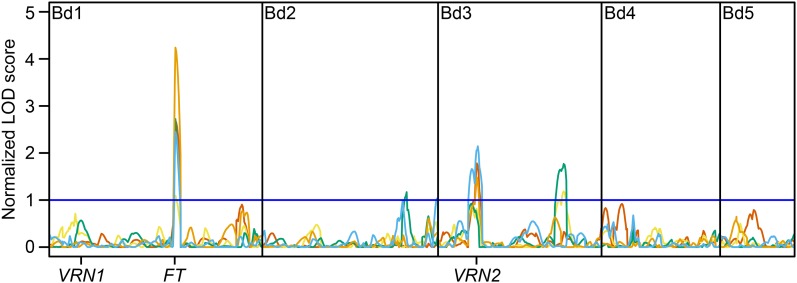
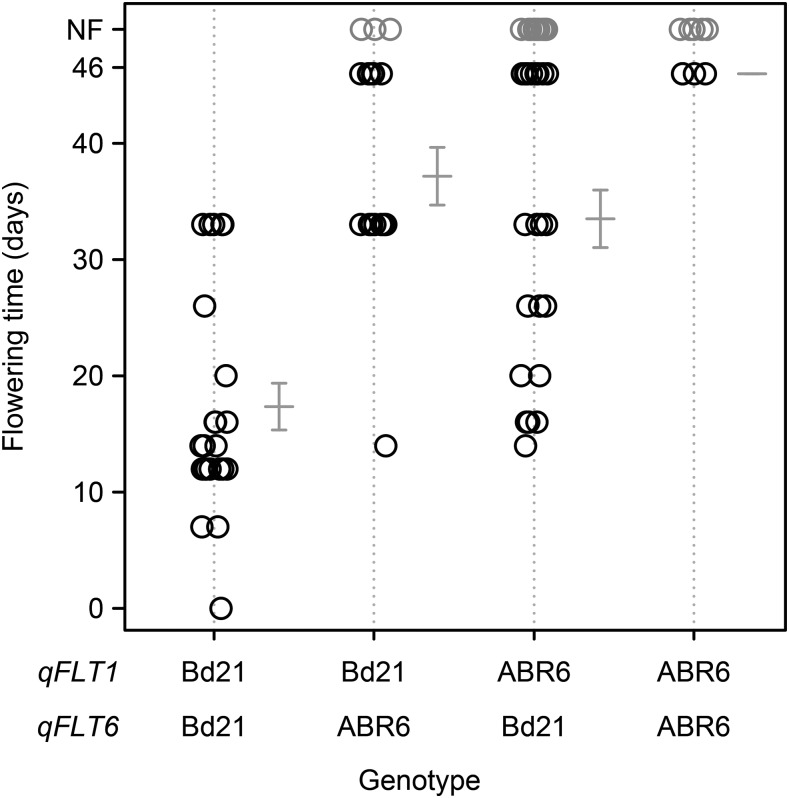
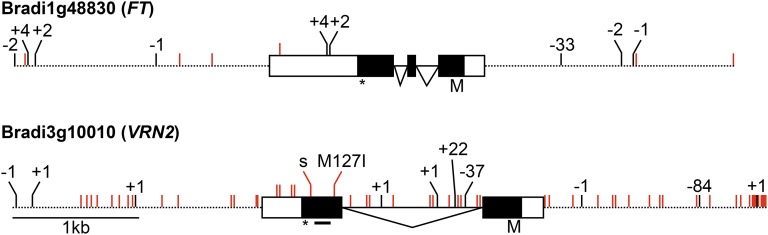
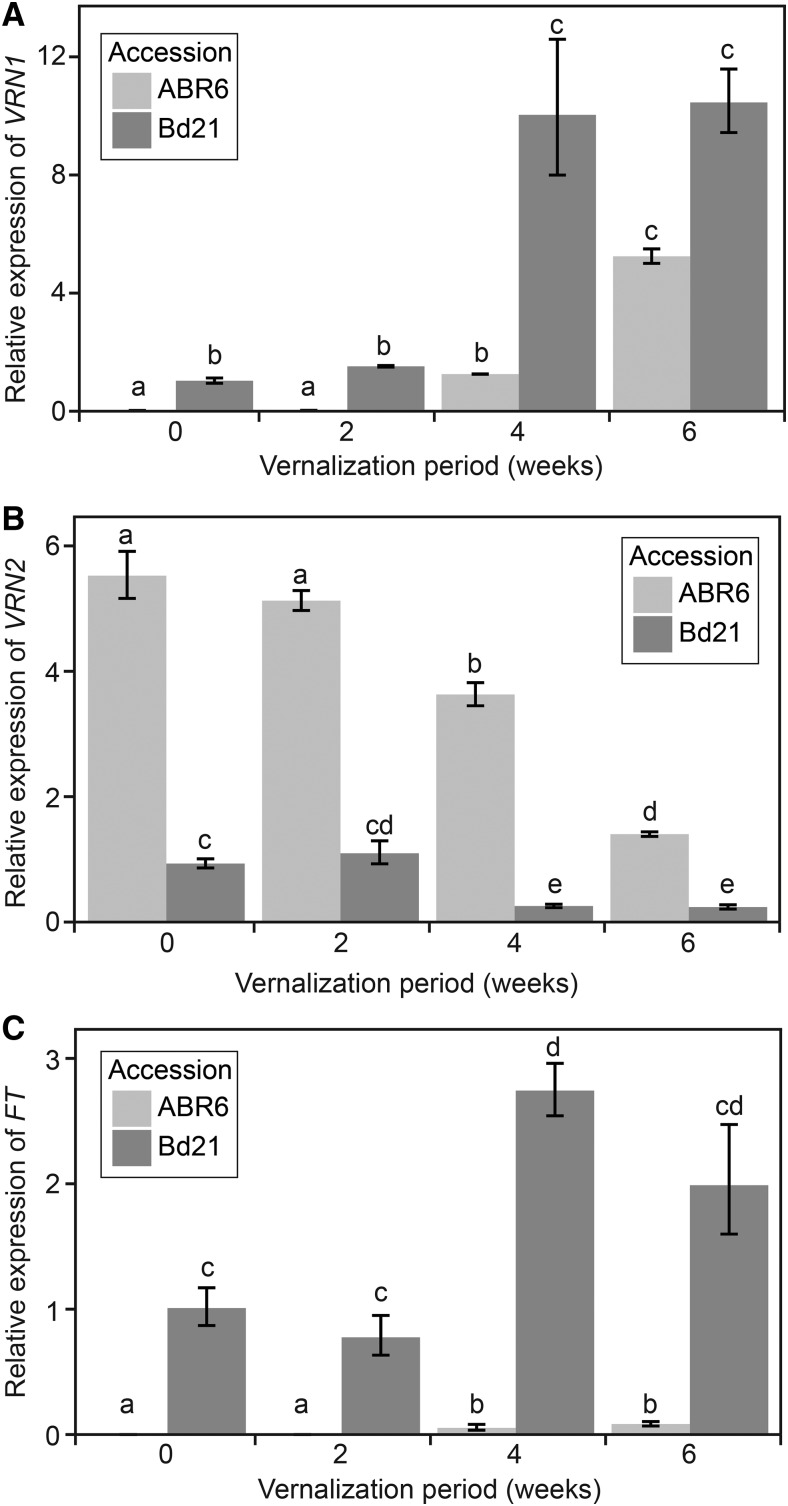
The domestication of plants is underscored by the selection of agriculturally favorable developmental traits, including flowering time, which resulted in the creation of varieties with altered growth habits. Research into the pathways underlying these growth habits in cereals has highlighted the role of three main flowering regulators: VERNALIZATION1 (VRN1), VRN2, and FLOWERING LOCUS T (FT). Previous reverse genetic studies suggested that the roles of VRN1 and FT are conserved in Brachypodium distachyon yet identified considerable ambiguity surrounding the role of VRN2 To investigate the natural diversity governing flowering time pathways in a nondomesticated grass, the reference B. distachyon accession Bd21 was crossed with the vernalization-dependent accession ABR6. Resequencing of ABR6 allowed the creation of a single-nucleotide polymorphism-based genetic map at the F4 stage of the mapping population. Flowering time was evaluated in F4:5 families in five environmental conditions, and three major loci were found to govern flowering time. Interestingly, two of these loci colocalize with the B. distachyon homologs of the major flowering pathway genes VRN2 and FT, whereas no linkage was observed at VRN1 Characterization of these candidates identified sequence and expression variation between the two parental genotypes, which may explain the contrasting growth habits. However, the identification of additional quantitative trait loci suggests that greater complexity underlies flowering time in this nondomesticated system. Studying the interaction of these regulators in B. distachyon provides insights into the evolutionary context of flowering time regulation in the Poaceae as well as elucidates the way humans have utilized the natural variation present in grasses to create modern temperate cereals.


Figures

Figure 1.
Figure 1.
Flowering behavior within the ABR6 × Bd21 mapping population. Three months after a 6-week vernalization period, ABR6 (left) is not flowering, whereas Bd21 (center) is flowering, and an individual in the ABR6 × Bd21 mapping population displays an intermediate flowering phenotype (right).
Figure 2.
Figure 2.
Effects of vernalization on flowering time in ABR6 and Bd21. Days to flowering was measured from the end of vernalization for seven different vernalization periods. After vernalization, plants were grown in a growth chamber (16-h photoperiod) for 35 d and then transferred to a greenhouse without light and temperature control (late April to mid July, 2013; Norwich, UK). Mean days to flowering and se are based on six biological replicates. Different letters represent statistically significant differences based on pairwise comparisons using Student’s t tests with pooled sd and Bonferroni correction for multiple comparisons.
Figure 3.
Figure 3.
Segregation distortion in the ABR6 × Bd21 F4 population. For each marker of the genetic map, the frequencies of F4 individuals with homozygous ABR6 genotype (solid magenta line), homozygous Bd21 genotype (dashed green line), or heterozygous genotype (solid black line) were calculated (scale on left). Data coverage (percentage of F4 individuals with genotype calls per marker) is represented by the gray line (scale on right).
Figure 4.
Figure 4.
Frequency distribution of flowering time in the ABR6 × Bd21 population. Flowering time was measured from the first day that flowering was observed in the entire population. A, Environment 1 (April to July; natural light supplemented for 20 h, 22°C/20°C, no vernalization). B, Environment 2 (April to July; natural light supplemented for 20 h, 22°C/20°C, 6 weeks of vernalization). C, Environment 3 (May to July; natural light and temperatures, no vernalization). D, Environment 4 (September to November; natural light supplemented for 16 h, minimum 18°C/11.5°C, no vernalization). E, Environment 5 (March to May; natural light and temperatures, no vernalization). Flowering times for the parental lines are indicated by arrows (no data for environment 3). NF, Not flowering.
Figure 5.
Figure 5.
Linkage mapping of flowering time in the ABR6 × Bd21 population. Time to flowering for 114 F4:5 families of the population was transformed into ordered rank values, QTL analysis was performed using composite interval mapping under an additive model hypothesis test (H0:H1), and data were plotted based on normalized permutation thresholds. The blue horizontal line represents the threshold of statistical significance based on 1,000 permutations. Orange line = environment 1 (April to July; natural light supplemented for 20 h, 22°C/20°C, no vernalization), blue line = environment 2 (April to July; natural light supplemented for 20 h, 22°C/20°C, 6 weeks of vernalization), red line = environment 3 (May to July; natural light and temperatures, no vernalization), yellow line = environment 4 (September to November; natural light supplemented for 16 h, minimum 18°C/11.5°C, no vernalization), and green line = environment 5 (March to May; natural light and temperatures, no vernalization). For full environmental details, see Supplemental Table S1. The genetic positions of the previously identified homologs of VRN1, VRN2, and FT are indicated (compare Higgins et al., 2010, and Ream et al., 2012).
Figure 6.
Figure 6.
Phenotype-by-genotype plot for the two major loci controlling flowering time in the ABR6 × Bd21 mapping population. Days to flowering in environment 3 for the ABR6 × Bd21 F4:5 families homozygous at qFLT1 and qFLT6 shows that the Bd21 alleles at these two loci promote early flowering. Error bars represent 1 se; NF, not flowering.
Figure 7.
Figure 7.
Comparison of the flowering regulators FT and VRN2 between the B. distachyon accessions Bd21 and ABR6. Contigs of the ABR6 de novo assembly were aligned to the Bd21 reference sequence (version 3), and polymorphisms were identified in the genes of interest and 2-kb promoter and terminator sequences (1.9-kb promoter for VRN2). Red ticks represent SNPs, and black ticks represent insertions/deletions (indels). The length of indels (bp) is shown with + for insertion and – for deletion. The amino acid change of the nonsynonymous SNP in VRN2 is indicated. s = synonymous SNP; dashed line = promoter or terminator; white box = 5′ untranslated region (UTR) or 3′ UTR; black box = exon; black line = intron; M = Met/translation start; star = translation stop; black bar under VRN2 = CCT domain.
Figure 8.
Figure 8.
VRN1, VRN2, and FT expression in the fourth leaf of ABR6 and Bd21 after varying periods of cold treatment. Seeds were imbibed with water and not vernalized or vernalized for 2, 4, or 6 weeks and transferred to a growth chamber with parameters similar to environment 2. Fully expanded fourth leaves were harvested in the middle of the photoperiod. Relative gene expression of VRN1 (A), VRN2 (B), and FT (C) was determined using reverse transcription-quantitative PCR and analyzed using the 2−ΔΔCt method. All genes were normalized to 1 based on Bd21 expression with no cold treatment (0 weeks), and UBIQUITIN-CONJUGATING ENZYME18 was used as an internal control. Bars represent means of three biological replicates, with error bars showing 1 se. Different letters represent statistically significant differences based on pairwise Student’s t tests using a multiple hypothesis-corrected P value threshold of 0.05 with the Benjamini-Hochberg approach (Benjamini and Hochberg, 1995).

References

    1. Amasino R. (2010) Seasonal and developmental timing of flowering. Plant J 61: 1001–1013 - PubMed
    1. Andrés F, Coupland G (2012) The genetic basis of flowering responses to seasonal cues. Nat Rev Genet 13: 627–639 - PubMed
    1. Barbieri M, Marcel TC, Niks RE, Francia E, Pasquariello M, Mazzamurro V, Garvin DF, Pecchioni N (2012) QTLs for resistance to the false brome rust Puccinia brachypodii in the model grass Brachypodium distachyon L. Genome 55: 152–163 - PubMed
    1. Basten CJ, Weir BS, Zeng ZB (2004) QTL Cartographer, version 1.17. Department of Statistics, North Carolina State University, Raleigh, NC
    1. Benjamini Y, Hochberg Y (1995) Controlling the false discovery rate: a practical and powerful approach to multiple testing. J R Stat Soc Series B Stat Methodol 57: 289–300

Publication types

LinkOut - more resources