. 2016 Sep 21:6:33719.
doi: 10.1038/srep33719.

Photobiomodulation (blue and green light) encourages osteoblastic-differentiation of human adipose-derived stem cells: role of intracellular calcium and light-gated ion channels

Affiliations

Photobiomodulation (blue and green light) encourages osteoblastic-differentiation of human adipose-derived stem cells: role of intracellular calcium and light-gated ion channels

Yuguang Wang et al. Sci Rep. .

Abstract

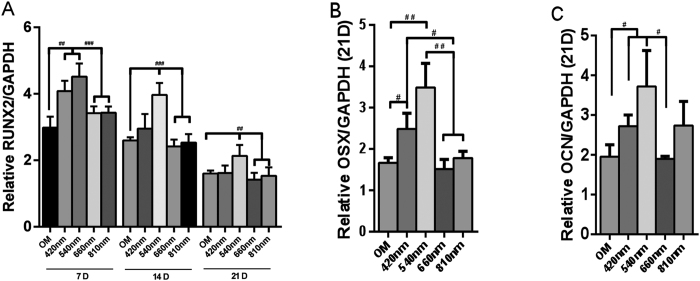
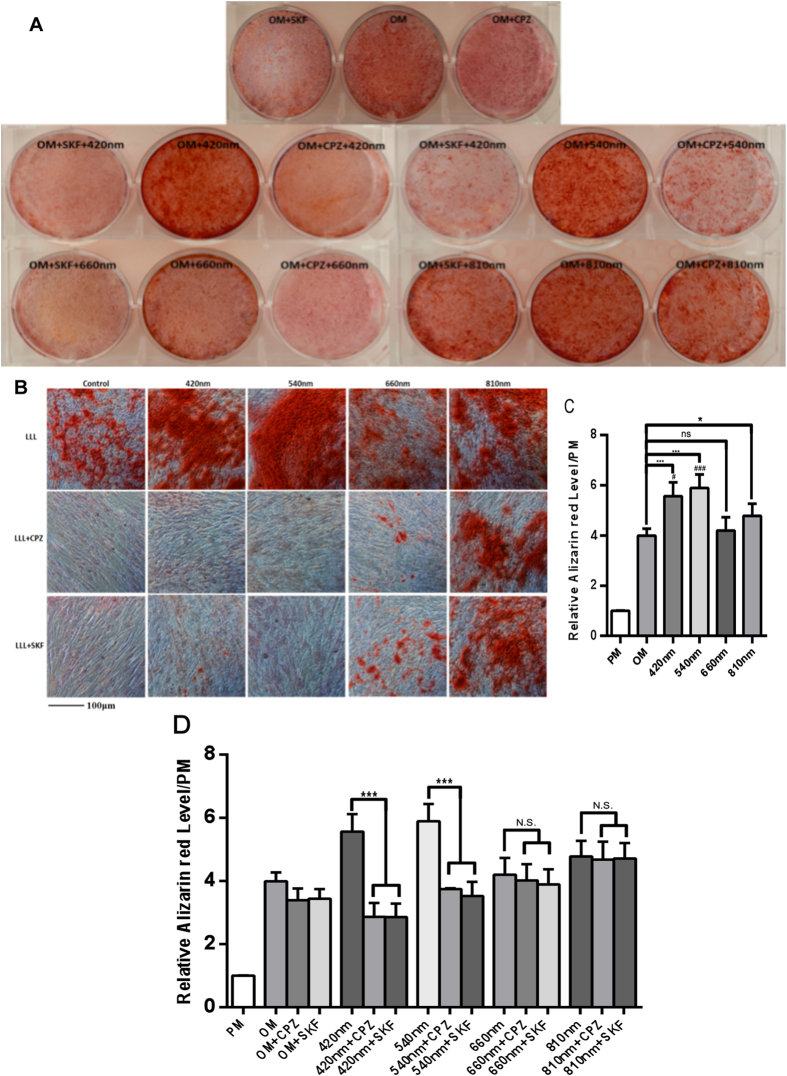
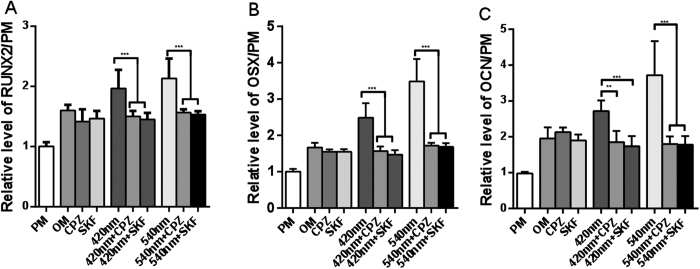
Human adipose-derived stem cells (hASCs) have the potential to differentiate into several different cell types including osteoblasts. Photobiomodulation (PBM) or low level laser therapy (LLLT) using red or near-infrared wavelengths has been reported to have effects on both proliferation and osteogenic differentiation of stem cells. We examined the effects of delivering four different wavelengths (420 nm, 540 nm, 660 nm, 810 nm) at the same dose (3 J/cm(2)) five times (every two days) on hASCs cultured in osteogenic medium over three weeks. We measured expression of the following transcription factors by

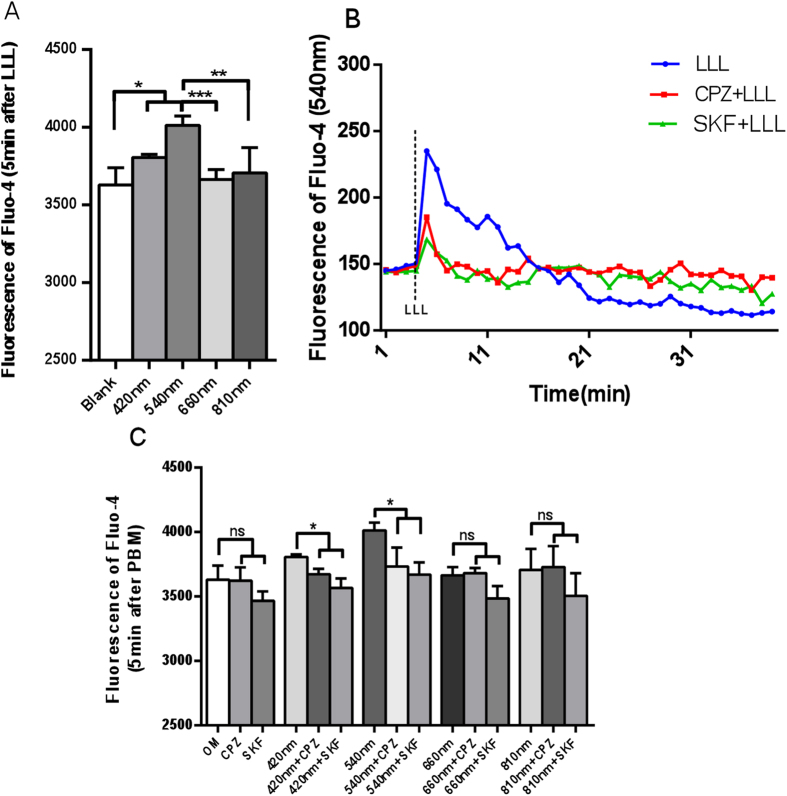
Rt-pcr: RUNX2, osterix, and the osteoblast protein, osteocalcin. The 420 nm and 540 nm wavelengths were more effective in stimulating osteoblast differentiation compared to 660 nm and 810 nm. Intracellular calcium was higher after 420 nm and 540 nm, and could be inhibited by capsazepine and SKF96365, which also inhibited osteogenic differentiation. We hypothesize that activation of light-gated calcium ion channels by blue and green light could explain our results.


Figures

Figure 1
Figure 1
Quantitative evaluation of mRNA levels via real-time PCR of RUNX2 (A), OSX (B) and OCN (C) after 4 different wavelengths (420, 540, 660 and 810 nm) PBM. Data are expressed as mean ± SD. Experiments were carried out using two dishes each in three experiments (n = 6). #p < 0.05, ##p < 0.01, ###p < 0.001.
Figure 2
Figure 2
(A) Alizarin red stain was added into cell cultures in osteogenic medium after photobiomodulation at a dose of 3 J/cm2 five times (every two days) with or without CPZ or SKF pretreatment. The alizarin red staining was measured after 21 days to determine the level of mineralization. Pre-incubation with CPZ (5 μM) and SKF (5 μM) for 10 minutes before photobiomodulation reduced the effect of photobiomodulation in 420 nm and 540 nm groups, to a lesser extent in the 660 nm group, but not in the 810 nm group. (B) Images of alizarin red staining taken by microscope. A higher intensity of alizarin red after 420 nm and 540 nm groups, while the intensity of 420 nm and 540 nm +CPZ/SKF groups was similar to the control group. (C,D) Quantitative evaluation of calcium deposits using Alizarin red staining. hASCs were treated or not with the TRP channel inhibitors CPZ (5 μM) and SKF (5 μM) for 10 minutes before each application of photobiomodulation. Data are expressed as mean ± SD. Experiments have been carried out for 3 times (n = 8). *,#P < 0.05, ***,###P < 0.001.
Figure 3
Figure 3. CPZ and SKF blocked the increase of intracellular calcium in hASCs cultured in OM caused by 420 nm or 540 nm.
(A) Effects of four different wavelengths on intracellular calcium measured immediately. (B) Time course of intracellular calcium after 540 nm with or without CPZ or SKF. (C) Quantitative analysis for intracellular calcium with or without CPZ (5 μM) or SKF (5 μM) pretreated before photobiomodulation using all four wavelengths.
Figure 4
Figure 4. Effects of TRP inhibitors on osteogenic gene expression stimulated by 420 nm or 540 nm photobiomodulation.
(A) Quantitative analysis for gene expression level of RUNX2. The data of RUNX2 expression are shown at day 21; data at days 7 and 14 are not shown. (B) Quantitative analysis for gene expression level of OSX at day 21. (C) Quantitative analysis for gene expression level of OCN at day 21. Data represent means ± SD of the number of determinations (n = 4 or 6, *P <0 .05, **P < 0.01, ***P < 0.001).

References

    1. Feisst V., Meidinger S. & Locke M. B. From bench to bedside: use of human adipose-derived stem cells. Stem Cells Cloning 8, 149–162, 10.2147/SCCAA.S64373 (2015). - DOI - PMC - PubMed
    1. Kolaparthy L. K., Sanivarapu S., Moogla S. & Kutcham R. S. Adipose Tissue - Adequate, Accessible Regenerative Material. Int J Stem Cells 8, 121–127, 10.15283/ijsc.2015.8.2.121 (2015). - DOI - PMC - PubMed
    1. Woo D. H., Hwang H. S. & Shim J. H. Comparison of adult stem cells derived from multiple stem cell niches. Biotechnol Lett , 10.1007/s10529-016-2050-2 (2016). - DOI - PubMed
    1. Calori G. M., Mazza E., Colombo M. & Ripamonti C. The use of bone-graft substitutes in large bone defects: any specific needs? Injury 42 Suppl 2, S56–S63, 10.1016/j.injury.2011.06.011 (2011). - DOI - PubMed
    1. Sen M. K. & Miclau T. Autologous iliac crest bone graft: should it still be the gold standard for treating nonunions? Injury 38 Suppl 1, S75–S80, 10.1016/j.injury.2007.02.012 (2007). - DOI - PubMed

Publication types