. 2016 Sep 21:6:33736.
doi: 10.1038/srep33736.

MBD3 expression and DNA binding patterns are altered in a rat model of temporal lobe epilepsy

Affiliations

MBD3 expression and DNA binding patterns are altered in a rat model of temporal lobe epilepsy

Joanna Bednarczyk et al. Sci Rep. .

Abstract

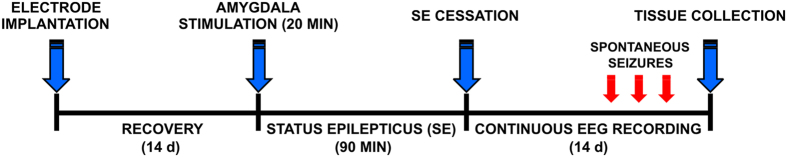
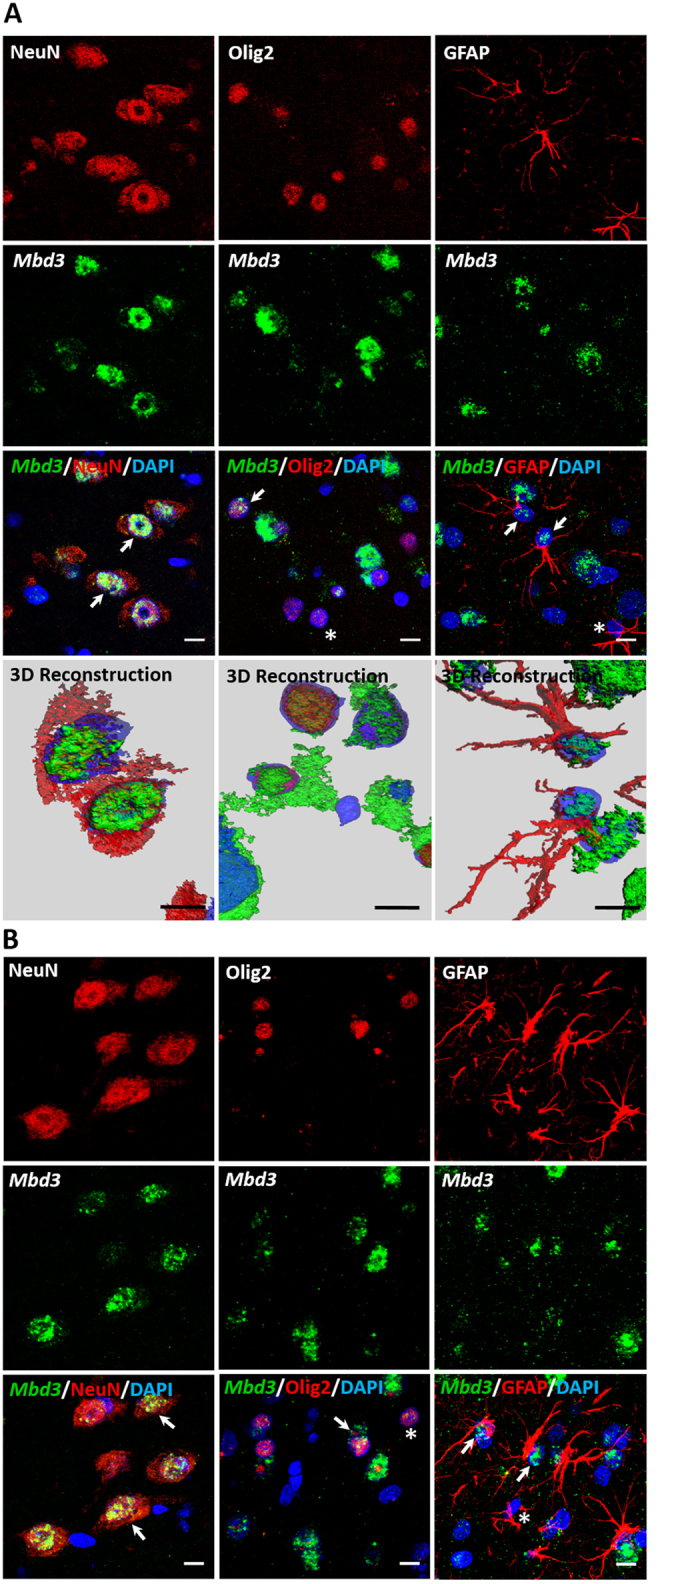
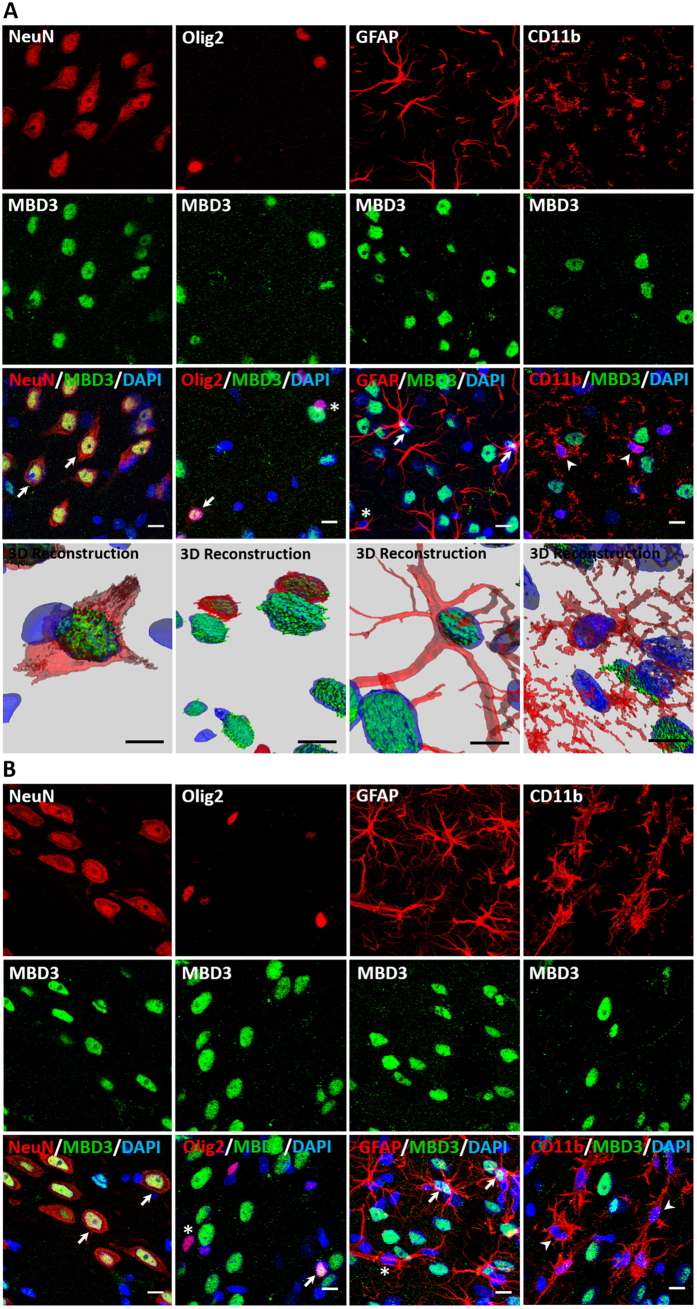
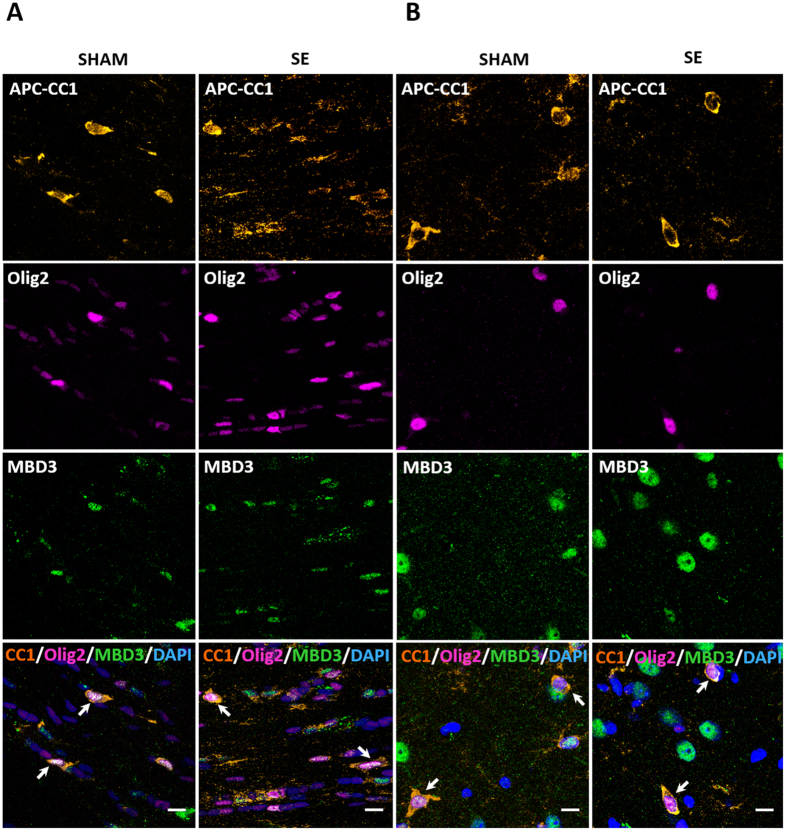
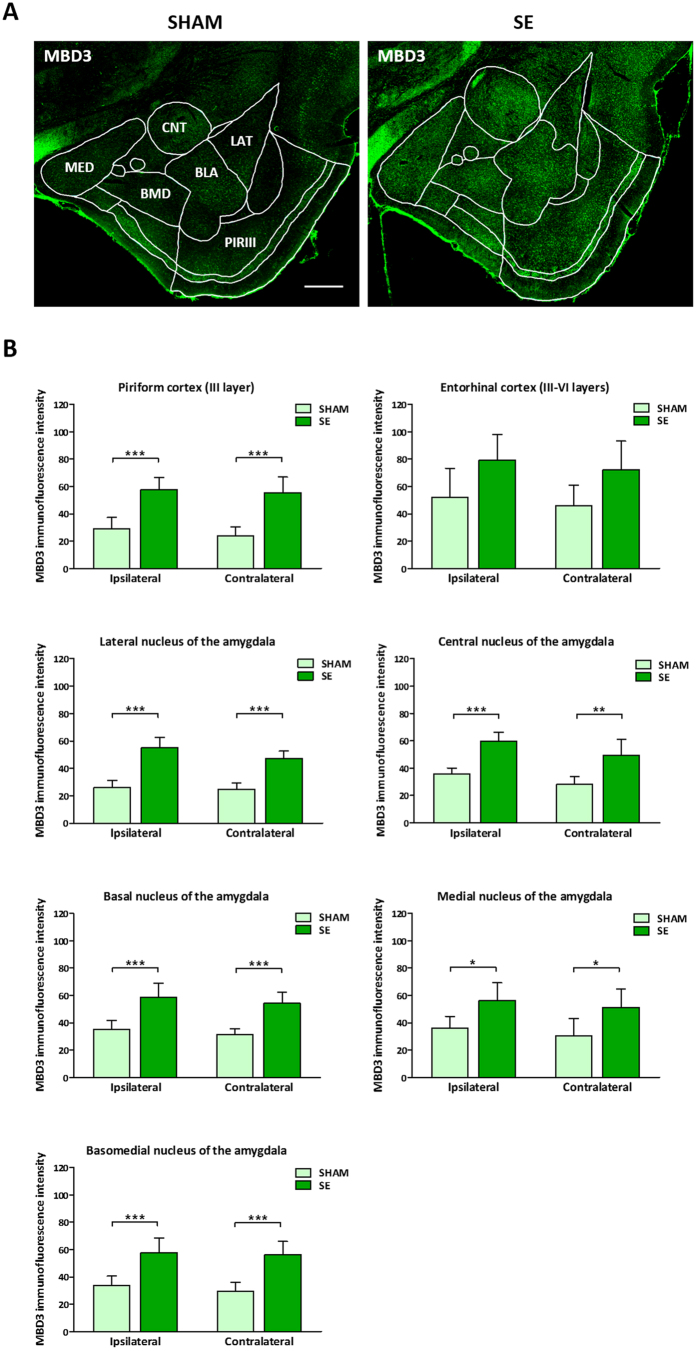
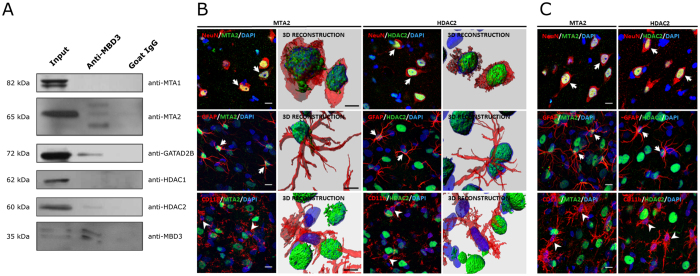
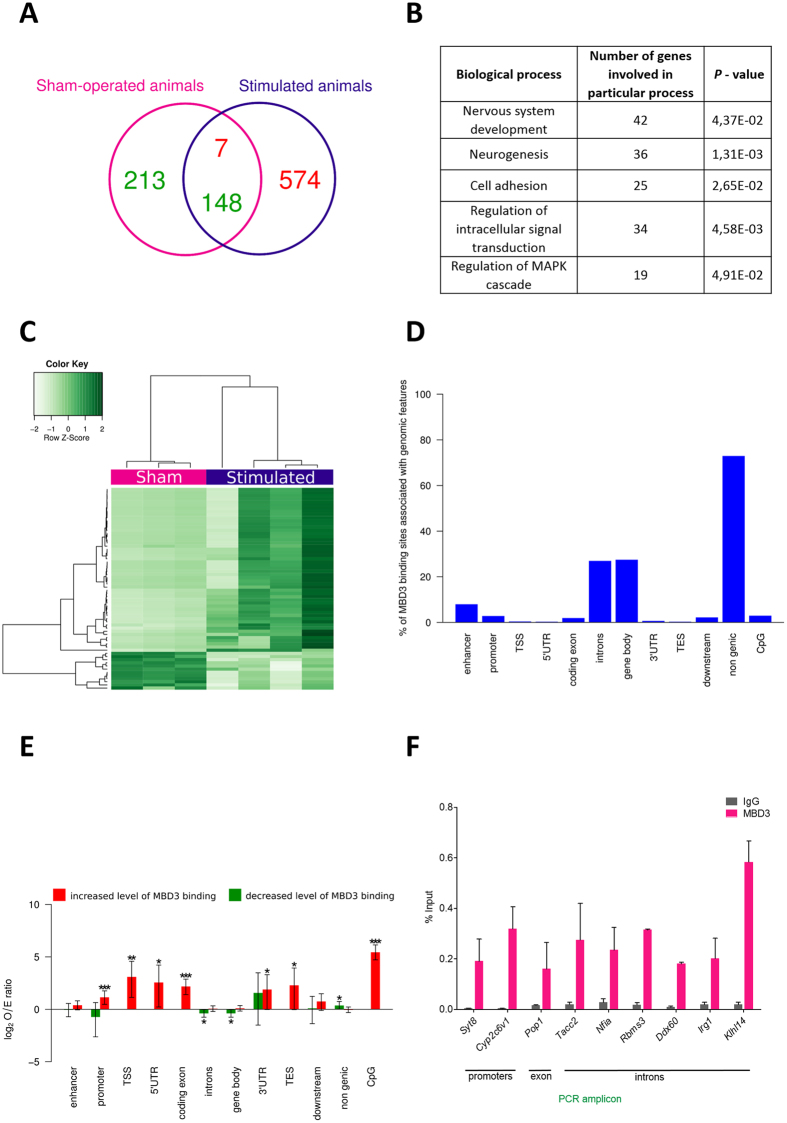
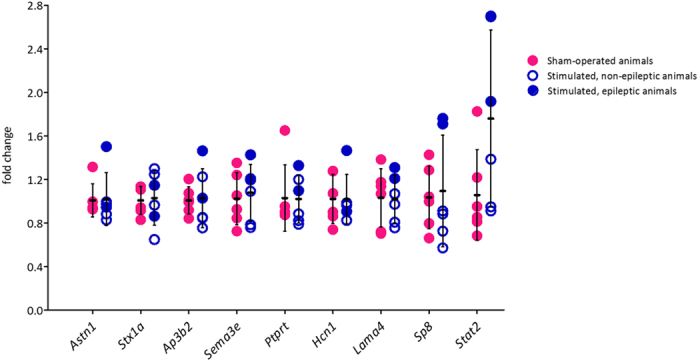
The aim of the present study was to examine involvement of MBD3 (methyl-CpG-binding domain protein 3), a protein involved in reading DNA methylation patterns, in epileptogenesis and epilepsy. We used a well-characterized rat model of temporal lobe epilepsy that is triggered by status epilepticus, evoked by electrical stimulation of the amygdala. Stimulated and sham-operated animals were sacrificed 14 days after stimulation. We found that MBD3 transcript was present in neurons, oligodendrocytes, and astrocytes in both control and epileptic animals. We detected the nuclear localization of MBD3 protein in neurons, mature oligodendrocytes, and a subpopulation of astrocytes but not in microglia. Amygdala stimulation significantly increased the level of MBD3 immunofluorescence. Immunoprecipitation followed by mass spectrometry and Western blot revealed that MBD3 in the adult brain assembles the NuRD complex, which also contains MTA2, HDAC2, and GATAD2B. Using chromatin immunoprecipitation combined with deep sequencing, we observed differences in the occupancy of DNA regions by MBD3 protein between control and stimulated animals. This was not followed by subsequent changes in the mRNA expression levels of selected MBD3 targets. Our data demonstrate for the first time alterations in the MBD3 expression and DNA occupancy in the experimental model of epilepsy.


Figures

Figure 1
Figure 1. Experimental design.
Animals underwent electrode implantation and after 14 d recovery status epilepticus was evoked by amygdala stimulation. Status epilepticus was stopped 90 min after stimulation by injection of diazepam. The rats were continuously monitored by video electroencephalography to detect spontaneous epileptic seizures until the end of experiment. Tissue for subsequent analyses was collected 14 d after stimulation.
Figure 2
Figure 2. Expression pattern of Mbd3 mRNA in normal and stimulated rat brain.
Cellular localization of Mbd3 transcript in the piriform cortex in sham-operated rats (A) and amygdala-stimulated rats 14 days after status epilepticus (B). Representative confocal microscopy images show Mbd3 mRNA (green), detected by in situ hybridization, and neuronal cells, oligodendrocytes, and astrocytes (red), detected by immunohistochemistry using NeuN, Olig2, and GFAP antibodies, respectively. Cell nuclei were counterstained with DAPI (blue). Typical examples of triple-labeled cells are indicated by arrows. Olig2- and GFAP-positive cells that lack Mbd3 mRNA are marked with asterisks. DAPI. 4,6-diamidino-2-phenylindole; GFAP, glial fibrillary acidic protein; NeuN, neuron-specific nuclear protein; Olig2, oligodendrocyte lineage transcription factor 2. Scale bar = 10 μm.
Figure 3
Figure 3. Cellular localization of MBD3 protein in normal and epileptic rat brain.
MBD3 immunofluorescence in different cell types in the piriform cortex in sham-operated rats (A) and epileptic rats 14 days after amygdala stimulation (B). Representative confocal microscopy images show MBD3 immunostaining (green) and neuronal cells, oligodendrocytes, astrocytes, and microglia (red), detected by immunohistochemistry using NeuN, Olig2, GFAP, and CD11b antibodies, respectively. Cell nuclei were counterstained with DAPI (blue). Typical examples of triple-labeled cells are indicated by arrows. Olig2- and GFAP-positive cells that lack MBD3 protein are marked with asterisks. Examples of microglial cells that do not express MBD3 protein are indicated by arrowheads. CD11b, cluster of differentiation molecule 11B, integrin αM chain; DAPI, 4,6-diamidino-2-phenylindole; GFAP, glial fibrillary acidic protein; MBD3, methyl-CpG binding domain protein 3; NeuN, neuron-specific nuclear protein; Olig2, oligodendrocyte lineage transcription factor 2. Scale bar = 10 μm.
Figure 4
Figure 4. Characterization of oligodendrocytes that express MBD3 protein in the brain.
MBD3 protein in oligodendrocytes in white matter in the corpus callosum (A) and piriform cortex (B). Representative confocal microscopy images of both normal and amygdala-stimulated rats show MBD3 immunoreactivity (green), Olig2-positive oligodendrocytes (magenta), and APC-CCI-positive mature oligodendrocytes (orange). Cell nuclei were counterstained with DAPI (blue). Typical examples of mature oligodendrocytes that express MBD3 are indicated by arrows. APC-CC1, adenomatous polyposis coli; DAPI, 4,6-diamidino-2-phenylindole; MBD3, methyl-CpG binding domain protein 3; Olig2, oligodendrocyte lineage transcription factor 2. Scale bar = 10 μm.
Figure 5
Figure 5. Level of MBD3 immunofluorescence in normal vs. epileptic animals.
(A) Representative images of temporal lobe structures in sham-operated and epileptic rats, immunostained with MBD3 antibody (green). (B) Quantitative analysis of immunofluorescence levels in selected structures in control and epileptic animals. The data are expressed as the relative level of MBD3 immunoreactivity ± SD. n = 5. *P < 0.05, **P < 0.01, ***P < 0.001 (two-way ANOVA). BLA, basolateral nucleus of the amygdala; BMD, basomedial nucleus of the amygdala; CNT, central nucleus of the amygdala; LAT, lateral nucleus of the amygdala; MBD3, methyl-CpG binding domain protein 3; MED, medial nucleus of the amygdala; PIRIII, piriform cortex. Scale bar = 500 μm.
Figure 6
Figure 6. Composition of MBD3-containing complex and cellular localization of NuRD subunits in the brain.
(A) Representative immunoblotting with antibodies directed against MTA1, MTA2, HDAC1, HDAC2, and GATAD2B proteins in lysates of temporal lobe structures subjected to immunoprecipitation with MBD3 antibody. (B) Cellular localization of MTA2 and HDAC2 proteins in the piriform cortex in sham-operated animals. (C) Cellular localization of MTA2 and HDAC2 proteins in the piriform cortex in epileptic rats 14 days after amygdala stimulation. (B,C) Representative confocal microscopy images show MTA2 and HDAC2 proteins (green) and neuronal cells, astrocytes, and microglia (red), detected by immunohistochemistry using NeuN, GFAP, and CD11b antibodies, respectively. Cell nuclei were counterstained with DAPI (blue). Typical examples of triple-labeled cells are indicated by arrows. Examples of microglial cells that do not express MTA2 and HDAC2 proteins are indicated by arrowheads. CD11b, cluster of differentiation molecule 11B, integrin αM chain; DAPI, 4,6-diamidino-2-phenylindole; GATAD2B, GATA zinc finger domain containing 2B; GFAP, glial fibrillary acidic protein; HDAC2, histone deacetylase 2; MBD3, methyl-CpG binding domain protein 3; MTA1, metastasis associated 1 family, member 1; MTA2, metastasis associated 1 family, member 2; NeuN, neuron-specific nuclear protein;. Scale bars = 10 μm. Full length scans of Western Blots used for images cropped to the Fig. 6 are presented in Supplementary Figure 1.
Figure 7
Figure 7. MBD3 DNA binding in control and amygdala-stimulated rats.
(A) Venn diagram showing numbers of DNA regions occupied by MBD3 in sham-operated (magenta) and stimulated (dark blue) rats. Regions with increases and decreases in MBD3 occupancy in stimulated animals are indicated in red and green, respectively. (B) Functional annotation of genes associated with sites that were differentially occupied by MBD3 in control and stimulated animals. (C) Heatmap of DNA regions that were differentially occupied by MBD3 in control and stimulated animals (FDR < 0.1). Each column represents an individual animal, and each row represents the genome region. Colors on the heatmap represent the Z-score, with relatively high (dark green) and relatively low (light green) levels of MBD3 binding to DNA. (D) Distribution of sites differentially (cut-off P < 0.01) occupied by MBD3 in stimulated animals in defined genomic features (TSS, TES, gene body, exon, intron, UTR, downstream, enhancer, promoter, CpG, and non-genic). Notice that a single peak can overlap with more than one type of feature in this analysis. (E) Frequency of observed MBD3 binding changes (cut-off P < 0.01) in stimulated animals compared with sites with no changes in MBD3 binding, with upper and lower 95% confidence intervals for defined genomic features. Increased binding of MBD3 relative to controls is coded with red bars, and decreased binding of MBD3 relative to controls is coded with green bars. O/E, observed/expected ratio. *P < 0.05, **P < 0.01, ***P < 0.001 (Fisher’s Exact test). (F) qPCR validation of MBD3 binding at nine selected target loci in sham-operated rats. Average Ct values for individual ChIP and IgG controls are expressed as a percentage of input ± SD.
Figure 8
Figure 8. mRNA expression levels for selected genes with altered MBD3 binding status in control vs. stimulated rats.
mRNA expression in the temporal lobe in sham-operated (magenta) and stimulated (dark blue) rats was evaluated with qRT-PCR. The data were normalized to Hprt1 expression levels and are expressed as fold changes in expression ± SD. n = 6. The data were analyzed by two-tailed t-test.

Similar articles

Cited by

References

    1. Porter R. J. In A textbook of epilepsy (eds Laidlaw J. et al.) 1–22 (Churchil Livingstone, 1993).
    1. Hauser W. A. In Epilepsy: a Comprehensive Textbook (eds Engel J. Jr & Pedley T. A.) 47–57 (Lippincott-Raven Publishers, 1997).
    1. Pitkanen A. & Sutula T. P. Is epilepsy a progressive disorder? Prospects for new therapeutic approaches in temporal-lobe epilepsy. Lancet Neurol 1, 173–181 (2002). - PubMed
    1. Pitkanen A. & Lukasiuk K. Mechanisms of epileptogenesis and potential treatment targets. Lancet Neurol 10, 173–186 (2011). - PubMed
    1. Pitkänen A., Lukasiuk K., Dudek F. E. & Staley K. J. Epileptogenesis. Cold Spring Harb Perspect Med 5, doi: 10.1101/cshperspect.a022822 (2015). - DOI - PMC - PubMed

Publication types

MeSH terms

LinkOut - more resources