. 2016 Sep 21:7:12918.
doi: 10.1038/ncomms12918.

The DNA cytosine deaminase APOBEC3H haplotype I likely contributes to breast and lung cancer mutagenesis

Affiliations

The DNA cytosine deaminase APOBEC3H haplotype I likely contributes to breast and lung cancer mutagenesis

Gabriel J Starrett et al. Nat Commun. .

Abstract

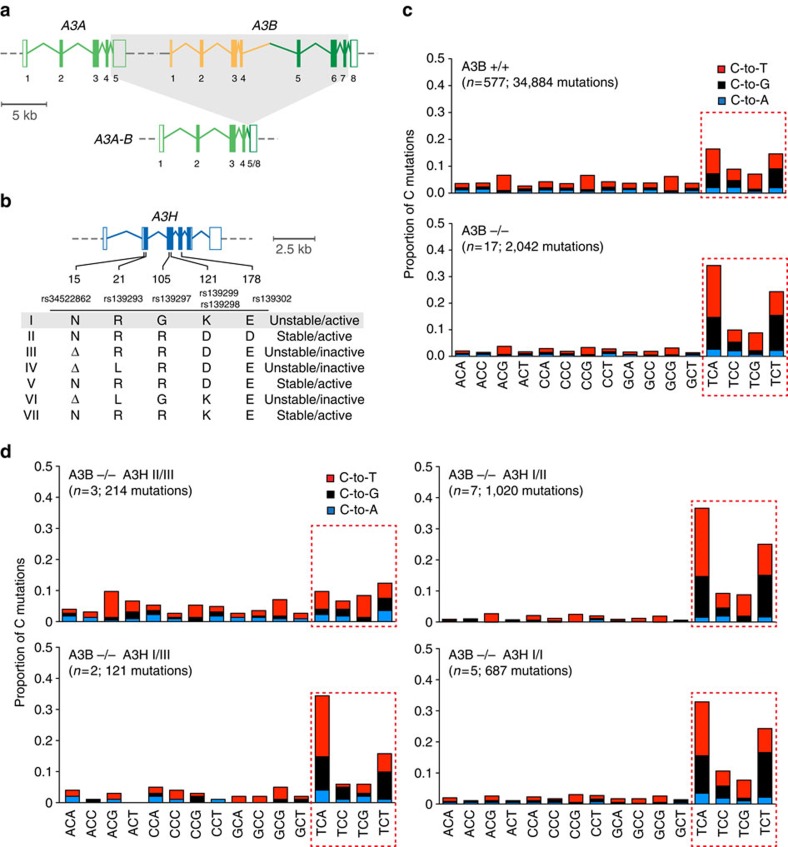
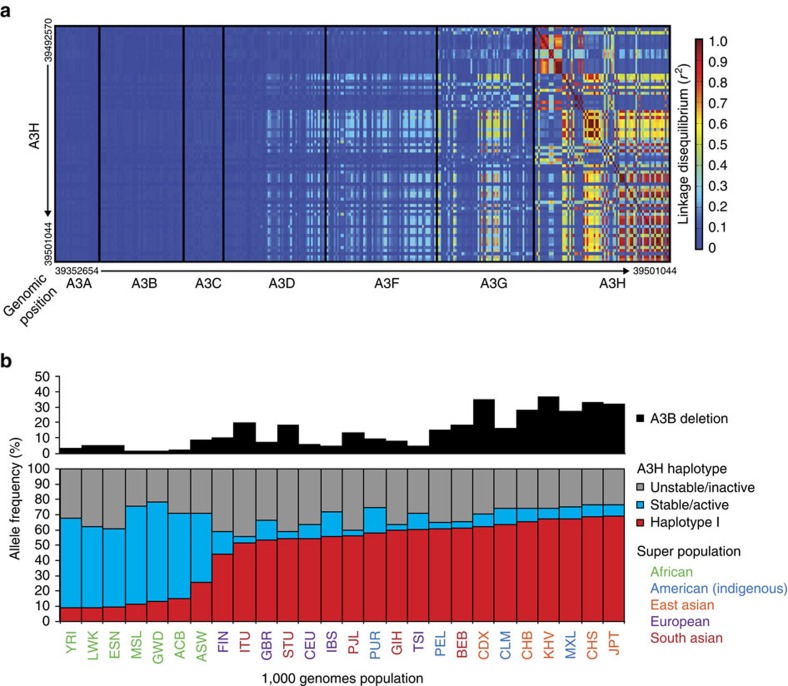
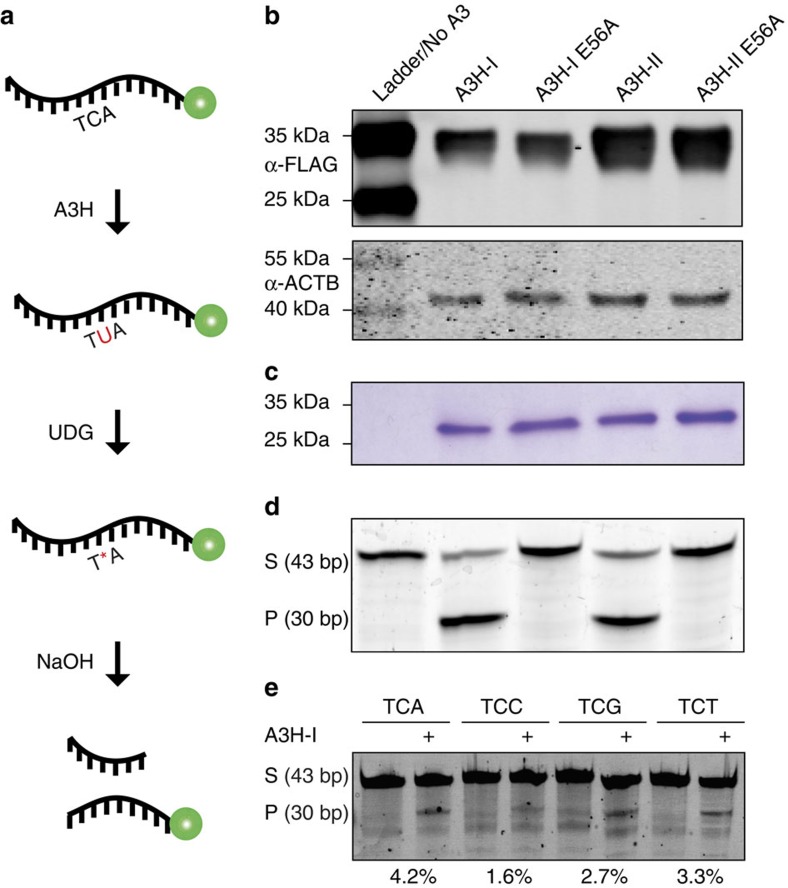
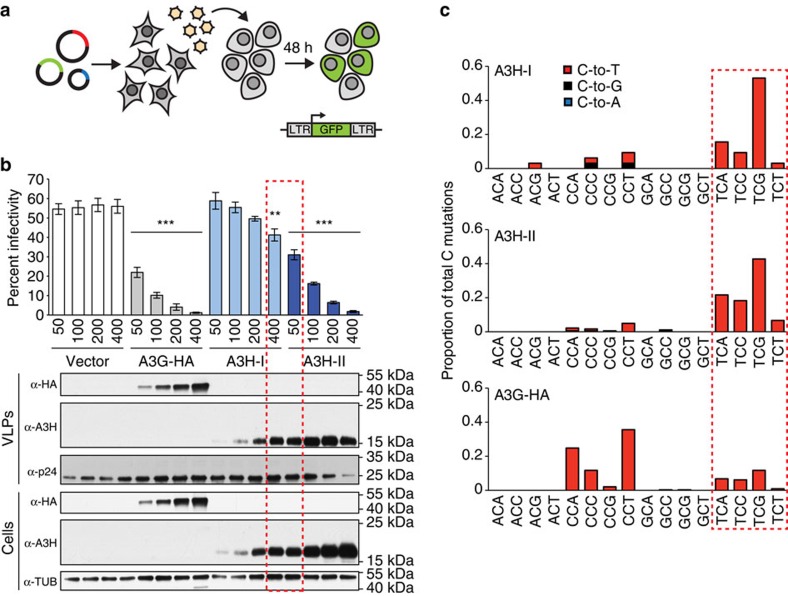
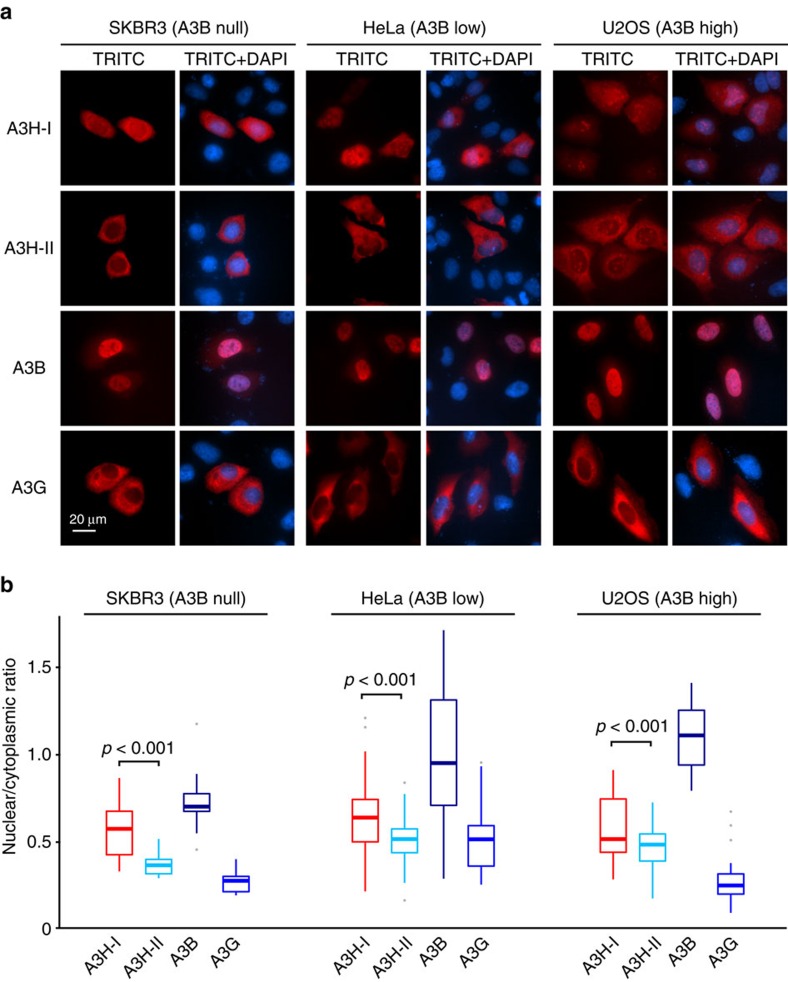
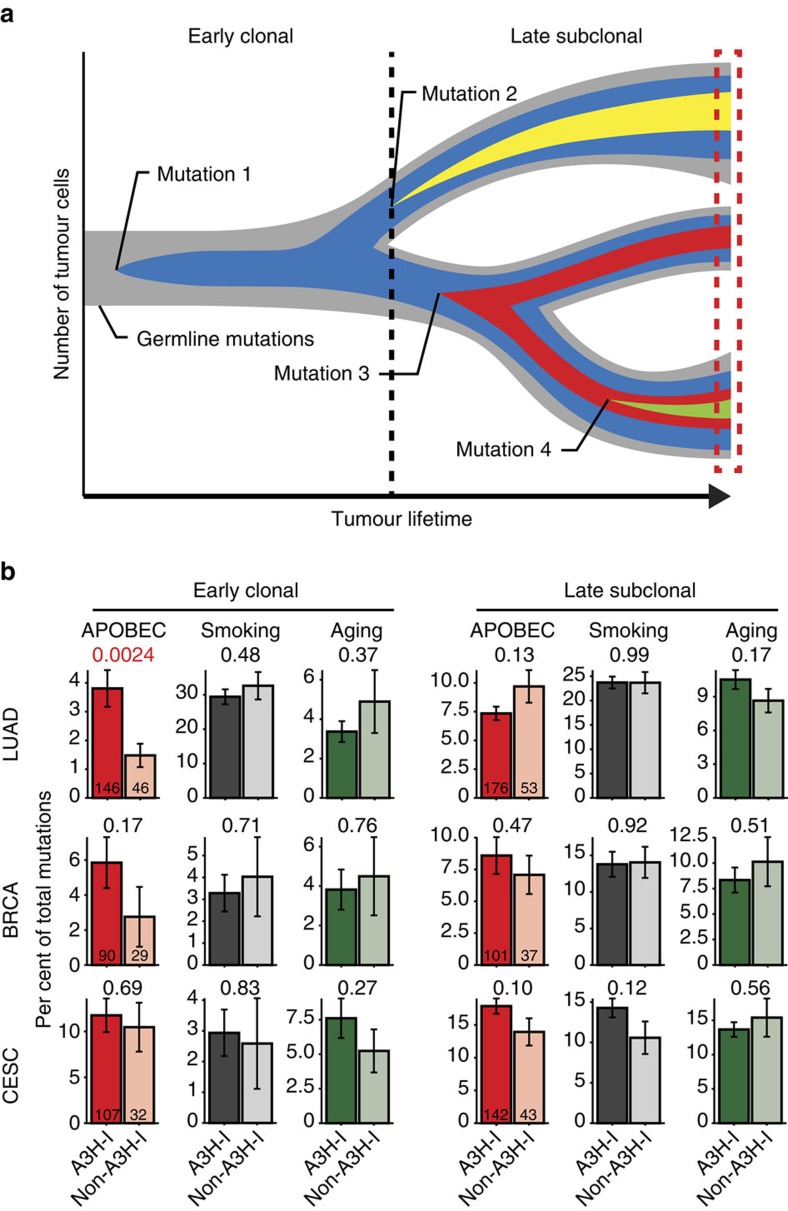
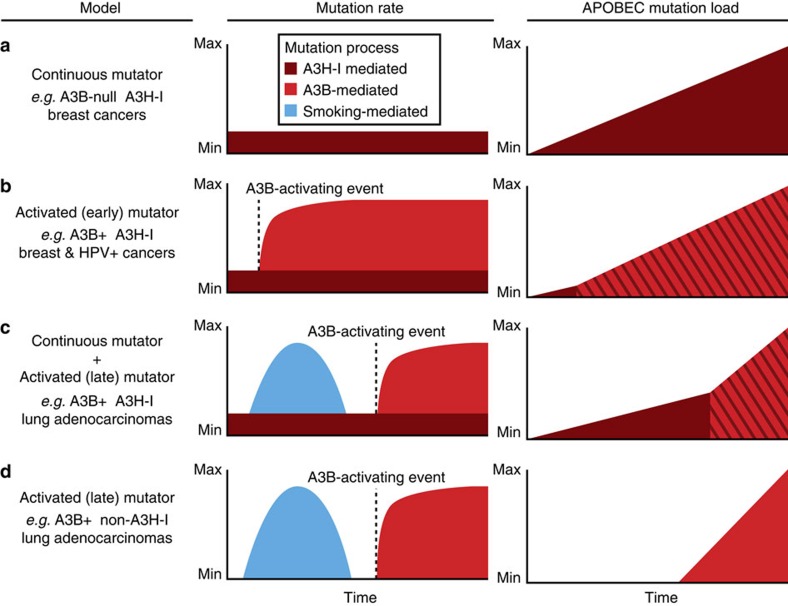
Cytosine mutations within TCA/T motifs are common in cancer. A likely cause is the DNA cytosine deaminase APOBEC3B (A3B). However, A3B-null breast tumours still have this mutational bias. Here we show that APOBEC3H haplotype I (A3H-I) provides a likely solution to this paradox. A3B-null tumours with this mutational bias have at least one copy of A3H-I despite little genetic linkage between these genes. Although deemed inactive previously, A3H-I has robust activity in biochemical and cellular assays, similar to A3H-II after compensation for lower protein expression levels. Gly105 in A3H-I (versus Arg105 in A3H-II) results in lower protein expression levels and increased nuclear localization, providing a mechanism for accessing genomic DNA. A3H-I also associates with clonal TCA/T-biased mutations in lung adenocarcinoma suggesting this enzyme makes broader contributions to cancer mutagenesis. These studies combine to suggest that A3B and A3H-I, together, explain the bulk of 'APOBEC signature' mutations in cancer.


Figures

Figure 1
Figure 1. A3H haplotype I accounts for APOBEC signature mutations in A3B-null breast tumours.
(a) Schematic of A3A, A3B and the A3A-B fusion gene. Exons are numbered and indicated by boxes, and coding regions are shaded. A 5 kbp scale is indicated. (b) Schematic of the A3H gene with haplotype-defining amino acid variants and SNP numbers listed below. Labelled as in a, except the scale indicates 2.5 kbp. (c) Bar plots depicting the proportions of cytosine mutations occurring in the indicated trinucleotide motifs in A3B+/+ and A3B−/− breast tumors with n-values and total mutation numbers in parentheses. C-to-T, C-to-G and C-to-A are represented by red, black and blue shading, respectively. (d) Bar plots depicting the proportions of cytosine mutations occurring in the indicated trinucleotide motifs in A3B−/− breast cancers with the indicated A3H haplotype combinations (n-values and total mutation numbers in parentheses). C-to-T, C-to-G and C-to-A are represented by red, black and blue shading, respectively.
Figure 2
Figure 2. Polymorphisms in A3H are not in linkage disequilibrium with A3A or A3B.
(a) Heatmap showing the strength of linkage (r2) of SNPs located within the A3H gene versus the rest of the APOBEC3 locus. (b) Bar plots of the A3B deletion and A3H haplotype frequencies for the indicated populations (A3H-I in red; stable A3H-II/V/VII in blue and unstable A3H-III/IV/VI in grey). Superpopulations are colour coded for visualization of larger geographic areas, and individual 3-letter population identifiers are from the 1000 genomes project.
Figure 3
Figure 3. A3H haplotype I is an active DNA cytosine deaminase.
(a) Schematic of the ssDNA deamination assay. A3H-mediated deamination yields a uracil that, on excision by excess uracil DNA glycosylase, is converted into a hydroxide-labile abasic site. (b) Anti-FLAG immunoblot of A3H-I, A3H-II and catalytic mutant derivatives expressed in 293T cells prior to purification, with an anti-ACTB immunoblot shown below as a loading control. (c) Image of a Coomassie-stained gel with approximately equal amounts of A3H-I, A3H-II and catalytic mutant derivatives purified from 293T cells. (d) Activity data for the recombinant A3H proteins shown in c (P, product; S, substrate). (e) Activity of GST-A3H-I purified from insect cells using the indicated trinucleotide containing ssDNA substrates (P, product; S, substrate).
Figure 4
Figure 4. A3H haplotype I has enzymatic activity against viral DNA.
(a) HIV-1 infectivity assay. Viral and A3 expression vectors are transfected into 293 producer cells and, after 48 h, virus-containing supernatants are titered by infecting CEM-GFP reporter cells in which an integrated LTR-GFP cassette is activated by the Tat protein expressed from newly integrated viruses. Infectivity is quantified by flow cytometry and calculating the percentage of GFP-positive reporter cells. (b) Mean and s.e.m. plotted for three biological replicates of HIV-1 infectivity data for Vif-deficient viruses produced in 293 cells expressing a vector control, A3G-HA, A3H-I or A3H-II (*P<0.05, **P<0.01, ***P<0.001, Welch's two sided t-test). Immunoblots for the indicated proteins in cell lysates and virus containing supernatants are shown below. (c) C-to-T mutation distribution in viral DNA sequences recovered from CEM-GFP reporter cells. C-to-T, C-to-G and C-to-A are represented by red, black and blue shading, respectively. The mutations are reported for the viral cDNA strand, rather than the conventional genomic strand to facilitate comparisons with tumours.
Figure 5
Figure 5. A3H haplotype I has greater nuclear localization than haplotype II.
(a) Representative images of A3H-I (untagged), A3H-II (untagged), A3B-HA and A3G-HA in SK-BR-3, HeLa and U2OS cells. The 20 μm scale applies to all images. (b) Whisker plots quantifying the subcellular localization data as nuclear-to-cytoplasmic ratios for n>50 cells per condition. The average is shown, the error box represents the first and third quartiles, and the whiskers extend to the highest value within 1.5 × the interquartile range (P values determined by two-tailed Welch's t-test).
Figure 6
Figure 6. A3H haplotype I contributes APOBEC signature mutations to lung cancer.
(a) Tree-based cartoon of tumour evolution. To represent the heterogeneity of each tumour deep sequencing data set (boxed area), 1 trunk mutation (blue) and 3 branch mutations (other colours) are depicted on a background of normal germline DNA (grey). Trunk mutations occur early and are found in every tumour branch, whereas branch mutations occur later in one or more branches (that is, clonal versus subclonal). (b) Bar plots showing the frequency of clonal and subclonal mutations in the indicated cancer types attributable to APOBEC, smoking and ageing (BRCA, breast cancer; CESC, cervical cancer; LUAD, lung adenocarcinoma). Each bar represents the average proportion ±SEM of signature mutations occurring within each A3H haplotype group (that is, A3H-I versus non-A3H-I). The total number of tumours with 1 or 2 copies of G105 (A3H-I) or 2 copies of R105 (A3H-II and other haplotypes) is indicated within the first set of histogram bars. Welch's two-tailed t-test for each category was used to calculate the P value above each graph.
Figure 7
Figure 7. Models for differential APOBEC mutation accumulation in cancer.
The far left column describes the A3B and A3H-I genotypes of each model as well as examples of relevant tumour types. The middle columns show the average mutation rate over time for each model with sources of mutations highlighted in different colours, smoking (blue), A3B (red) and A3H-I (maroon). The far right column depicts the accumulation of somatic APOBEC signature mutations over time, with mutations mediated by A3B and A3H-I represented in red and maroon, respectively. Somatic mutations from both APOBEC3 enzymes are shown as red/maroon diagonal stripes to highlight that these mutations are not easily distinguishable. (a) The continuous mutator model depicts constant A3H-I mediated mutagenesis and subsequent accumulation of APOBEC-signature mutations over time in the absence of A3B as may be occurring in some breast cancers. (b) The activated (early) mutator model depicts a rapid increase in A3B-mediated mutations and APOBEC signature mutations after an A3B-activating event such as HPV-infection in cervical cancers or a currently unknown mechanism in breast cancers. (c) The continuous mutator plus activated (late) mutator model depicts the constant accumulation of APOBEC-signature mutations mediated by A3H-I as shown in a. For contrast, the distinct contribution from smoking-mediated mutagenesis (blue) is shown as an early finite time period. Late activation of A3B then leads to a more rapid accumulation of APOBEC signature mutations over time effectively eclipsing the A3H-I contribution. (d) The activated (late) mutator model is nearly identical to the model shown in c, however the absence of A3H-I results in no early APOBEC-signature mutations as may be occurring in some lung adenocarcinomas.

References

    1. Kuong K. J. & Loeb L. A. APOBEC3B mutagenesis in cancer. Nat. Genet. 45, 964–965 (2013). - PMC - PubMed
    1. Helleday T., Eshtad S. & Nik-Zainal S. Mechanisms underlying mutational signatures in human cancers. Nat. Rev. Genet. 15, 585–598 (2014). - PMC - PubMed
    1. McGranahan N. & Swanton C. Biological and therapeutic impact of intratumor heterogeneity in cancer evolution. Cancer Cell 27, 15–26 (2015). - PubMed
    1. Roberts S. A. & Gordenin D. A. Hypermutation in human cancer genomes: footprints and mechanisms. Nat. Rev. Cancer 14, 786–800 (2014). - PMC - PubMed
    1. Nik-Zainal S. et al. Mutational processes molding the genomes of 21 breast cancers. Cell 149, 979–993 (2012). - PMC - PubMed

Publication types

LinkOut - more resources