. 2016 Sep 21:7:12938.
doi: 10.1038/ncomms12938.

Spatiotemporal dynamics of lesion-induced axonal sprouting and its relation to functional architecture of the cerebellum

Affiliations

Spatiotemporal dynamics of lesion-induced axonal sprouting and its relation to functional architecture of the cerebellum

Matasha Dhar et al. Nat Commun. .

Abstract

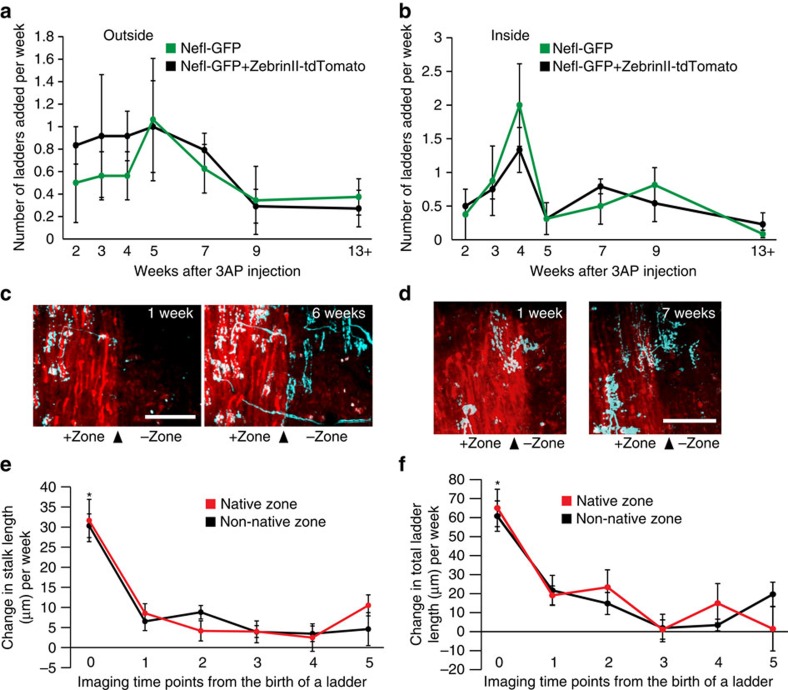
Neurodegenerative lesions induce sprouting of new collaterals from surviving axons, but the extent to which this form of axonal remodelling alters brain functional structure remains unclear. To understand how collateral sprouting proceeds in the adult brain, we imaged post-lesion sprouting of cerebellar climbing fibres (CFs) in mice using in vivo time-lapse microscopy. Here we show that newly sprouted CF collaterals innervate multiple Purkinje cells (PCs) over several months, with most innervations emerging at 3-4 weeks post lesion. Simultaneous imaging of cerebellar functional structure reveals that surviving CFs similarly innervate functionally relevant and non-relevant PCs, but have more synaptic area on PCs near the collateral origin than on distant PCs. These results suggest that newly sprouted axon collaterals do not preferentially innervate functionally relevant postsynaptic targets. Nonetheless, the spatial gradient of collateral innervation might help to loosely maintain functional synaptic circuits if functionally relevant neurons are clustered in the lesioned area.


Figures

Figure 1
Figure 1. CF morphology in the normal cerebellum and CF collateral sprouting induced by 3-AP injection into the inferior olive.
(a) Image of normal CFs in vivo from a Nefl-EGFP tg mouse (no 3-AP injection) as viewed from a window placed over lobule VII of cerebellar cortex using two-photon microscopy. All in vivo images (a,c,d) are maximum projections showing top-down views of CFs in the molecular layer. Scale bar, 100 μm. (b) Image of normal CFs in a fixed cerebellar slice from a Nefl-GFP tg mouse. View of CFs in the molecular layer in para-sagittal plane (left) and view of another CF in transverse plane (right). (c) Image of a CF ladder in vivo (left) and its trace (right) in which red line represents the main stalk and the blue lines emerging from the main stalk represent the rungs of the CF ladder. (d) A representative image of surviving CFs in vivo from a Nefl-EGFP tg mice 1 week after 3-AP injection as viewed from a window placed over lobule VII of cerebellar cortex using two-photon microscopy. (Left) Red square shows site of collateral sprouting magnified in the images on the right. (Right) Red arrows mark collaterals in the magnified view. As shown in this example, collateral sprouting was observed 1 week after 3-AP injection in all animals (n=12). Scale bar, 50 μm. (e) Immunolabelling of synaptic sites with VGLUT2 (red) in CFs (anti-GFP, cyan) 2 weeks after 3-AP injection (n=2 animals). The molecular layer of lobule VIII in a fixed coronal section is shown. Red square shows site of collateral sprouting magnified in the images on the right. Note that new CF ladders (white arrowheads) are all VGLUT2-positive regardless of their ladder length and distance from their origin. Scale bar, 50 μm.
Figure 2
Figure 2. Pattern of post-lesion CF collateral sprouting in vivo.
(a) A representative example of in vivo time-lapse images of the same surviving CF and its traces for the time points mentioned at the top right of the CF images. Maximum projections (top-down view) of the CF in the molecular layer are shown. Solid red lines indicate the mediolateral extent of the CF at each time point while the dashed red line indicates the mediolateral boundary from the previous time point that expanded in the current time point. Magenta arrows indicate ladders categorized as outside additions while green arrows indicate ladders categorized as inside additions. A total of nine surviving CFs were imaged from the four animals and traced completely as shown in this example. Additional examples are shown in Supplementary Fig. 2. Scale bar, 10 μm. (b) Average number of ladders added (±s.e.m.) at each time point (n=4 animals). We observed 101 new ladders emerging from the 9 surviving, parent CFs out of which 48 were categorized as outside and 53 as inside. The pattern of inside addition (that is, number of ladders added to the inside) were significantly different over time (one-way repeated measures analysis of variance with Tukey post hoc analysis: F(6,18)=3.604; P=0.01; *P<0.05 time point 4 compared with time points 2, 5 and 13+). Inset shows total ladders added (±s.e.m.) at each time point.
Figure 3
Figure 3. Pattern of post-lesion CF ladder growth in vivo.
(a) Traces from a CF ladder at two consecutive time points (t and t+1) are shown to illustrate how change in stalk and total ladder length was measured throughout the paper. The white trace is the main collateral the CF ladder emerges from. The red trace is the main stalk of the CF ladder and the blue traces are the rungs that emerge from the main stalk. Stalk length is the measurement of the red trace while total ladder length is the sum of measurements of the red trace and all the blue traces. Scale bar, 10 μm. (b) Average change in stalk length (±s.e.m., red) and total ladder length (±s.e.m., blue) per week at each time point where each time point indicates number of weeks from birth of the ladder (n=57 ladders). Average change in stalk length was significantly different over time (one-way analysis of variance with Tukey post hoc analysis: F(5, 175)=26; P<0.0001; *P<0.001 compared with time points 1, 2, 3, 4 and 5). Average change in total ladder length was significantly different over time (One-way ANOVA with Tukey Post-hoc analysis: F(5,201)=20.74, P<0.0001, *P<0.001 compared to time point 1,2,3,4,5).
Figure 4
Figure 4. Multicolour imaging of zebrin II zones and CFs.
(a) Coronal section of cerebellar cortex from Aldoc-tdTomato tg crossed with Nefl-EGFP tg mouse. (a, left) Wide-field image of an unfixed, freshly prepared coronal section showing the sagittally oriented bands of zebrin II-expressing (+zone, red) and non-expressing (-zone) zones. (a, right) Magnified image of the area enclosed in the white square from the image on the left. This image was taken using a two-photon microscope to show that EGFP expressing CFs (cyan) can be visualized in both zebrin +zones (red) and –zones. White dashed line indicates the zonal boundary. GCL, granule cell layer; ML, molecular layer; PCL, Purkinje cell layer. Scale bar, 50 μm. (b) Representative images taken in vivo at the level of the PCL in lobule VIII at 1 and 13 weeks after 3-AP injection show the same PCs as zebrin II-expressing and non-expressing. Zebrin II expression in PCs was stable in all double-transgenic animals that were treated with 3-AP and imaged longer than 4 weeks (n=3 animals). Black and white asterisks indicate examples of zebrin II expressing and non-expressing PCs, respectively. Scale bar, 20 μm.
Figure 5
Figure 5. Spatiotemporal pattern of CF collateral sprouting in the double-transgenic mice.
(a) Average number of ladders categorized as outside added (±s.e.m.) at each time point (n=8 surviving CFs from 3 double-transgenic mice, black). The data from single transgenic mice (green, taken from Fig. 2b) are overlaid for comparison. No interaction or genotype or time point effect was found (two-way repeated measures analysis of variance (ANOVA): F(6,30)=1.197; P=0.4). (b) Average number of ladders categorized as inside added (±s.e.m.) at each time point (n=8 surviving CFs from 3 double-transgenic mice, black). The data from single-transgenic mice (green, taken from Fig. 2b) are overlaid for comparison. No interaction or genotype effect was found, however time points did have a significant effect (two-way repeated measures ANOVA: F(6,30)=3.125; P=0.01). (c,d) Representative images showing CF collaterals crossing the zonal boundary in lobule VIII. In vivo two-photon image of the same area of cerebellar cortex taken 5/6 weeks apart. Maximum projections (top-down view) of the CFs and the zonal boundary in the molecular layer are shown. Scale bar, 50 μm. (e) Average change in stalk length (±s.e.m.) of ladders growing in native (red, n=49 ladders) and non-native (black, n=32 ladders) zones at each time point, where each time point indicates number of weeks from birth of the ladder. The change in stalk length was significantly different over time for ladders growing in their native or non-native zone (one-way ANOVA with Tukey post hoc analysis: native zone; F(5,116)=7.19, P<0.0001, *P<0.001 compared with time points 1, 2, 3, 4 and 5; and non-native zone; F(5,99)=17.5, P<0.0001, *P<0.001 compared with time points 1, 2, 3, 4 and 5). (f) Average change in total ladder length (±s.e.m.) of ladders growing in native (red, n=49 ladders) and non-native (black, n=32 ladders) zones at each time point, where each time point indicates number of weeks from birth of the ladder. The change in total ladder length was significantly different over time for ladders growing in their native or non-native zone (one-way ANOVA with Tukey post hoc analysis: native zone; F(5,116)=7.667, P<0.0001, *P<0.001 compared with time points 1, 2 and 3; and non-native zone; F(5,99)=8.137, P<0.0001, *P<0.001 compared with time points 1, 2, 3 and 4).
Figure 6
Figure 6. Correlation between CF ladder growth and distance from zonal boundary.
(a) Representative in vivo image showing axonal degeneration in lobule VIII occurs at the boundary of positive and negative zebrin II zone. A maximum projection (top-down view) of the CFs and the zonal boundary in the molecular layer is shown. Four out of the six double-transgenic animals showed similar type of CF degeneration (zonal degeneration) after 3-AP injection. Scale bar, 50 μm. (b) Traces of CF ladders growing very close (upper traces) or far (lower traces) from zonal boundary at two time points about 3 or 4 weeks apart. Distance mentioned above the images is measured from native zone boundary. Scale bar, 10 μm. (c) Correlation between stalk length at birth of the ladder (t=0, black circles, n=30 ladders) or at 3 or 4 weeks from the birth of the ladder (t=3/4, grey circles, n=20 ladders) and distance from native zone boundary. (d) Correlation between total ladder length at birth of the ladder (t=0, black circles, n=30 ladders) or at 3 or 4 weeks from the birth of the ladder (t=3/4, grey circles, n=20 ladders) and distance from native zone boundary.

Similar articles

Cited by

References

    1. Henderson Z. Responses of basal forebrain cholinergic neurons to damage in the adult brain. Prog. Neurobiol. 48, 219–254 (1996). - PubMed
    1. Deller T.et al.. in Brain Repair ed. Bähr M. 101–121Springer (2006).
    1. Kaas J. H. et al.. Cortical and subcortical plasticity in the brains of humans, primates, and rats after damage to sensory afferents in the dorsal columns of the spinal cord. Exp. Neurol. 209, 407–416 (2008). - PMC - PubMed
    1. Grasselli G. & Strata P. Structural plasticity of climbing fibers and the growth-associated protein GAP-43. Front. Neural Circuits 7, 25 (2013). - PMC - PubMed
    1. Geddes J. W. et al.. Plasticity of hippocampal circuitry in Alzheimer's disease. Science 230, 1179–1181 (1985). - PubMed

Publication types

LinkOut - more resources