. 2016 Dec;49(6):657-668.
doi: 10.1111/cpr.12293. Epub 2016 Sep 21.

Loss of TAB3 expression by shRNA exhibits suppressive bioactivity and increased chemical sensitivity of ovarian cancer cell lines via the NF-κB pathway

Affiliations

Loss of TAB3 expression by shRNA exhibits suppressive bioactivity and increased chemical sensitivity of ovarian cancer cell lines via the NF-κB pathway

Yannan Chen et al. Cell Prolif. 2016 Dec.

Abstract

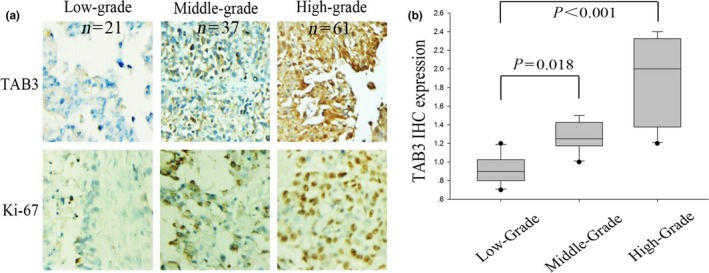
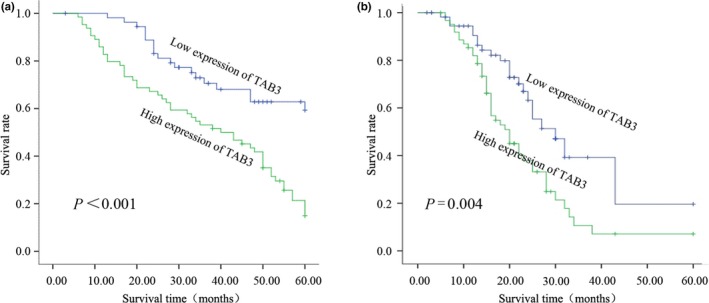
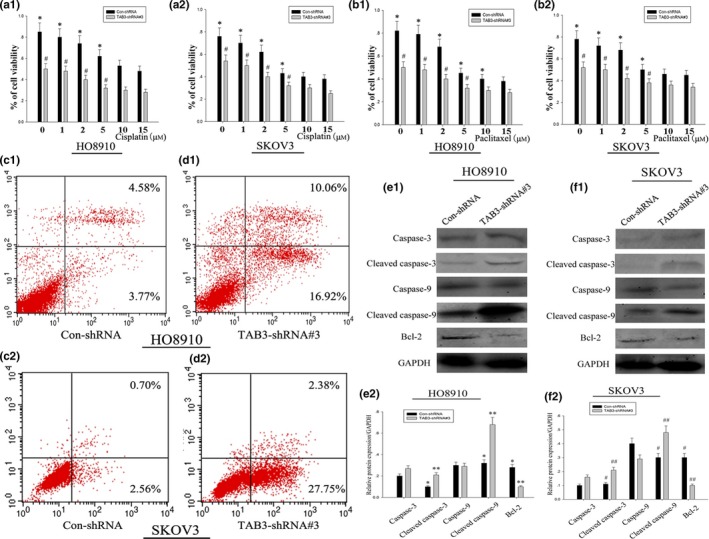
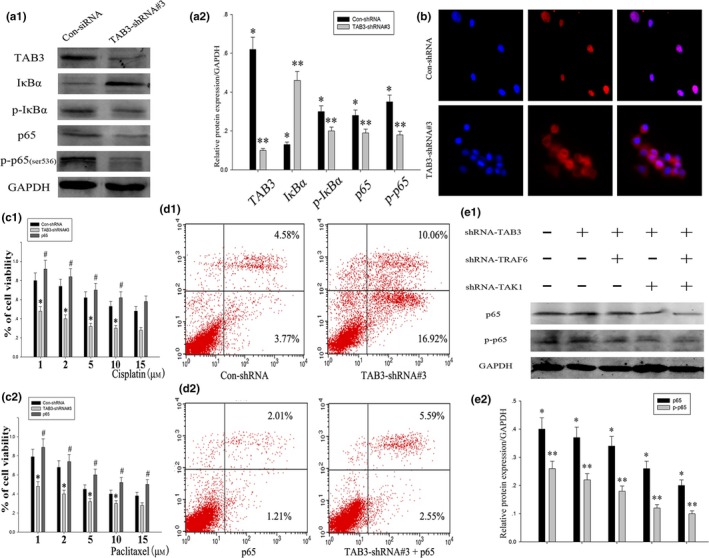
Ovarian cancer is a leading cause of death among gynaecologic malignancies. Despite many years of research, it still remains sparing in reliable diagnostic markers and methods for early detection and screening. Transforming growth factor β-activated protein kinase 1 (TAK1)-binding protein 3 (TAB3) was initially characterized as an adapter protein essential for TAK1 activation in response to IL-1β or TNFα, however, the physiological role of TAB3 in ovarian cancer tumorigenesis is still not fully understood. In this study, we evaluated the effects of TAB3 on ovarian cancer cell lines. Expressions of TAB3 and PCNA (proliferating cell nuclear antigen) were found to be gradually increased in EOC tissues and cell lines, by western blot analysis and qRT-PCR. Distribution of TAB3 was further analysed by immunohistochemistry. In vitro, knockdown of TAB3 expression in HO8910 or SKOV3 ovarian cancer cells significantly inhibited bioactivity of ovarian cancer cells, including proliferation and cell-cycle distribution, and promoted chemical sensitivity to cisplatin and paclitaxel treatment via inhibiting NF-κB pathways. In conclusion, our study strongly suggests a novel function of TAB3 as an oncogene that could be used as a biomarker for ovarian cancer. It provides a new insight into the potential mechanism for therapeutic targeting, in chemotherapy resistance, common in ovarian cancer.


Conflict of interest statement

The authors declare no conflicts of interest.

Figures

Figure 1
Figure 1
TAB3 expression was up‐regulated in EOC tissues and cell lines. (a1 and a2) The expressions of TAB3 in four EOC cell lines (A2780, HO8910, OVCAR3 and SKOV3 as showed) and one normal ovarian cell line were examined by WB. *P<.05. (B1 and B2) Western blotting (WB) was performed to detect TAB3 expression levels in three normal tissues (N1, N2 and N3) and nine EOC tissues (T1–T9) from grade 1 (I) to grade 3 (III) (N: normal; EOC: epithelial ovarian cancer; T: tumour). *P<.05. (C1 and C2) The levels of TAB3 mRNA expression were evaluated in normal ovarian tissues and different EOC tissues and cell lines. *P<.05. The relative expression levels were showed by density photometry and GAPDH was used as a loading control. The same experiment was repeated at least three times
Figure 2
Figure 2
TAB3 expression and distribution was examined in EOC tissues by IHC. (a) Representative IHC images (×200) of TAB and Ki‐67 protein expression in EOC tissues (from low grade to high grade) (IHC: immunohistochemical stain). (b) Box‐plot presentation of TAB3 staining levels in EOC tissues with three grades. The same experiment was repeated at least three times
Figure 3
Figure 3
Relationship between TAB3 expression and Ki‐67 proliferation index in EOC. Scatter plot of TAB3 against Ki‐67 with regression line showing a correlation of them using the Spearman's correlation coefficient (r=.820, P<.001)
Figure 4
Figure 4
Kaplan–Meier survival curves for low versus high TAB3 expression in 119 EOC patients. (a) Kaplan–Meier curves of overall survival of patients whose ovarian tumours expressed high vs low levels of TAB3. (b) Kaplan–Meier curves of progression‐free survival for patients whose ovarian tumours expressed high vs low levels of TAB3
Figure 5
Figure 5
ShRNA‐directed knockdown of TAB3 expression inhibited cell proliferation and blocked cell cycle in HO8910 and SKOV3 cell lines. (a1, a2 and b1, b2) TAB3 expression of EOC cell lines was detected in groups after different transfections, which resulted in the differential expression of TAB3 among the groups in each different EOC cell lines. (c and d) The viability of EOC cell lines was evaluated by MTT assay. The data need to be labelled as the mean ± SEM. (e1, e2 and f1, f2) Cell‐cycle profile was examined by flow cytometry and percentages of cells in G0/G1, S and G2/M phase in the TAB3‐shRNA#3 were compared with the Con‐shRNA group. (g1, g2 and h1, h2) HO8910 and SKOV3 cells were harvested and analysed for TAB3, and cell‐cycle‐related molecules including PCNA and CyclinD1 expression following the serum starvation and refeeding experiment. Mean ± SEM of three independent experiments (n=3, P<.05). (i1, i2) Protein expressions of TAB3, PCNA and CyclinD1 were examined by WB in TAB3‐shRNA#3 and Con‐shRNA cell lines
Figure 6
Figure 6
Knockdown of TAB3 expression restrained the resistance of EOC cells to chemotherapeutic drugs. (a1, a2 and b1, b2) The viability of HO8910 and SKOV3 cell lines with or without TAB3 knockdown (TAB3‐shRNA#3) was measured by MTT assay after treatment with indicated concentrations of cisplatin and paclitaxel. Data are presented as mean ± SD. (c1, c2 and d1, d2) HO8910 and SKOV3 cell lines were treated with Con‐shRNA and TAB3‐shRNA#3, respectively. Apoptosis was examined by Annexin V assay in Cellometer. (e1, e2 and f1, f2) Caspase‐3, Caspase‐9 and Bcl‐2 were determined by WB after transfecting corresponding plasmids for 24 h. As protein expression of TAB3 decreased, these apoptosis indexes changed significantly
Figure 7
Figure 7
TAB3 regulated EOC cell bioactivity and chemotherapy performance via the NF‐κB pathway. (a1 and a2) HO8910 cells were transfected with Con‐shRNA and TAB3‐shRNA#3. After 36 h, the cells were collected, and the whole cell lysates were analysed by WB with the indicated antibodies. (b) The blue areas indicated nuclei stained using 4, 6‐diamidino‐2‐phenylindole (DAPI), and the red areas indicated the nuclear translocation of NF‐κB/p65 in HO8910 cells transfected with different plasmids. (c1 and c2) The viability of HO8910 ovarian cancer cells with TAB3 knockdown or p65 overexpression was measured by MTT assay after treatment of cells with indicated concentrations of paclitaxel or cisplatin. Data are presented as mean ± SD. P<.05. (d1 and d2) HO8910 cell line was treated with Con‐shRNA, TAB3‐shRNA#3, p65 overexpression and the mixed plasmid. Apoptosis was examined by Annexin V assay in Cellometer. (e1 and e2) HO8910 cell lines were transfected with shRNATAB3, shRNATRAF6 and shRNATAK1, the measurement of immunoblotting were carried out 48 h post transfection

References

    1. English DP, Menderes G, Black J, Schwab CL, Santin AD. Molecular diagnosis and molecular profiling to detect treatment‐resistant ovarian cancer. Expert Rev Mol Diagn. 2016;16:769–782. - PubMed
    1. Siegel RL, Miller KD, Jemal A. Cancer statistics, 2015. CA Cancer J Clin. 2015;65:5–29. - PubMed
    1. Winterhoff B, et al. Molecular classification of high grade endometrioid and clear cell ovarian cancer using TCGA gene expression signatures. Gynecol Oncol. 2016;141:95–100. - PMC - PubMed
    1. Mirandola L, et al. Cancer testis antigens: novel biomarkers and targetable proteins for ovarian cancer. Int Rev Immunol. 2011;30:127–137. - PubMed
    1. Krzystyniak J, et al. Epithelial ovarian cancer: the molecular genetics of epithelial ovarian cancer. Ann Oncol. 2016;27(Suppl 1):i4–i10. - PMC - PubMed

MeSH terms

Substances