. 2016 Nov 1;76(21):6183-6192.
doi: 10.1158/0008-5472.CAN-15-3125. Epub 2016 Sep 20.

BPTF Depletion Enhances T-cell-Mediated Antitumor Immunity

Affiliations

BPTF Depletion Enhances T-cell-Mediated Antitumor Immunity

Kimberly Mayes et al. Cancer Res. .

Abstract

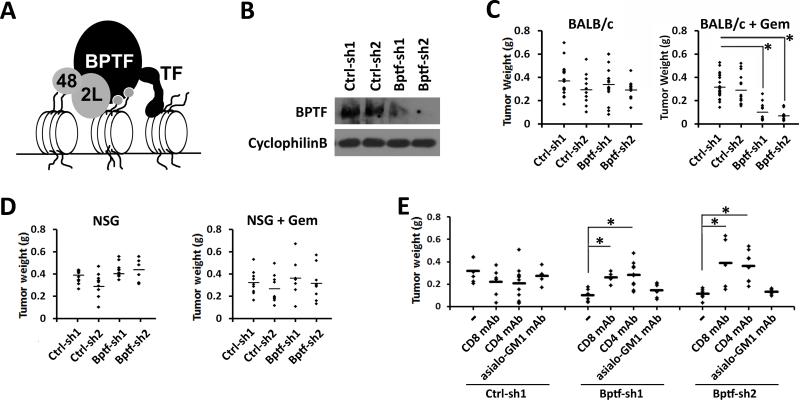
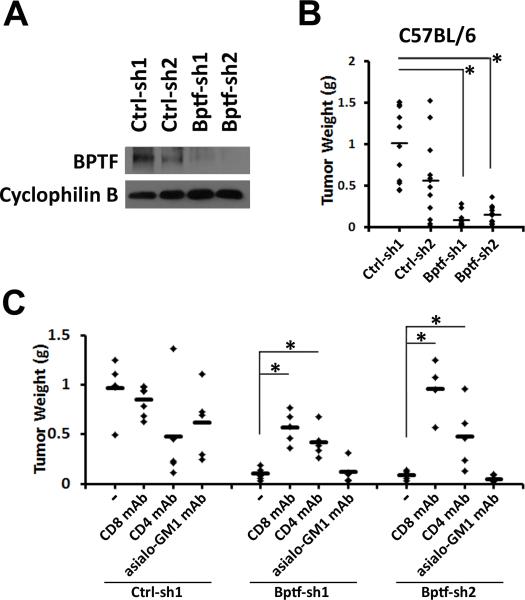
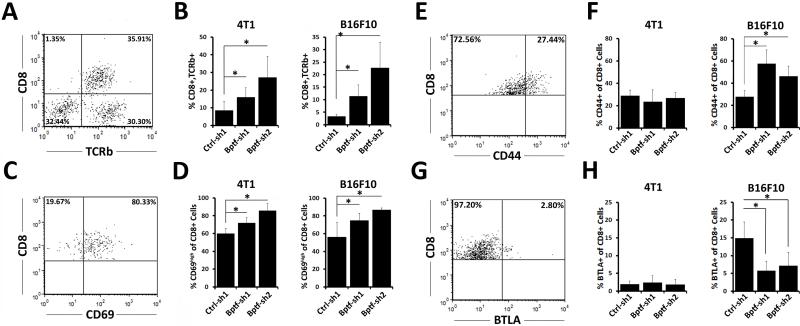
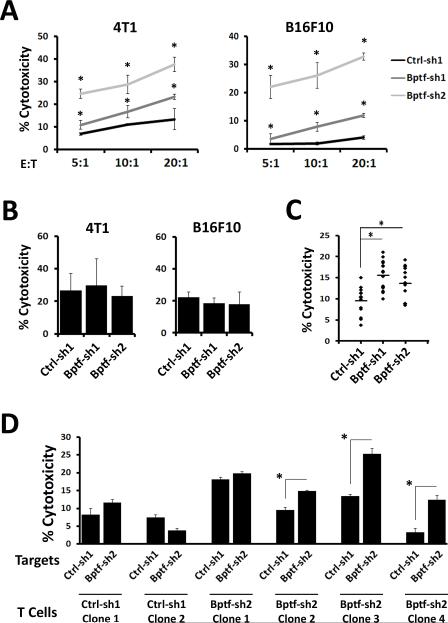
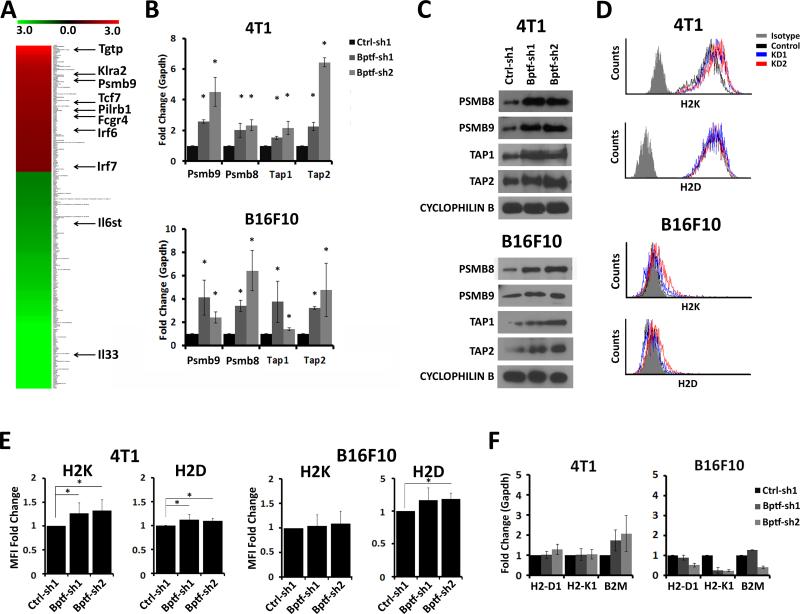
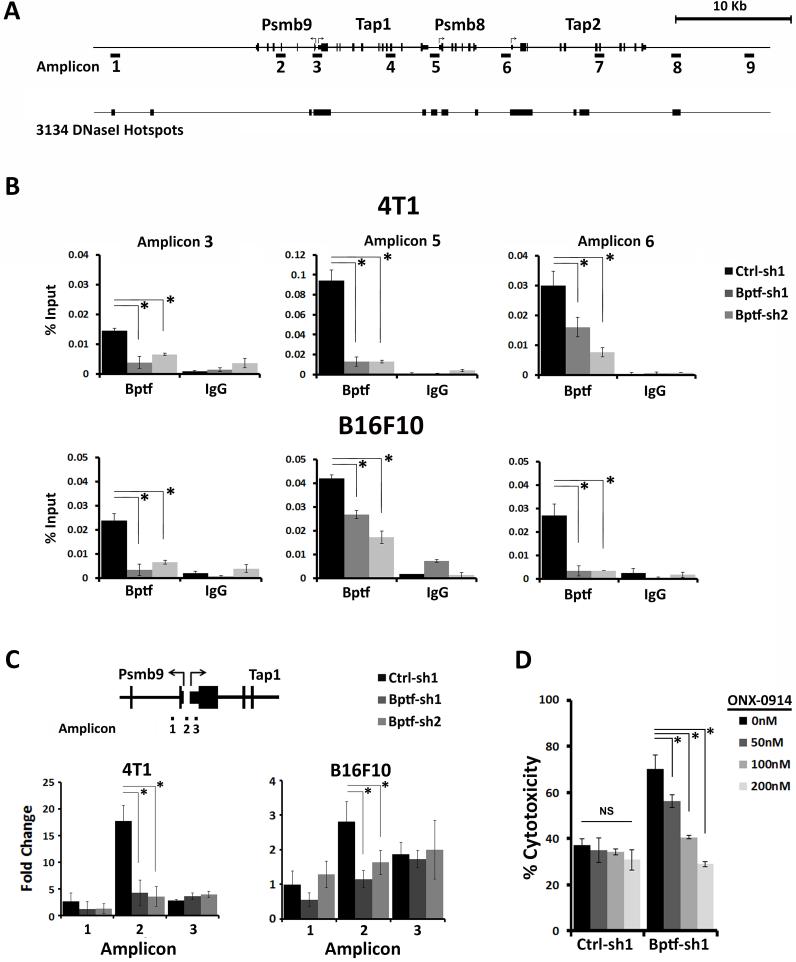
Genetic studies in fruit flies have implicated the chromatin remodeling complex nucleosome remodeling factor (NURF) in immunity, but it has yet to be studied in mammals. Here we show that its targeting in mice enhances antitumor immunity in two syngeneic models of cancer. NURF was disabled by silencing of bromodomain PHD-finger containing transcription factor (BPTF), the largest and essential subunit of NURF. We found that both CD8+ and CD4+ T cells were necessary for enhanced antitumor activity, with elevated numbers of activated CD8+ T cells observed in BPTF-deficient tumors. Enhanced cytolytic activity was observed for CD8+ T cells cocultured with BPTF-silenced cells. Similar effects were not produced with T-cell receptor transgenic CD8+ T cells, implicating the involvement of novel antigens. Accordingly, enhanced activity was observed for individual CD8+ T-cell clones from mice bearing BPTF-silenced tumors. Mechanistic investigations revealed that NURF directly regulated the expression of genes encoding immunoproteasome subunits Psmb8 and Psmb9 and the antigen transporter genes Tap1 and Tap2 The PSMB8 inhibitor ONX-0914 reversed the effects of BPTF ablation, consistent with a critical role for the immunoproteasome in improving tumor immunogenicity. Thus, NURF normally suppresses tumor antigenicity and its depletion improves antigen processing, CD8 T-cell cytotoxicity, and antitumor immunity, identifying NURF as a candidate therapeutic target to enhance antitumor immunity. Cancer Res; 76(21); 6183-92. ©2016 AACR.


Figures

Figure 1
Figure 1
Depletion of BPTF reduces 4T1 tumor weights in mice with CD8+ and CD4+ T cells. A, cartoon of NURF (BPTF, 2L, 48) bound to chromatin. Grey circles: histone modifications, TF: transcription factor. B, BPTF Western blot analysis from control (Ctrl-sh1, Ctrl-sh2) and BPTF KD (Bptf-sh1, Bptf-sh2) 4T1 total cell extracts. Cyclophilin B loading control. C-D, weights of primary control and BPTF KD 4T1 tumors after growth in C, BALB/c mice (n ≥ 12, * = ttest pvalue < 9.6×10⁻⁷) or D, NSG mice (n = 9). E, weights of 4T1 tumors after growth in undepleted, CD8+, CD4+ or asialo-GM1+ mAb depleted BALB/c mice. (n ≥ 5, * = ttest pvalue < 0.02).
Figure 2
Figure 2
BPTF depletion reduces B16F10 tumor weights in mice with CD8+ and CD4+ T cells. A, BPTF Western blot analysis of control (Ctrl-sh1, Ctrl-sh2) and BPTF KD (Bptf-sh1, Bptf-sh2) B16F10 total cell extracts. Cyclophilin B loading control. B, weights of primary control and BPTF KD B16F10 tumors after growth in C57BL/6 mice (n ≥ 9, * = ttest pvalue < 1.4×10⁻⁷). C, weights of B16F10 tumors after growth in undepleted, CD8+, CD4+ or asialo-GM1+ mAb depleted C57BL/6 mice. (n ≥ 5, * = ttest pvalue < 0.02).
Figure 3
Figure 3
Enhanced presence and activity of CD8 T cells in BPTF KD tumors. A,C,E,G representative dot plots of live 4T1 tumor infiltrating lymphocytes stained for CD8 and TCRb, CD69, CD44 or BTLA, respectively. B, percentages of live intratumor CD8+,TCRb+ lymphocytes as a percent of all live lymphocytes from 4T1 and B16F10 tumors (n ≥ 7, * = ttest pvalue < 0.05). D,F,H, percentages of intratumor CD8+ lymphocytes that are CD69high, CD44+ or BTLA+ from 4T1 and B16F10 tumors, respectively (n = 6, * = ttest pvalue < 0.05).
Figure 4
Figure 4
BPTF depletion sensitizes tumor cells to CD8 T cell cytotoxicity in vitro. A-D, percent target cell cytotoxicity determined by LDH release. A, purified splenic CD8 T cells from control or BPTF KD tumor bearing mice were cocultured on control or BPTF KD targets, respectively, at the indicated effector to target (E:T) ratios. (n = 3, * = ttest pvalue < 0.05). B, coculture of naïve purified CD8 T cells treated with PMA + Ionomycin with 4T1 or B16F10 targets at a 10:1 E:T ratio. C, CD8 T cell clones isolated from spleens of 4T1 control or BPTF KD tumor bearing mice were cocultured with 4T1 control or BPTF KD targets, respectively, at a 10:1 E:T ratio. Each dot represents one clone and is an average of 3 biological replicates (* = ttest pvalue < 5.0×10⁻³). D, six representative CD8 T cell clones from panel C were cocultured with either control or BPTF KD 4T1 targets at a 10:1 E:T ratio. Results are representative of 3 biological replicates for each clone (* = ttest pvalue < 0.04).
Figure 5
Figure 5
BPTF regulates immunoproteasome and TAP subunit expression. A, microarray heat map of genes significantly deregulated in BPTF KD 4T1 tumors from NSG mice (n = 3). Scale represents +/− 3 fold expression change. Genes related to the immune response are highlighted. B, qRT-PCR analysis of Psmb8, Psmb9, Tap1 and Tap2 expression from control or BPTF KD 4T1 and B16F10 cells. (n = 3 biological replicates, * = ttest pvalue < 0.05). C, PSMB8, PSMB9, TAP1 and TAP2 Western blot analysis of 4T1 (top) and B16F10 (bottom) total cell extracts. D, representative flow cytometry histograms of 4T1 and B16F10 cells stained for the MHC class I molecules H2K and H2D. E, fold change in MFI of H2K and H2D (n ≥ 3 biological replicates, * = ttest pvalue < 0.05). F, qRT-PCR analysis of MHC class I gene expression from 4T1 and B16F10 cells (n = 3 biological replicates).
Figure 6
Figure 6
BPTF occupies and regulates chromatin structure at Psmbs and TAPs. A, cartoon showing the position of PCR amplicons used for ChIP analysis and DNaseI hotspots from the mouse mammary epithelial line 3134 (35). B, BPTF ChIP at Psmb9, Psmb8, Tap1 and Tap2 promoters (n = 3 biological replicates, * = ttest pvalue < 0.05). C, FAIRE at the divergent Psmb9-Tap1 promoter. Values are normalized to a BPTF-independent control site (n = 3 biological replicates, * = ttest pvalue < 0.05). D, percent target cell cytotoxicity determined by LDH release for 4T1 splenocytes from control or BPTF KD tumor bearing mice stimulated at a 50:1 E:T ratio on control or BPTF KD targets, respectively, after treatment with 50-200nM ONX-0914 (n = 3 biological replicates, * = ttest pvalue < 0.04).

References

    1. Mittal D, Gubin MM, Schreiber RD, Smyth MJ. New insights into cancer immunoediting and its three component phases--elimination, equilibrium and escape. Curr Opin Immunol. 2014;27:16–25. - PMC - PubMed
    1. Drake CG, Lipson EJ, Brahmer JR. Breathing new life into immunotherapy: review of melanoma, lung and kidney cancer. Nat Rev Clin Oncol. 2014;11(1):24–37. - PMC - PubMed
    1. Woodcock CL, Ghosh RP. Chromatin higher-order structure and dynamics. Cold Spring Harb Perspect Biol. 2010;2(5):a000596. - PMC - PubMed
    1. Becker PB, Workman JL. Nucleosome remodeling and epigenetics. Cold Spring Harb Perspect Biol. 2013;5(9) - PMC - PubMed
    1. Landry J, Sharov AA, Piao Y, Sharova LV, Xiao H, Southon E, et al. Essential role of chromatin remodeling protein Bptf in early mouse embryos and embryonic stem cells. PLoS Genet. 2008;4(10):e1000241. - PMC - PubMed

Publication types