. 2016 Nov 1;76(21):6193-6204.
doi: 10.1158/0008-5472.CAN-15-3502. Epub 2016 Sep 20.

Nutritional Stress Induced by Tryptophan-Degrading Enzymes Results in ATF4-Dependent Reprogramming of the Amino Acid Transporter Profile in Tumor Cells

Affiliations

Nutritional Stress Induced by Tryptophan-Degrading Enzymes Results in ATF4-Dependent Reprogramming of the Amino Acid Transporter Profile in Tumor Cells

Elina Timosenko et al. Cancer Res. .

Abstract

Tryptophan degradation is an immune escape strategy shared by many tumors. However, cancer cells' compensatory mechanisms remain unclear. We demonstrate here that a shortage of tryptophan caused by expression of indoleamine 2,3-dioxygenase (IDO) and tryptophan 2,3-dioxygenase (TDO) resulted in ATF4-dependent upregulation of several amino acid transporters, including SLC1A5 and its truncated isoforms, which in turn enhanced tryptophan and glutamine uptake. Importantly, SLC1A5 failed to be upregulated in resting human T cells kept under low tryptophan conditions but was enhanced upon cognate antigen T-cell receptor engagement. Our results highlight key differences in the ability of tumor and T cells to adapt to tryptophan starvation and provide important insights into the poor prognosis of tumors coexpressing IDO and SLC1A5. Cancer Res; 76(21); 6193-204. ©2016 AACR.


Conflict of interest statement

The authors disclose no potential conflicts of interest.

Figures
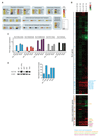
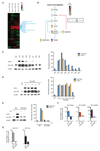
Figure 1
Figure 1. Remodeling of transcriptomic profiling in IDO-expressing tumor cells
(A) Clustered RNA-seq expression data showing the fold change in the expression of genes up-regulated in both IDO1-transduced vs GFP-transduced HeLa cells cultured for 72h (left circles) and IFNγ-treated vs untreated WT HeLa cells cultured for 72h (right circles), as indicated in the legend box on the right. (B) RNA-seq profiles of solute carrier (SLC) (top) and amino acid metabolism (bottom) genes in IDO1-transduced vs GFP-transduced and IFNγ-treated vs untreated WT HeLa cells cultured for 48h or 72h. (C and D) WT, IFNγ-treated, GFP-transduced, IDO1-transduced and TDO2-transduced HeLa cells were cultured for 72h. SLC1A5(L), SLC1A5(S), SLC1A5(M), SLC7A11 and SLC1A4 mRNA expression levels were analyzed by quantitative PCR, and are shown as fold change in expression relative to Actb. Bars represent the mean ± SEM (C). Western Blot was performed with indicated antibodies and protein levels were quantified by densitometry (D). Data are representative of at least two independent experiments.
Figure 2
Figure 2. SLC1A5(L)- and SLC1A5(S)-transduced HeLa cells exhibit increased glutamine and tryptophan uptake
(A-C) Uptake experiments in WT, GFP-transduced, SLC1A5(L)-transduced and SLC1A5(S)-transduced HeLa cells were performed for [3H]-glutamine (A) or [3H]-tryptophan (B and C), in the presence or absence of SLC1A5 inhibitor BenSer over 10min or 3min, respectively. [3H]-tryptophan uptake was also performed in the presence of excess unlabeled tryptophan (B). Bars represent the mean ± SEM. *p < 0.05; **p < 0.01, ***p < 0.001. Data are representative of at least two independent experiments.
Figure 3
Figure 3. Tryptophan depletion up-regulates SLC1A5 expression in a panel of IDO negative tumor cell lines
(A and B) WT HeLa cells were incubated in tissue culture medium containing indicated concentrations of tryptophan for 72h (A) or 48h (B). SLC1A5(L) and SLC1A5(S) mRNA expression levels were analyzed by quantitative PCR, and are shown as fold change in expression relative to Gapd. Bars represent the mean ± SEM (A). Western Blot was performed with indicated antibodies and protein levels were quantified by densitometry (B). (C) HeLa, A431, DU145, DX3 and HPAF tumor cell lines were incubated in tissue culture medium depleted of tryptophan for 72h. Western Blot was performed with indicated antibodies and protein levels were quantified by densitometry. (D) WT HeLa cells were incubated in tissue culture medium depleted of indicated amino acids for 48h. Western Blot was performed with indicated antibodies and protein levels were quantified by densitometry. Data are representative of at least two independent experiments.
Figure 4
Figure 4. ATF4 mediates SLC1A5 up-regulation upon tryptophan withdrawal
(A) RNA-seq transcriptome profiles of the integrated stress response genes in IDO1-transduced vs GFP-transduced and IFNγ-treated vs untreated WT HeLa cells cultured for 48h or 72h. (B) Fold change in the expression of indicated genes in IFNγ-treated vs untreated WT HeLa cells cultured for 72h (top circles) and in IDO1-transduced vs GFP-transduced HeLa cells cultured for 72h (bottom circles), as indicated in the legend box on the right. (C and D) WT HeLa cells were incubated in tissue culture medium depleted of indicated amino acids (C) or in the presence of indicated tryptophan concentrations (D) for 48h. Western Blot was performed with indicated antibodies and protein levels were quantified by densitometry. (E-G) WT and ATF4 knockdown (ATF4-KD) HeLa cells were incubated in tissue culture medium depleted of tryptophan for 48h. Western Blot was performed with indicated antibodies and protein levels were quantified by densitometry (E). SLC1A5(L), SLC1A5(S) and SLC1A5(M) mRNA expression levels (F), and SLC7A11 and SLC1A4 mRNA expression levels (G) were quantified by quantitative PCR, and are shown as fold change in expression in tryptophan-depleted vs complete tissue culture medium, relative to Hprt1. Bars represent the mean ± SEM. ND, non-detected. Data are representative of at least two independent experiments.
Figure 5
Figure 5. Human T cells up-regulate SLC1A5 expression upon TCR stimulation, but not in response to tryptophan withdrawal
(A) WT HeLa, DU145, HPAF cells, and human CD4+ and CD8+ T cells, either stimulated (+) or unstimulated (-) with plate-bound αCD3/CD28 antibodies, were incubated in tissue culture medium in the presence (+) or in the absence (-) of tryptophan for 48h. Western Blot was performed with indicated antibodies. (B) WT HeLa and resting human CD4+ and CD8+ T cells were incubated in tissue culture medium depleted of tryptophan for 48h. SLC1A5(L) and SLC1A5(S) mRNA expression levels were analyzed by quantitative PCR, and are shown as fold change in expression in tryptophan-depleted vs complete tissue culture medium, relative to Hprt1. Bars represent the mean ± SEM. ND, non-detected. (C) NY-ESO-1-specific CD8+ T cell clone was stimulated with αCD3/CD28 antibodies or co-cultured with antigen presenting cells pre-pulsed with the indicated concentrations of NY-ESO-1157-165 (V) peptide analogue. After 48h, SLC1A5 surface expression was assessed by flow cytometry using SLC1A5 cell surface RBD ligand staining. Bars represent the mean ± SEM. MFI, mean fluorescence intensity. Data are representative of at least two independent experiments.
Figure 6
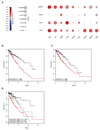
Figure 6. Expression of SLC1A5 correlates with the expression of tryptophan-degrading enzymes in primary human tumors and is associated with decreased survival in brain lower grade glioma
(A) Spearman’s rank correlation between SLC1A5 and WARS, TDO2, IDO1 or ATF4 gene expression in RNA-seq data of human liver hepatocellular carcinoma (LIHC), ovarian serous cystadenocarcinoma (OV), glioblastoma multiforme (GBM), brain lower grade glioma (LGG), uterine corpus endometrial carcinoma (UCEC), adrenocortical carcinoma (ACC), cervical squamous cell carcinoma and endocervical adenocarcinoma (CESC), breast invasive carcinoma (BRCA) and kidney renal clear cell carcinoma (KIRC). The size of the circle indicates significance of correlation. (B) Kaplan-Meier curves comparing survival of patients with brain lower grade glioma tumors expressing high or low levels of SLC1A5 (p-value=0.00006). (C) Kaplan-Meier curves comparing survival of patients with brain lower grade glioma tumors expressing high or low levels of IDO1 (p-value=0.00053). (D) Kaplan-Meier curves comparing survival of patients with brain lower grade glioma tumors expressing high or low SLC1A5 together with high or low levels of IDO1 (p-value=0.00005). High and low expression of SLC1A5 or IDO1 was defined as above and below median expression, respectively.

References

    1. Uyttenhove C, Pilotte L, Theate I, Stroobant V, Colau D, Parmentier N, et al. Evidence for a tumoral immune resistance mechanism based on tryptophan degradation by indoleamine 2,3-dioxygenase. Nature Medicine. 2003;9(10):1269–74. - PubMed
    1. Theate I, van Baren N, Pilotte L, Moulin P, Larrieu P, Renauld J-C et al. Extensive Profiling of the Expression of the Indoleamine 2,3-Dioxygenase 1 Protein in Normal and Tumoral Human Tissues. Cancer Immunology Research. 2015;3(2):161–72. - PubMed
    1. Pilotte L, Larrieu P, Stroobant V, Colau D, Dolusic E, Frederick R, et al. Reversal of tumoral immune resistance by inhibition of tryptophan 2,3-dioxygenase. Proc Natl Acad Sci U S A. 2012;109(7):2497–502. - PMC - PubMed
    1. Opitz CA, Litzenburger UM, Sahm F, Ott M, Tritschler I, Trump S, et al. An endogenous tumour-promoting ligand of the human aryl hydrocarbon receptor. Nature. 2011;478(7368):197–203. - PubMed
    1. Godin-Ethier J, Hanafi L-A, Piccirillo CA, Lapointe R. Indoleamine 2,3-Dioxygenase Expression in Human Cancers: Clinical and Immunologic Perspectives. Clinical Cancer Research. 2011;17(22):6985–91. - PubMed

Publication types

MeSH terms

Substances