. 2017 Feb;12(2):183-203.
doi: 10.1007/s11548-016-1483-3. Epub 2016 Sep 20.

Automated brain tumour detection and segmentation using superpixel-based extremely randomized trees in FLAIR MRI

Affiliations

Automated brain tumour detection and segmentation using superpixel-based extremely randomized trees in FLAIR MRI

Mohammadreza Soltaninejad et al. Int J Comput Assist Radiol Surg. 2017 Feb.

Abstract

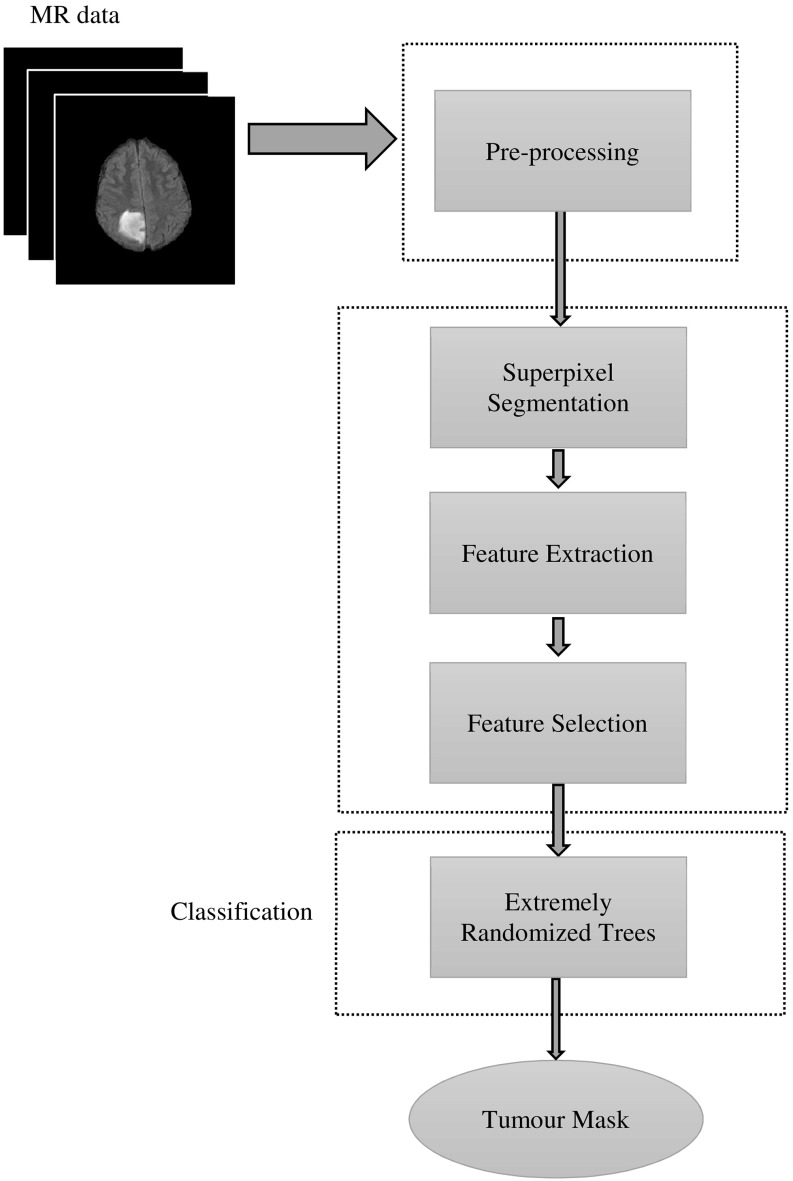
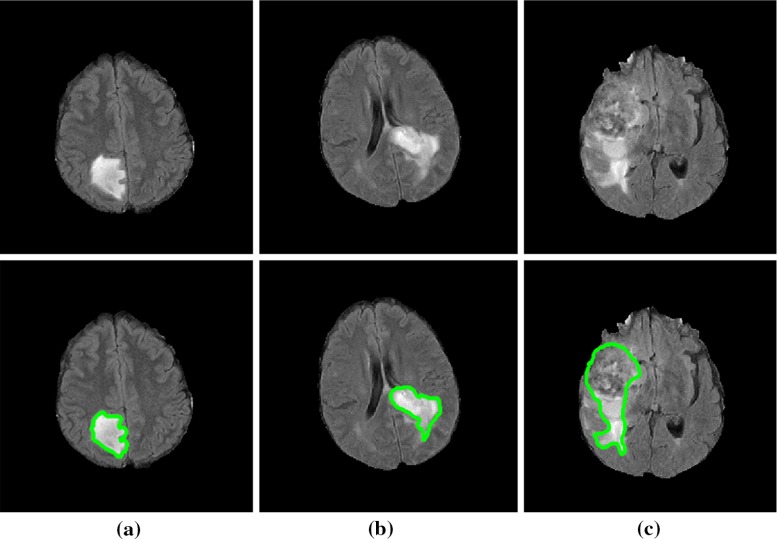
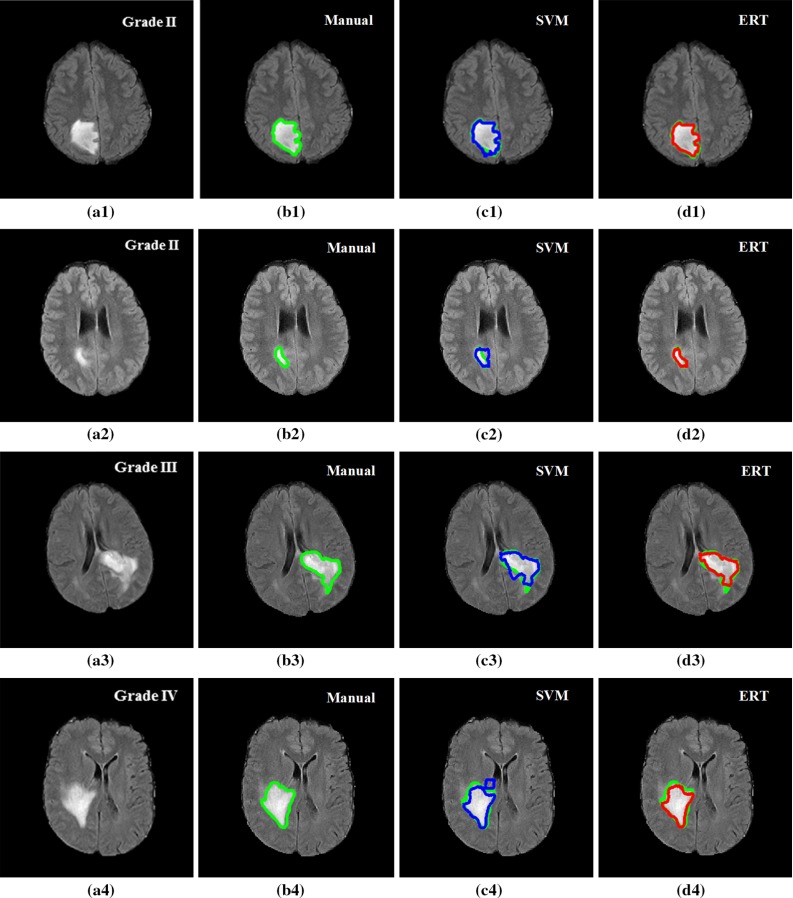
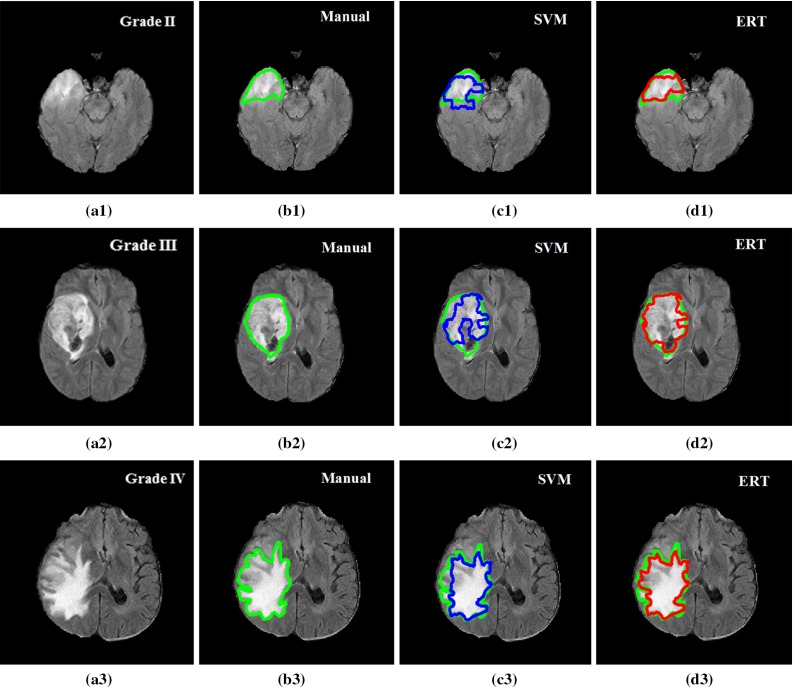
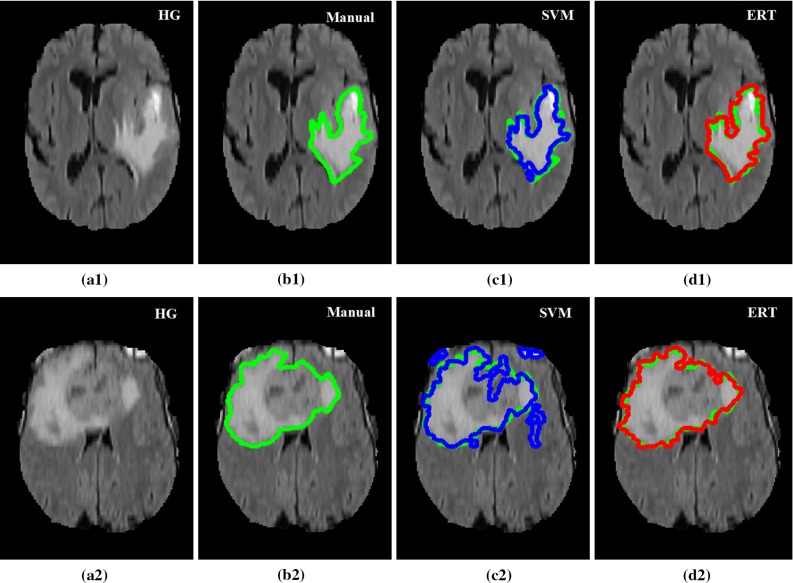
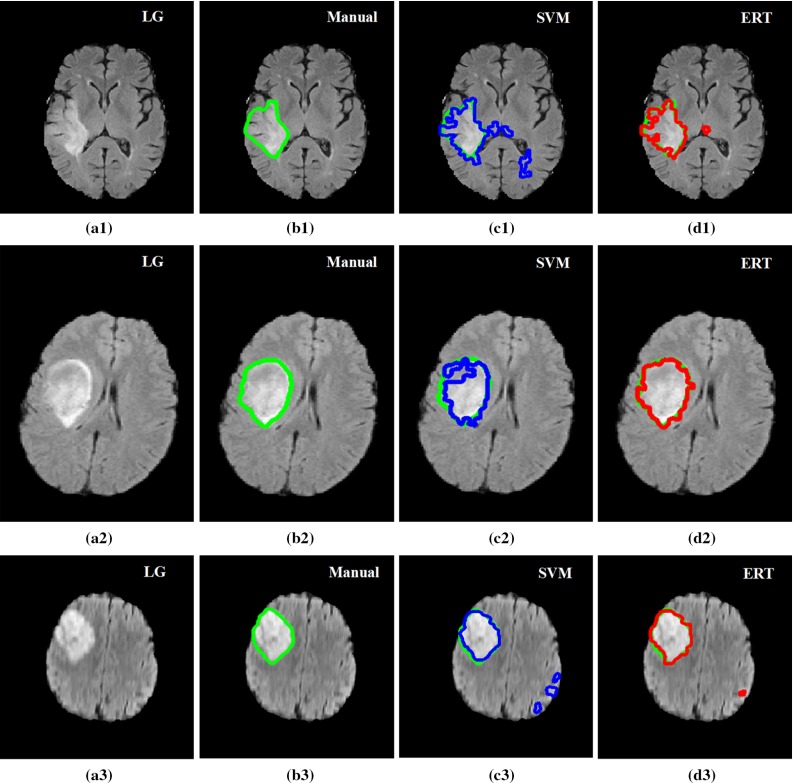
Purpose: We propose a fully automated method for detection and segmentation of the abnormal tissue associated with brain tumour (tumour core and oedema) from Fluid- Attenuated Inversion Recovery (FLAIR) Magnetic Resonance Imaging (MRI).

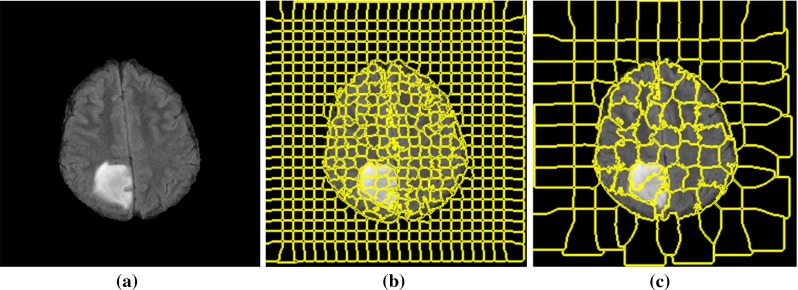
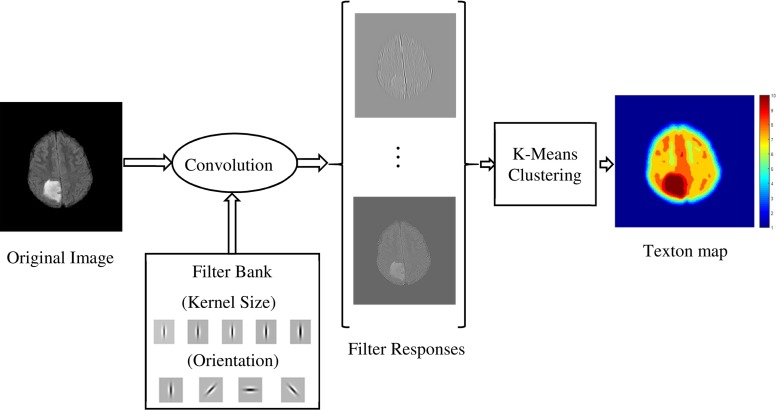
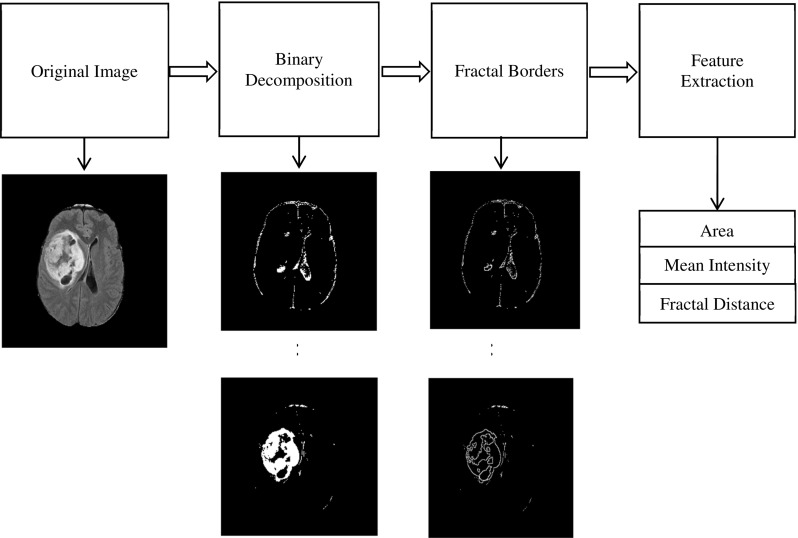
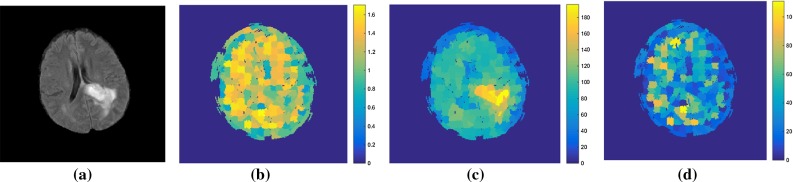
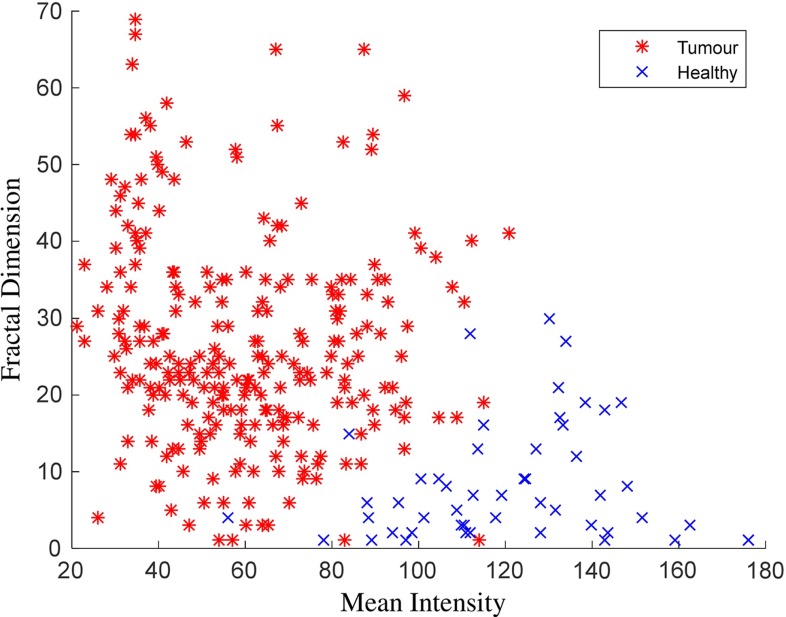
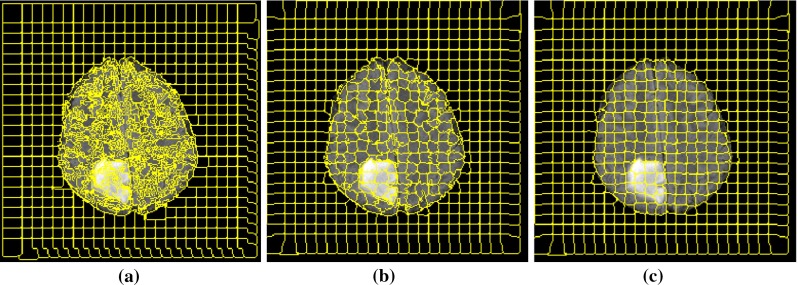
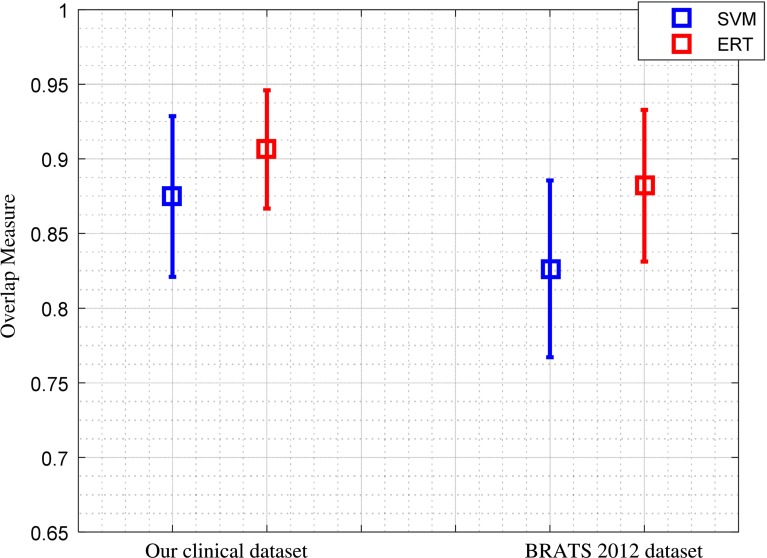
Methods: The method is based on superpixel technique and classification of each superpixel. A number of novel image features including intensity-based, Gabor textons, fractal analysis and curvatures are calculated from each superpixel within the entire brain area in FLAIR MRI to ensure a robust classification. Extremely randomized trees (ERT) classifier is compared with support vector machine (SVM) to classify each superpixel into tumour and non-tumour.

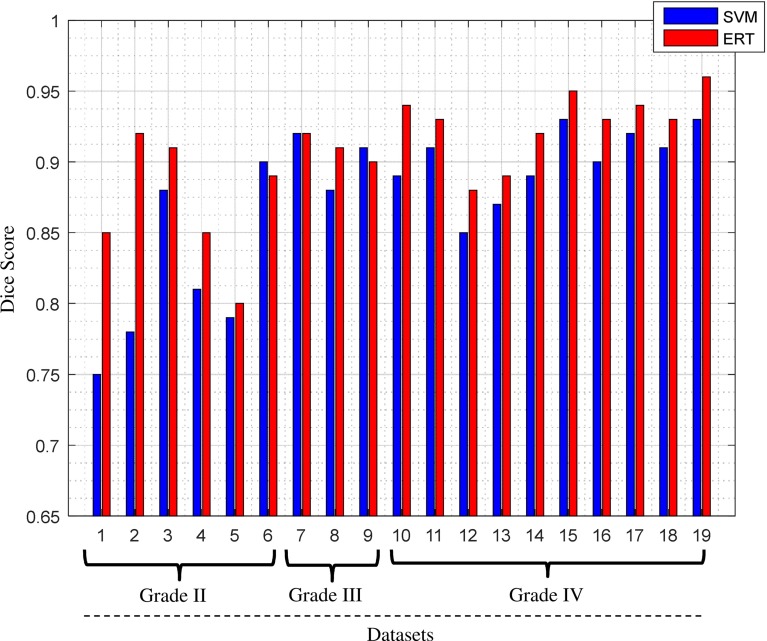
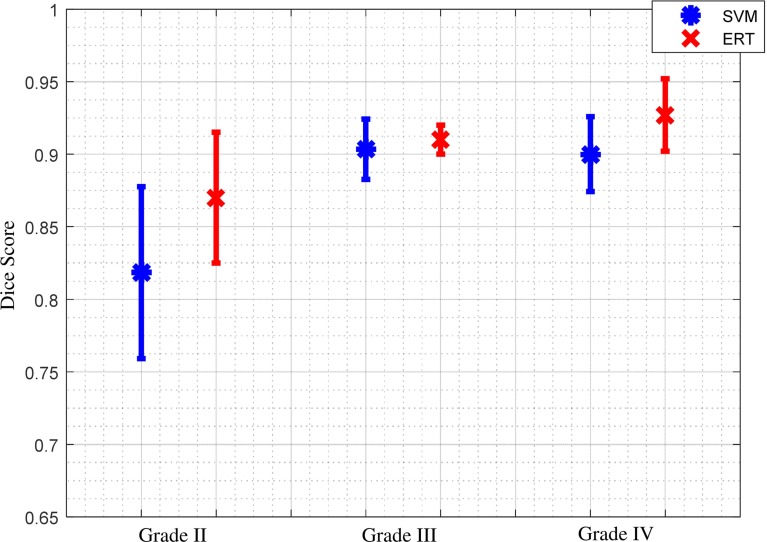
Results: The proposed method is evaluated on two datasets: (1) Our own clinical dataset: 19 MRI FLAIR images of patients with gliomas of grade II to IV, and (2) BRATS 2012 dataset: 30 FLAIR images with 10 low-grade and 20 high-grade gliomas. The experimental results demonstrate the high detection and segmentation performance of the proposed method using ERT classifier. For our own cohort, the average detection sensitivity, balanced error rate and the Dice overlap measure for the segmented tumour against the ground truth are 89.48 %, 6 % and 0.91, respectively, while, for the BRATS dataset, the corresponding evaluation results are 88.09 %, 6 % and 0.88, respectively.

Conclusions: This provides a close match to expert delineation across all grades of glioma, leading to a faster and more reproducible method of brain tumour detection and delineation to aid patient management.

Keywords: Brain tumour segmentation; Extremely randomized trees; Feature selection; Magnetic resonance imaging; Superpixels; Textons.


Conflict of interest statement

The authors declare they have no conflict of interest with regard to the work presented. Ethical approval Ethical approval to conduct this study was obtained from Local Committee of St George’s Hospital, London. Informed consent Informed consent was obtained from all individual participants in the study.

Figures

Fig. 1
Fig. 1
Flowchart of the proposed method
Fig. 2
Fig. 2
Example of superpixel segmentation with different window sizes: a original MRI FLAIR image with a grade II tumour, b superpixel segmentation with S=10 (initial grids 10×10) and m=0.2, c superpixel segmentation with S=20 (initial grids 20×20) and m=0.2
Fig. 3
Fig. 3
Procedure of texton feature extraction using Gabor filters applied to a grade II glioma
Fig. 4
Fig. 4
The flowchart of extracting fractal features from a grade III glioma
Fig. 5
Fig. 5
An example of fractal analysis applied to a grade III glioma to generate superpixel-based fractal feature maps: a FLAIR image, b area, c mean intensity and d fractal dimension
Fig. 6
Fig. 6
Fractal dimension versus mean intensity for healthy and tumour superpixels calculated from one FLAIR MRI data with grade IV glioma
Fig. 7
Fig. 7
FLAIR images with different tumour grades in upper row and their ground-truth manual segmentation of the FLAIR hyperintensity in the lower row. Tumour grades are: a grade II, b grade III and c grade IV
Fig. 8
Fig. 8
Superpixel segmentation with S=10 and different compactness: a m=0, b m=0.2 and c m=0.5
Fig. 9
Fig. 9
Effect of number of threshold levels on the classification accuracy
Fig. 10
Fig. 10
Comparison of Dice score overlap measure of SVM versus ERT for all our clinical patient data (19 scans). Dice score in vertical axis starts from 0.65 for better illustration
Fig. 11
Fig. 11
Comparison between average and standard deviation of Dice score overlap measure for SVM versus ERT for different tumour grade types II to IV
Fig. 12
Fig. 12
Examples of segmentation results overlay on manual segmentation (green). FLAIR image with tumour grade II (a1), grade II (a2), grade III (a3) and grade IV (a4); b1b4 manual segmentation; c1c4 results using SVM; and d1d4 results using ERT. Both SVM- and ERT-based methods obtained satisfactory results for the segmentation of different tumour types, with ERT-based method providing slightly better results than that from SVM
Fig. 13
Fig. 13
Examples of good detection and segmentation results obtained from ERT-based methods. FLAIR image with tumour grade II (a1), grade III (a2), grade IV (a3); b1b3 manual segmentation; c1c3 results using SVM; and d1d3 results using ERT. Most of the false-positive superpixels from SVM (e.g. (c1) and (c3)) can be effectively eliminated using ERT, while some tumour superpixels which are wrongly classified to the normal brain tissues by using SVM (e.g. (c2)) can be correctly classified as tumour by using the ERT
Fig. 14
Fig. 14
Examples of detection and segmentation results obtained from ERT-based methods on BRATS 2012 data. FLAIR image with high-grade tumour Case HG-01 (a1), HG-15 (a2); b1b2 manual segmentation; c1c2 results using SVM; and d1d2 results using ERT
Fig. 15
Fig. 15
Examples of detection and segmentation results obtained from ERT-based methods on BRATS 2012 data. FLAIR image with low-grade tumour Case LG-04 (a1), LG-11 (a2) and LG-12 (a3); b1b3 manual segmentation; c1c3 results using SVM; and d1d3 results using ERT
Fig. 16
Fig. 16
Comparison of the average and standard deviation of Dice score overlap measures for SVM versus ERT for all 19 data scans in our dataset and 30 clinical scans in BRATS 2012 dataset

References

    1. Wen PY, Macdonald DR, Reardon DA, Cloughesy TF, Sorensen AG, Galanis E, DeGroot J, Wick W, Gilbert MR, Lassman AB, Tsien C, Mikkelsen T, Wong ET, Chamberlain MC, Stupp R, Lamborn KR, Vogelbaum MA, van den Bent MJ, Chang SM. Updated response assessment criteria for high-grade gliomas: response assessment in Neuro-Oncology Working Group. JCO. 2010;28:1963–1972. doi: 10.1200/JCO.2009.26.3541. - DOI - PubMed
    1. Niyazi M, Brada M, Chalmers AJ, Combs SE, Erridge SC, Fiorentino A, Grosu AL, Lagerwaard FJ, Minniti G, Mirimanoff R-O, Ricardi U, Short SC, Weber DC, Belka C. ESTRO-ACROP guideline “target delineation of glioblastomas.”. Radiother Oncol. 2016;118:35–42. doi: 10.1016/j.radonc.2015.12.003. - DOI - PubMed
    1. Rees J, Watt H, Jäger HR, Benton C, Tozer D, Tofts P, Waldman A. Volumes and growth rates of untreated adult low-grade gliomas indicate risk of early malignant transformation. Eur J Radiol. 2009;72:54–64. doi: 10.1016/j.ejrad.2008.06.013. - DOI - PubMed
    1. Eisele SC, Wen PY, Lee EQ. Assessment of brain tumor response: RANO and its offspring. Curr Treat Options Oncol. 2016;17:35. doi: 10.1007/s11864-016-0413-5. - DOI - PubMed
    1. Aslian H, Sadeghi M, Mahdavi SR, Babapour Mofrad F, Astarakee M, Khaledi N, Fadavi P. Magnetic resonance imaging-based target volume delineation in radiation therapy treatment planning for brain tumors using localized region-based active contour. Int J Radiat Oncol Biol Phys. 2013;87:195–201. doi: 10.1016/j.ijrobp.2013.04.049. - DOI - PubMed