

Identification of a novel distal regulatory element of the human Neuroglobin gene by the chromosome conformation capture approach
- PMID: 27651453
- PMCID: PMC5224503
- DOI: 10.1093/nar/gkw820
Identification of a novel distal regulatory element of the human Neuroglobin gene by the chromosome conformation capture approach
Abstract
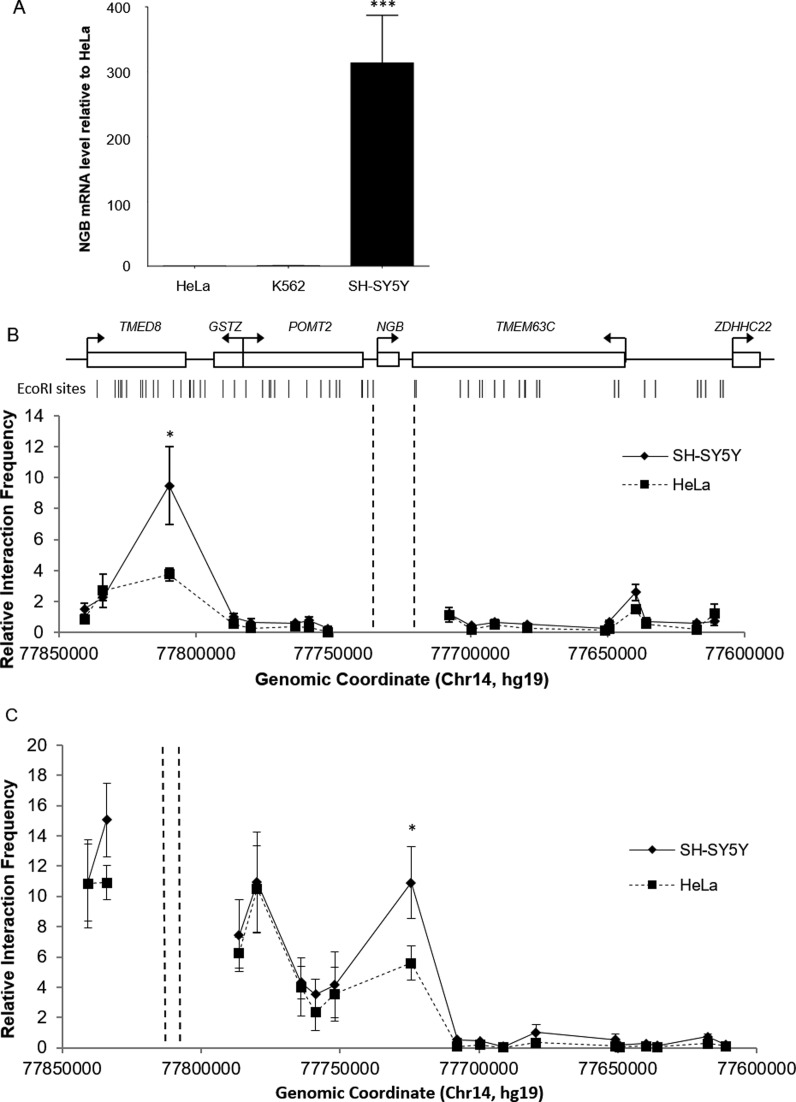
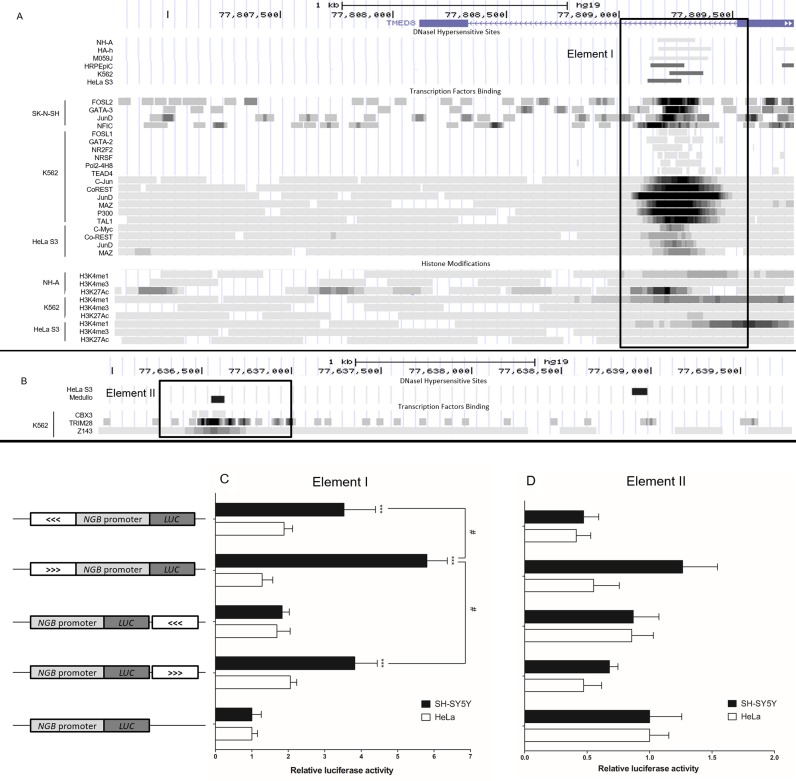
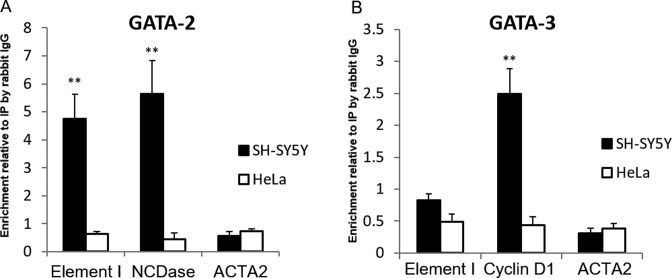
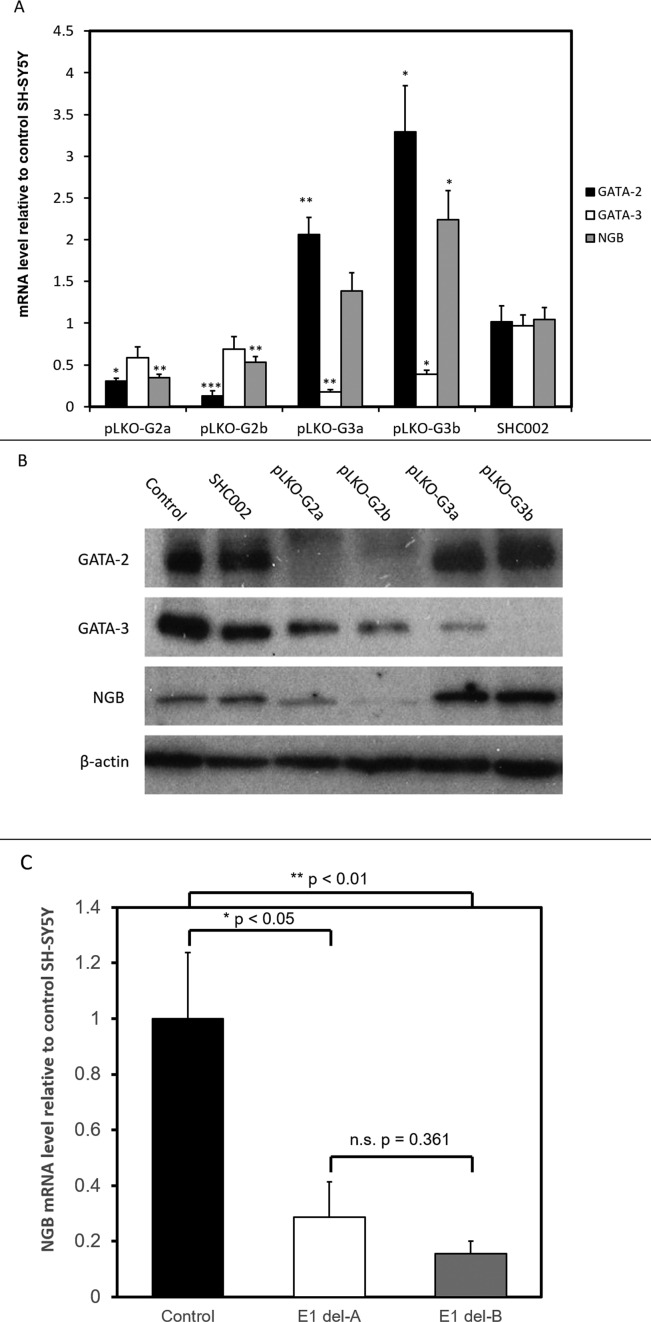
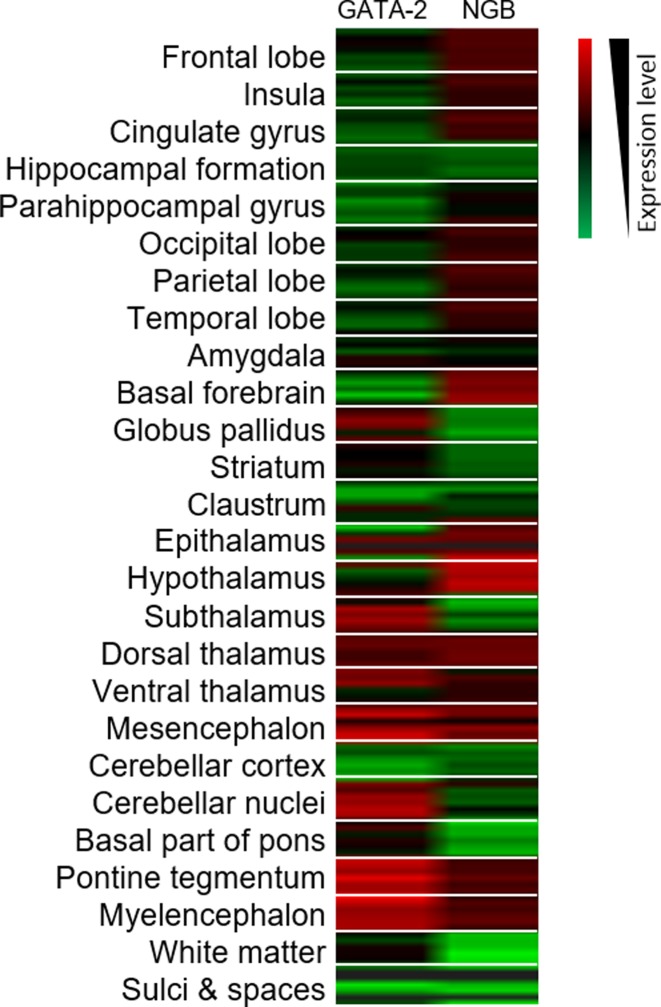
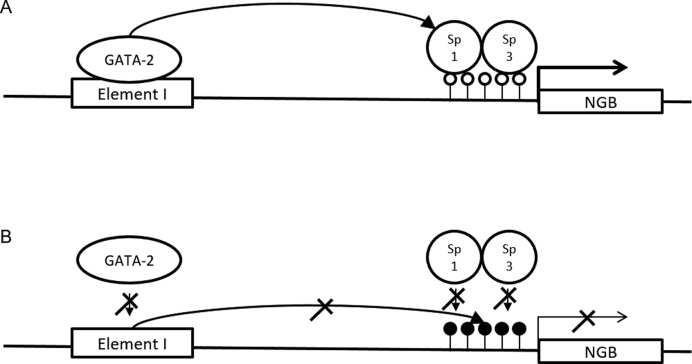
Neuroglobin (NGB) is predominantly expressed in the brain and retina. Studies suggest that NGB exerts protective effects to neuronal cells and is implicated in reducing the severity of stroke and Alzheimer's disease. However, little is known about the mechanisms which regulate the cell type-specific expression of the gene. In this study, we hypothesized that distal regulatory elements (DREs) are involved in optimal expression of the NGB gene. By chromosome conformation capture we identified two novel DREs located -70 kb upstream and +100 kb downstream from the NGB gene. ENCODE database showed the presence of DNaseI hypersensitive and transcription factors binding sites in these regions. Further analyses using luciferase reporters and chromatin immunoprecipitation suggested that the -70 kb region upstream of the NGB gene contained a neuronal-specific enhancer and GATA transcription factor binding sites. Knockdown of GATA-2 caused NGB expression to drop dramatically, indicating GATA-2 as an essential transcription factor for the activation of NGB expression. The crucial role of the DRE in NGB expression activation was further confirmed by the drop in NGB level after CRISPR-mediated deletion of the DRE. Taken together, we show that the NGB gene is regulated by a cell type-specific loop formed between its promoter and the novel DRE.
© The Author(s) 2016. Published by Oxford University Press on behalf of Nucleic Acids Research.
Figures
Similar articles
-
Functional and sequence analysis of human neuroglobin gene promoter region.Biochim Biophys Acta. 2011 Apr-Jun;1809(4-6):236-44. doi: 10.1016/j.bbagrm.2011.02.003. Epub 2011 Mar 9. Biochim Biophys Acta. 2011. PMID: 21362510
-
Transcriptional regulation mechanisms of hypoxia-induced neuroglobin gene expression.Biochem J. 2012 Apr 1;443(1):153-64. doi: 10.1042/BJ20111856. Biochem J. 2012. PMID: 22239089
-
Transcriptional regulation of mouse neuroglobin gene by cyclic AMP responsive element binding protein (CREB) in N2a cells.Neurosci Lett. 2013 Feb 8;534:333-7. doi: 10.1016/j.neulet.2012.11.025. Epub 2012 Nov 23. Neurosci Lett. 2013. PMID: 23182882 Free PMC article.
-
Neuroglobin and neuronal cell survival.Biochim Biophys Acta. 2013 Sep;1834(9):1744-9. doi: 10.1016/j.bbapap.2013.01.015. Epub 2013 Jan 26. Biochim Biophys Acta. 2013. PMID: 23357651 Review.
-
Neuroglobin, a novel target for endogenous neuroprotection against stroke and neurodegenerative disorders.Int J Mol Sci. 2012;13(6):6995-7014. doi: 10.3390/ijms13066995. Epub 2012 Jun 7. Int J Mol Sci. 2012. PMID: 22837676 Free PMC article. Review.
Cited by
-
Network Medicine Approach for Analysis of Alzheimer's Disease Gene Expression Data.Int J Mol Sci. 2020 Jan 3;21(1):332. doi: 10.3390/ijms21010332. Int J Mol Sci. 2020. PMID: 31947790 Free PMC article.
-
Functional characterization of ABCA4 genetic variants related to Stargardt disease.Sci Rep. 2022 Dec 24;12(1):22282. doi: 10.1038/s41598-022-26912-6. Sci Rep. 2022. PMID: 36566289 Free PMC article.
-
CRISPR-based strategies for studying regulatory elements and chromatin structure in mammalian gene control.Mamm Genome. 2018 Apr;29(3-4):205-228. doi: 10.1007/s00335-017-9727-2. Epub 2017 Dec 1. Mamm Genome. 2018. PMID: 29196861 Free PMC article. Review.
-
Integrative bioinformatic approach reveals novel melatonin-related biomarkers for Alzheimer's disease.Sci Rep. 2025 Feb 4;15(1):4193. doi: 10.1038/s41598-024-80755-x. Sci Rep. 2025. PMID: 39905093 Free PMC article.
-
Molecular crosstalk between COVID-19 and Alzheimer's disease using microarray and RNA-seq datasets: A system biology approach.Front Med (Lausanne). 2023 Jun 7;10:1151046. doi: 10.3389/fmed.2023.1151046. eCollection 2023. Front Med (Lausanne). 2023. PMID: 37359008 Free PMC article.
References
-
- Forrester W., Epner E., Driscoll M., Enver T., Brice M., Papayannopoulou T., Groudine M. A deletion of the human beta-globin locus activation region causes a major alteration in chromatin structure and replication across the entire beta-globin locus. Genes Dev. 1990;4:1637–1649. - PubMed
-
- Berman B.P., Nibu Y., Pfeiffer B.D., Tomancak P., Celniker S.E., Levine M., Rubin G.M., Eisen M.B. Exploiting transcription factor binding site clustering to identify cis-regulatory modules involved in pattern formation in the Drosophila genome. Proc. Natl. Acad. Sci. U.S.A. 2002;99:757–762. - PMC - PubMed
-
- Maston G.A., Evans S.K., Green M.R. Transcriptional regulatory elements in the human genome. Annu. Rev. Genomics Hum. Genet. 2006;7:29–59. - PubMed
MeSH terms
Substances
Grants and funding
LinkOut - more resources
Full Text Sources
Other Literature Sources
