. 2016 Nov 16;44(20):9831-9846.
doi: 10.1093/nar/gkw825. Epub 2016 Sep 19.

A small stem-loop structure of the Ebola virus trailer is essential for replication and interacts with heat-shock protein A8

Affiliations

A small stem-loop structure of the Ebola virus trailer is essential for replication and interacts with heat-shock protein A8

Joanna Sztuba-Solinska et al. Nucleic Acids Res. .

Abstract

Ebola virus (EBOV) is a single-stranded negative-sense RNA virus belonging to the Filoviridae family. The leader and trailer non-coding regions of the EBOV genome likely regulate its transcription, replication, and progeny genome packaging. We investigated the cis-acting RNA signals involved in RNA-RNA and RNA-protein interactions that regulate replication of eGFP-encoding EBOV minigenomic RNA and identified heat shock cognate protein family A (HSC70) member 8 (HSPA8) as an EBOV trailer-interacting host protein. Mutational analysis of the trailer HSPA8 binding motif revealed that this interaction is essential for EBOV minigenome replication. Selective 2'-hydroxyl acylation analyzed by primer extension analysis of the secondary structure of the EBOV minigenomic RNA indicates formation of a small stem-loop composed of the HSPA8 motif, a 3' stem-loop (nucleotides 1868-1890) that is similar to a previously identified structure in the replicative intermediate (RI) RNA and a panhandle domain involving a trailer-to-leader interaction. Results of minigenome assays and an EBOV reverse genetic system rescue support a role for both the panhandle domain and HSPA8 motif 1 in virus replication.


Figures

Figure 1.
Figure 1.
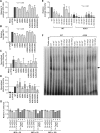
EMSAs of the EBOV trailer demonstrating interaction with host proteins. (A) Representative EMSA using probe 1–50 in the presence of cold 1–50 competitor and tRNA. The black arrow indicates the complex used for quantification. (B) Relative average background-corrected intensity of at least three independent experiments using the 1–50 probe compared to wt probe. (C) Relative quantification of probe 1–116 competition with increasing concentration of unlabeled 1–116. (D) Relative quantification of probe 1–730 competition with increasing concentration of unlabeled 1–730. * indicates statistical significance.
Figure 2.
Figure 2.
The host protein HSPA8 binds to the EBOV genome trailer. (A) Representative silver-stained gel used for mass-spectrometry analysis. Number 1 indicates the area where specific bands were identified)). (B) Summation of the mass-spectrometry data identifying HSPA8. (C) IP-RT-PCR results confirming interaction between HSPA8 and the EBOV genome trailer. Line labeled as ‘NEG’ indicates parallel samples that excluded the HSPA8 antibody. (D) Western blot confirming immunoprecipitation of HSPA8, NEG indicates parallel control samples that excluded the HSPA8 antibody.
Figure 3.
Figure 3.
Role of the HSPA8 motif 1 in the EBOV lifecycle. (A) Representation of relative percentage of GFP-positive cells transfected with motif 1 single and double mutants. (B). Representation of median fluorescence intensity (MFI) for GFP-positive cells infected with motif 1 single and double mutants. (C) Summation of northern blot results representing the levels of minigenome RNA synthesis for motif 1 mutants (D) Summation of northern blot results representing the levels of RI synthesis for motif 1 mutants. (E). Summary of EMSA data comparing wt 1–116 probe to the HSPA8 motif 1 A30U single nucleotide mutant. (F) Representative EMSA for wt vs. A30U mutant. (G) siRNA targeting of HSPA8.
Figure 4.
Figure 4.
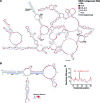
Secondary structure of nt 1–1945 of EBOV 3E-5E minigenome RNA. (A) Processed SHAPE reactivities are presented as a function of nucleotide position. Red notations are expected to fall into single-stranded regions, whereas bases indicated in white correspond predominantly to either double-stranded regions or putative tertiary interactions. Gray nucleotides correspond to residues for which no SHAPE signal values were measured either due to pausing during reverse transcription or the position of 3′ primer hybridization. Data shown are an average of at least three experiments. Individual RNA domains have been annotated trailer-to-leader interaction, HSPA8 motifs 1–3 and the nt 1868–1890 hairpin. * cont. GFP indicates a break in the structure which contains the GFP open reading frame. (B) Structural response of the trailer-to-leader panhandle to antisense oligomers. The secondary structure of the wt EBOV minigenome RNA is indicated according to SHAPE predictions. Gray residues represent formation of an extensive stop during reverse transcription at the position of LNA hybridization. The position of two LNA/DNA chimeras hybridized to the leader is indicated with blue lines. RNAstructure predicted alteration of the trailer structure is indicated below. Residues resulting in a reactivity increase (red) or decrease (blue) are indicated. (C) Step plot representing the reactivity difference noted within nt 1–50 of the trailer in SHAPE and aiSHAPE experiments. (D) Structural map of the Δ2–56 EBOV minigenome RNA mutant. Domains unaffected by introducing the deletion as compared to wt-EBOV minigenome RNA are indicated. Nucleotide reactivities are color-coded as shown in the key and numbered every 10 nt. * cont. GFP indicates a break in the structure which contains the GFP open reading frame. (E and F) Structural map of the trailer-to-leader interaction for the A30U and A26UA30U mutants, respectively. Sites of mutation are indicated with arrows.
Figure 4.
Figure 4.
Secondary structure of nt 1–1945 of EBOV 3E-5E minigenome RNA. (A) Processed SHAPE reactivities are presented as a function of nucleotide position. Red notations are expected to fall into single-stranded regions, whereas bases indicated in white correspond predominantly to either double-stranded regions or putative tertiary interactions. Gray nucleotides correspond to residues for which no SHAPE signal values were measured either due to pausing during reverse transcription or the position of 3′ primer hybridization. Data shown are an average of at least three experiments. Individual RNA domains have been annotated trailer-to-leader interaction, HSPA8 motifs 1–3 and the nt 1868–1890 hairpin. * cont. GFP indicates a break in the structure which contains the GFP open reading frame. (B) Structural response of the trailer-to-leader panhandle to antisense oligomers. The secondary structure of the wt EBOV minigenome RNA is indicated according to SHAPE predictions. Gray residues represent formation of an extensive stop during reverse transcription at the position of LNA hybridization. The position of two LNA/DNA chimeras hybridized to the leader is indicated with blue lines. RNAstructure predicted alteration of the trailer structure is indicated below. Residues resulting in a reactivity increase (red) or decrease (blue) are indicated. (C) Step plot representing the reactivity difference noted within nt 1–50 of the trailer in SHAPE and aiSHAPE experiments. (D) Structural map of the Δ2–56 EBOV minigenome RNA mutant. Domains unaffected by introducing the deletion as compared to wt-EBOV minigenome RNA are indicated. Nucleotide reactivities are color-coded as shown in the key and numbered every 10 nt. * cont. GFP indicates a break in the structure which contains the GFP open reading frame. (E and F) Structural map of the trailer-to-leader interaction for the A30U and A26UA30U mutants, respectively. Sites of mutation are indicated with arrows.
Figure 5.
Figure 5.
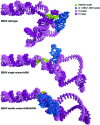
Three-dimensional projection models of the trailer-to-leader interaction in EBOV minigenome wt, A30U and A26UA30U RNAs. The 170 nt of internally deleted EBOV wt and mutant minigenome RNA are depicted. Specific cis-acting motifs and domains are color-coded as shown in the key. The models indicate that the previously defined VP30-binding site stem-loop is near to HSPA8 motif 1. A30U and A26UA30U mutations affect the spatial arrangement between these stem-loop structures.

Similar articles

Cited by

References

    1. Elliott L.H., Sanchez A., Holloway B.P., Kiley M.P., McCormick J.B. Ebola protein analyses for the determination of genetic organization. Arch. Virol. 1993;133:423–436. - PubMed
    1. Sanchez A., Kiley M.P., Holloway B.P., Auperin D.D. Sequence analysis of the Ebola virus genome: organization, genetic elements, and comparison with the genome of Marburg virus. Virus Res. 1993;29:215–240. - PubMed
    1. Brauburger K., Boehmann Y., Tsuda Y., Hoenen T., Olejnik J., Schümann M., Ebihara H., Mühlberger E. Analysis of the highly diverse gene borders in Ebola virus reveals a distinct mechanism of transcriptional regulation. J. Virol. 2014;88:12558–12571. - PMC - PubMed
    1. Fricke M., Dunnes N., Zayas M., Bartenschlager R., Niepmann M., Marz M. Conserved RNA secondary structures and long-range interactions in hepatitis C viruses. RNA. 2015;21:1219–1232. - PMC - PubMed
    1. Mauger D.M., Siegfried N.A., Weeks K.M. The genetic code as expressed through relationships between mRNA structure and protein function. FEBS Lett. 2013;587:1180–1188. - PMC - PubMed

MeSH terms