. 2016 Oct 4;113(40):E5896-E5905.
doi: 10.1073/pnas.1610081113. Epub 2016 Sep 20.

Single-cell dynamics and variability of MAPK activity in a yeast differentiation pathway

Affiliations

Single-cell dynamics and variability of MAPK activity in a yeast differentiation pathway

Patrick Conlon et al. Proc Natl Acad Sci U S A. .

Abstract

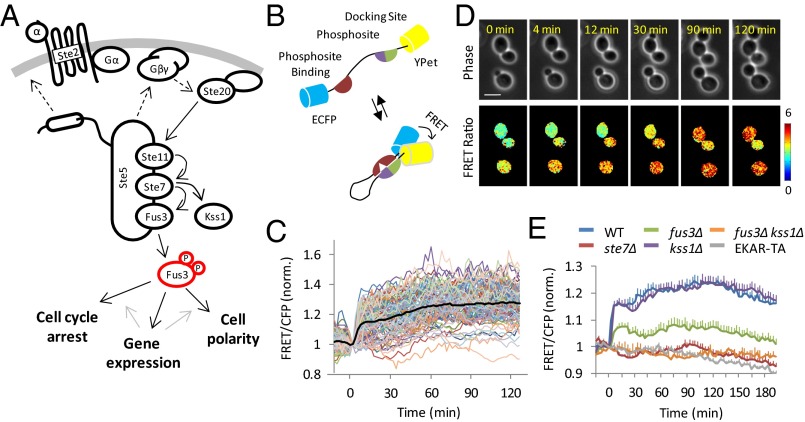
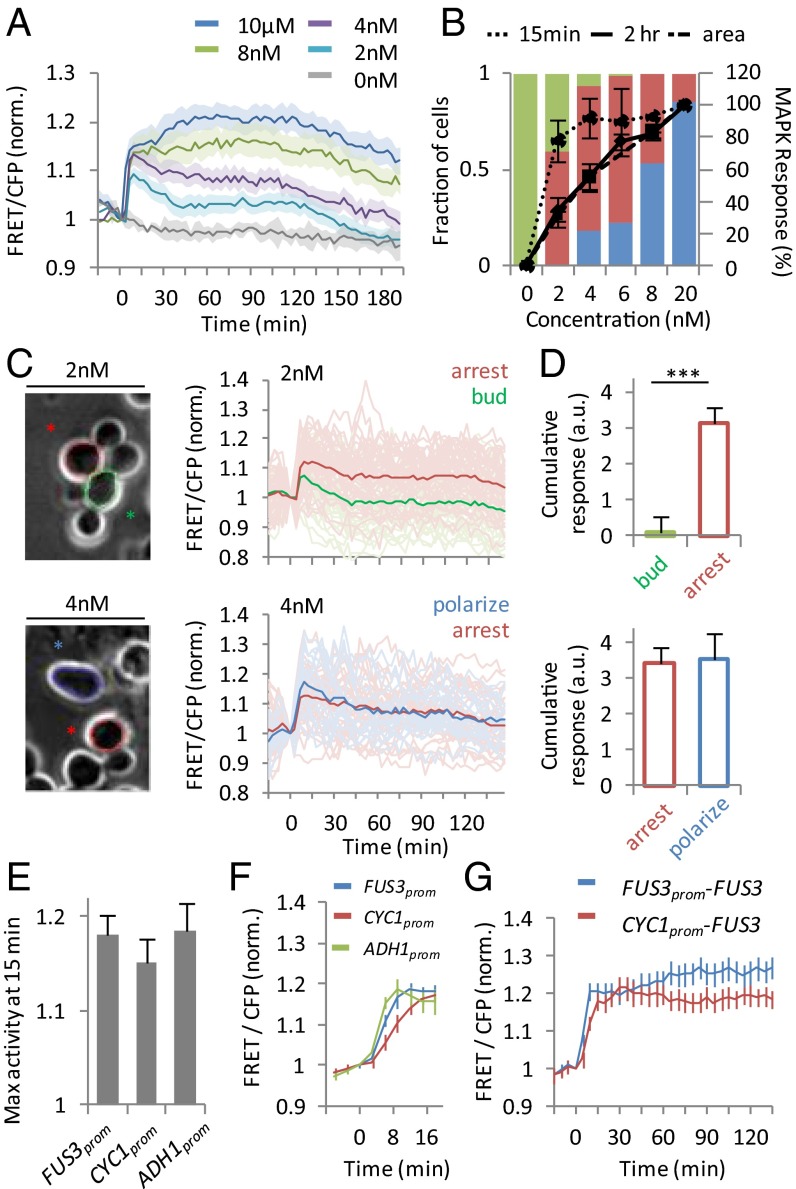
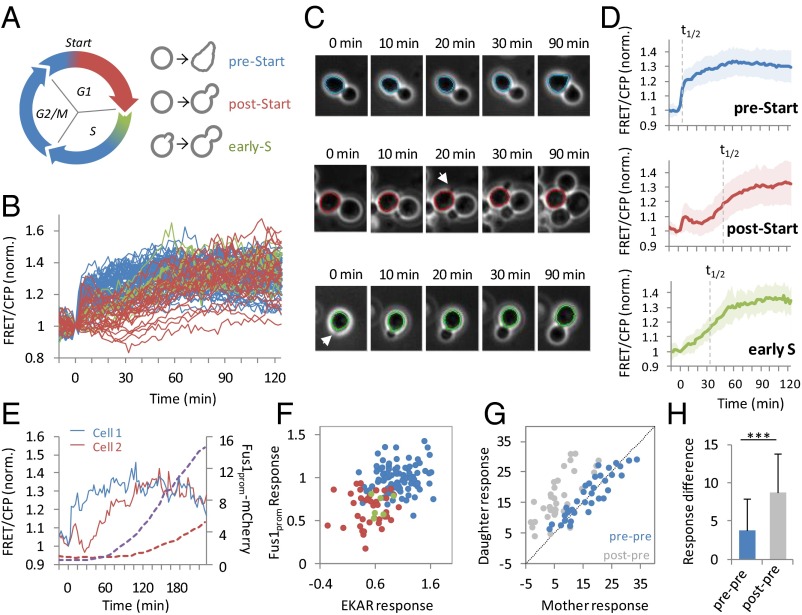
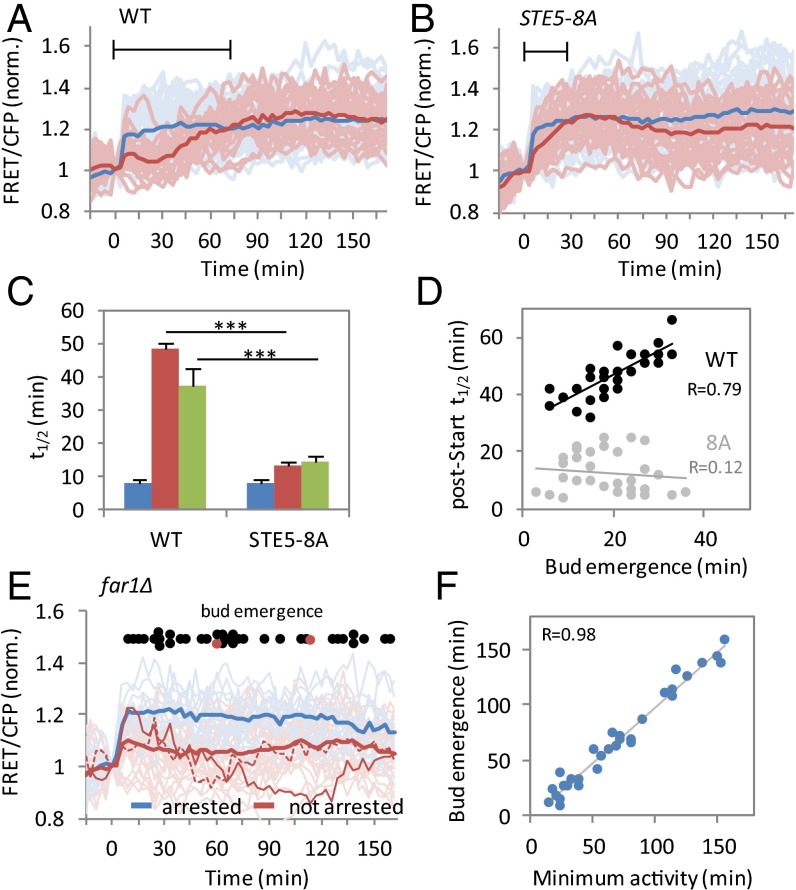
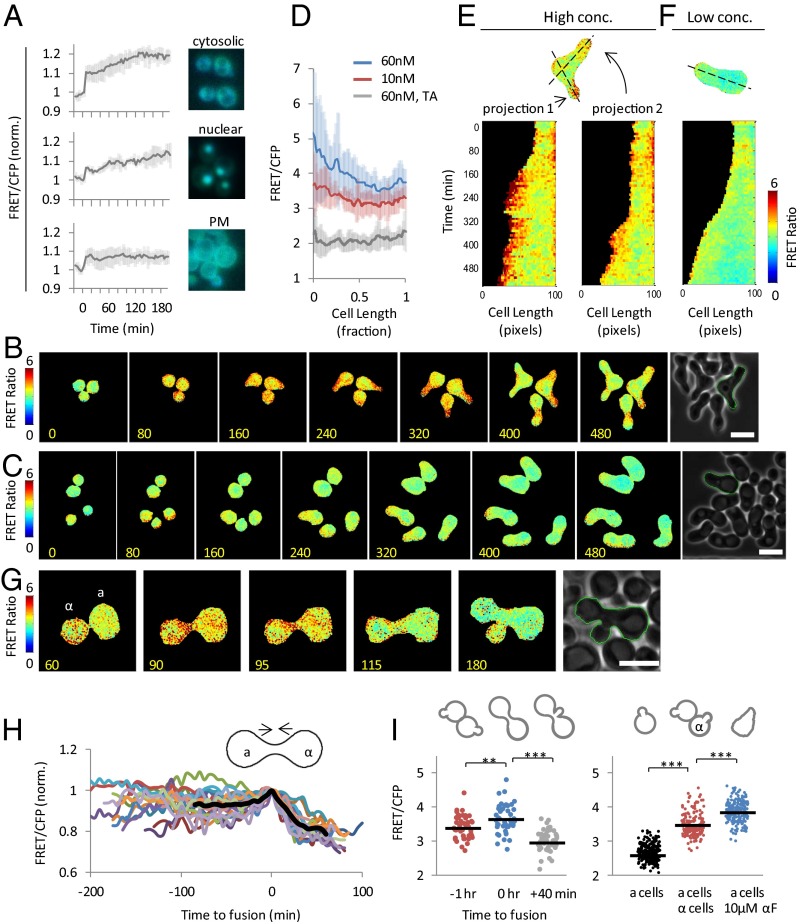
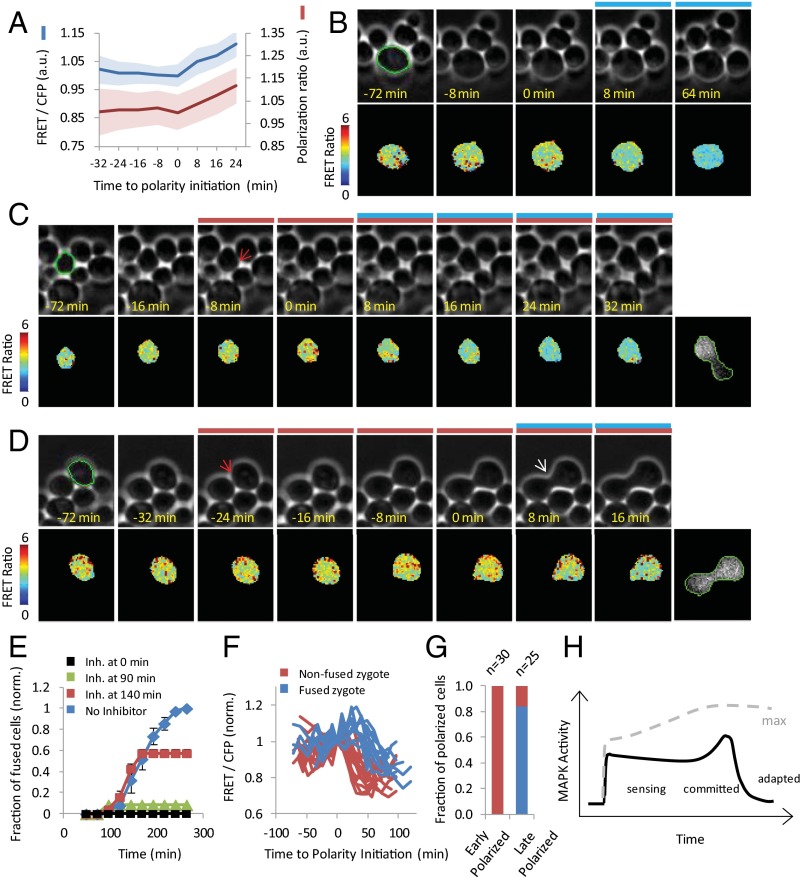
In response to pheromones, yeast cells activate a MAPK pathway to direct processes important for mating, including gene induction, cell-cycle arrest, and polarized cell growth. Although a variety of assays have been able to elucidate signaling activities at multiple steps in the pathway, measurements of MAPK activity during the pheromone response have remained elusive, and our understanding of single-cell signaling behavior is incomplete. Using a yeast-optimized FRET-based mammalian Erk-activity reporter to monitor Fus3 and Kss1 activity in live yeast cells, we demonstrate that overall mating MAPK activity exhibits distinct temporal dynamics, rapid reversibility, and a graded dose dependence around the KD of the receptor, where phenotypic transitions occur. The complex dose response was found to be largely a consequence of two feedbacks involving cyclin-mediated scaffold phosphorylation and Fus3 autoregulation. Distinct cell cycle-dependent response patterns comprised a large portion of the cell-to-cell variability at each dose, constituting the major source of extrinsic noise in coupling activity to downstream gene-expression responses. Additionally, we found diverse spatial MAPK activity patterns to emerge over time in cells undergoing default, gradient, and true mating responses. Furthermore, ramping up and rapid loss of activity were closely associated with zygote formation in mating-cell pairs, supporting a role for elevated MAPK activity in successful cell fusion and morphogenic reorganization. Altogether, these findings present a detailed view of spatiotemporal MAPK activity during the pheromone response, elucidating its role in mediating complex long-term developmental fates in a unicellular differentiation system.

Keywords: Fus3; MAPK dynamics; cell signaling; mating pathway; yeast.


Conflict of interest statement

The authors declare no conflict of interest.

Figures

Fig. 1.
Fig. 1.
Probing Fus3 and Kss1 activity in live yeast cells using yEKAREV. (A) Schematic diagram showing the core signaling components and physiological outputs of the yeast mating pathway. (B) Schematic of the yEKAREV biosensor used in this study. (C) Asynchronous cells expressing integrated yEKAREV were treated with 10 µM pheromone and imaged over a 2-h period. Single-cell FRET ratio responses are plotted with average response as a black line (data are from three independent experiments). (D) Representative phase-contrast and FRET ratio images of cells from experiments shown in C. (Scale bar, 5 μm.) (E) Comparison of pheromone responses in WT and mutant MAPK deletion strains expressing yEKAREV, and WT strain expressing nonphosphorylatable yEKAREV-TA. Means and SEMs are shown for WT (PC128), ste7Δ (PC154), fus3Δ (PC155), kss1Δ (PC156), fus3Δkss1Δ (PC196), and yEKAREV-TA (PC162) (n > 40 cells for each strain).
Fig. 2.
Fig. 2.
Dose sensitivity and phenotype coupling of MAPK activity dynamics. (A) WT cells (PC158) were stimulated with the indicated doses of α-factor (colored lines) and FRET ratios were measured for single cells. Means and 95% confidence intervals are shown as a solid line and shaded region, respectively (n > 50 cells for each concentration). (B) Fraction of WT cells exhibiting a specific phenotype after a 3.5-h pheromone exposure: continued budding (green), arrested cells that remained round (red), and cells undergoing polarized growth (blue). Average yEKAREV response at 15 min (dotted line), 2 h (solid line), and a cumulative 2-h response (dashed line) is overlaid (mean ± SEM, n = 3 independent experiments). (C, Top) Phase-contrast image (Left) and single-cell yEKAREV responses (Right) at 2 nM pheromone, grouped by phenotype: continued budding (green lines) and arrested cell cycle (red lines). (Bottom) Phase-contrast image (Left) and single-cell yEKAREV responses (Right) at 4 nM pheromone, grouped by phenotype: arrested and nonpolarized (red lines) or arrested with polarized cell growth (blue lines). Cells budding within the first 30 min of treatment were omitted from analysis. Bold lines show mean response. Cells in images are outlined by phenotype color. (D) Average cumulative response (activity integrated over 2 h) for each phenotype grouping shown in C (mean ± SEM, ***P < 0.001). a.u., arbitrary units. (E) Cells expressing yEKAREV and a C-terminal mCherry fusion of endogenous Fus3 under control of either the wild-type FUS3, CYC1, or ADH1 promoter were treated with 10 µM pheromone. Maximum FRET ratio attained within the first 15 min of pheromone treatment (mean ± SD, n = 3 independent experiments). (F) Average FRET responses for different promoter strains shortly after pheromone stimulation (mean ± SD, n ≥ 7 fields of view for each strain). (G) Average FRET ratio responses for single cells stimulated before reaching their Start checkpoint in G1 phase (mean ± 95% confidence interval, n > 40 cells).
Fig. 3.
Fig. 3.
Cell-cycle dependence of MAPK activation in single cells during pheromone response. (A) Diagram of the cell cycle with color corresponding to cell-cycle position at the time of pheromone treatment: Pre-Start cells arrest their cell cycle and proceed to form mating projections; post-Start cells undergo one more cycle of budding before arresting their cell cycle and forming projections. Cells initiating bud emergence within a 10-min window before pheromone stimulation were classified as “early-S” cells. (B) Single-cell MAPK activity responses of pre-Start (blue), post-Start (red), and early-S (green) WT cells expressing yEKAREV after 10 µM α-factor treatment. (C) Example images of each cell-cycle group with labeled times after stimulation. Arrows indicate visualization of bud emergence (for post-Start and early-S cells). Cells were imaged at 63× magnification. (D) Average response for each cell-cycle position group, with t1/2 shown as a dashed line: pre-Start (Top; n = 51), post-Start (Middle; n = 25), and early-S (Bottom; n = 10). SD is shown as shaded region. The kinetics were more prolonged and were extended over a longer time period than those reported with an alternate reporter (27). (E) Correlation of transcriptional and MAPK activity responses in single cells. Dual-reporter strain (PC159) time course of representative pre-Start (blue) and post-Start (red) cells showing FRET ratio (solid lines) and PFUS1-mCherry fluorescence (dashed lines) after 10 µM pheromone stimulation. (F) Scatter plot of PFUS1-mCherry fluorescence at 3.5 h (gene expression response) and cumulative yEKAREV signal after 70 min (MAPK activity response) in single cells exposed to 10 µM pheromone. Color indicates the cell-cycle phase as used above. (G) Cumulative yEKAREV responses measured after 1 h of 10 µM pheromone treatment in the following cell lineage pairings: pre-Start mothers and newborn pre-Start daughters (blue); post-Start mothers and newborn pre-Start daughters (gray). (H) Mother–daughter response difference for the pairings in G. Response difference represents the cumulative FRET ratio difference between cells over 1 h of treatment. ***P < 0.001, Student’s t test. Data were combined from three independent experiments.
Fig. 4.
Fig. 4.
Phosphorylation of scaffold regulates onset of pheromone-induced MAPK activity. (A and B) FRET ratio responses measured in wild-type (A) and STE5-8A (B) cells expressing yEKAREV after 10 µM α-factor treatment. Single-cell traces for pre-Start (blue) and post-Start (red) cells are shown with mean response as bold lines. (C) Half-maximum response times for each cell-cycle position group: pre-Start (blue), post-Start (red), and early-S (green). Means and SEMs are shown (WT: pre-Start, n = 42; post-Start, n = 19; early-S, n = 6 cells; STE5-8A: pre-Start, n = 43; post-Start, n = 26; early-S, n = 6 cells). ***P < 0.001. (D) Dependence of half-maximum response on bud emergence time in single post-Start stimulated cells (WT, black; STE5-8A, gray). Correlation coefficients are indicated for each cell type. (E) Single-cell FRET ratio responses in far1Δ cells expressing yEKAREV after 10 µM pheromone treatment. Mean responses are shown in bold for cells that continued to divide (red) or that ceased dividing (blue) after 3.5 h of exposure. Bud emergence times for nonarrested cells are indicated by black dots above. Example traces of two nonarrested cells are highlighted as solid and dotted lines, with corresponding bud emergence times highlighted above. (F) Bud emergence and minimum MAPK activity time plotted for nonarrested far1Δ cells treated with 10 µM pheromone. The correlation coefficient is indicated.
Fig. 5.
Fig. 5.
Spatiotemporal dynamics of MAPK activity during pheromone response and mating morphogenesis. (A) Probing pheromone-induced MAPK activity in different cellular compartments using yEKAREV genetically targeted to the cytoplasm (yEKAREV-cyt, PC201), nucleus (yEKAREV-nuc, PC164), and plasma membrane (yEKAREV-pm, PC152). (A, Left) Normalized FRET ratio time courses for each strain after 10 µM pheromone treatment. Means and SDs are shown (n ≥ 4 fields of view for each strain). (Right) Representative images of overlaid FRET/CFP fluorescence. (B and C) WT cells exposed to a 0- to 80-nM gradient of pheromone in a microfluidic device. Representative FRET ratio images of cells in a 55- to 65-nM range (B) and in a 5- to 10-nM range (C), resulting in multiple-projection and single-projection morphologies, respectively. Pheromone is diffusing from left to right. Phase-contrast images (used for cell segmentation) are shown for the last time point. (Time labels are in minutes. Scale bar, 10 μm.) (D) Intracellular distributions of MAPK activity after development of mating projections for cells in the 60-nM range (blue; n = 24 cells), 10 nM range (red; n = 13 cells), and yEKAREV-TA–expressing cells (control) in the 60-nM range (gray; n = 11 cells). Distributions were measured at 3.5 h for cells in the 60-nM range and 4.5 h for cells in the 10-nM range, because projection formation takes longer for these cells. (E and F) FRET ratio kymographs for example cells outlined in the phase images in B and C, respectively. (G) Representative time course of MATa (PC240) and MATa (PC243) cells undergoing cell conjugation and zygote formation. FRET ratio and phase contrast images are shown. (Time labels are in minutes. Scale bar, 10 μm.) (H) Normalized FRET ratio traces during zygote formation of MATa (PC240) and MATa (PC243) mating partner cells that were mixed and grown together on agarose. (Time = 0 is the interval just before cell fusion.) (I, Left) FRET ratio values for single prezygote cell pairs at −1, 0, and +40 min relative to the cell-fusion step (n = 48 cells, **P < 0.001, ***P < 0.0001, Student’s t test). (Right) Whole-cell FRET ratio data for MATa cells alone (black; n = 210), MATa cells seeded with MATa (PC220) partner cells for 1 h (red; n = 171), and MATa cells treated with 10 µM pheromone for 1 h (blue; n = 201). (***P < 0.0001, Student's t test.)
Fig. 6.
Fig. 6.
Sustained MAPK activity is required for polarization initiation and fusion of mating yeast cells. (A) Whole-cell MAPK activity and cell polarization ratio measured in yEKAREV-expressing cells undergoing mating. Cell polarization ratio (aspect ratio) is the length of the cell along the polarization axis (from the projection tip to the back of the cell) divided by the maximum length of the cell along the orthogonal polarization axis. Data are normalized to the time at which sustained cell polarization begins. Shaded regions represent 95% confidence interval. (B and C) Representative phase-contrast and FRET ratio images of yEKAREV-expressing fus3Δkss1Δ cells harboring an inhibitor-sensitive Fus3 allele (PC199) were coseeded with mating partner cells and treated with 10 µM PP1 (inhibitor) at the indicated time (time relative to inhibitor treatment). (B) Nonpolarized cell engaged with a mating partner fails to polarize after MAPK inhibition. (C) Early-polarized cell engaged with a mating partner fails to undergo cell fusion after MAPK inhibition. (D) Late-polarized cell engaged with a mating partner proceeds to complete cell fusion immediately after PP1 treatment. The presence of inhibitor and a polarized cell state are indicated by blue and red bars above the images, respectively. Red and white arrows correspond to polarity initiation and fusion occurrence, respectively. The prezygote trace with overlaid YFP fluorescence is shown (Right) for cells in C and D. Cells were imaged at 63x magnification. (E) Fraction of inhibitor-sensitive cells that fuse with a mating partner at the indicated time after seeding; 10 µM PP1 was added either at the time of seeding (black), 90 min after seeding (green), 140 min after seeding (red), or not added to the cell mixture (blue). All fractions were normalized to the maximum fraction of fused cells without inhibitor treatment (mean ± SEM). Data were combined from three independent experiments. (F) Whole-cell MAPK activity measured in individual mating cells, which initiated polarized growth prior to MAPK inhibition. Cells that form nonfused (incomplete) and fused zygotes are shown by red and blue lines, respectively. FRET ratio values are normalized to the time of cell-polarity initiation. (G) Fraction of prepolarized cells that form nonfused or fused zygotes, grouped by how long they were polarized before inhibitor treatment (early and late polarized indicate cells polarized less than and greater than 24 min, respectively). (H) Schematic time progression of mating MAPK activity in a typical mating environment (black line) and under saturating pheromone treatment (dashed line).

Similar articles

Cited by

References

    1. Bardwell L. A walk-through of the yeast mating pheromone response pathway. Peptides. 2004;25(9):1465–1476. - PubMed
    1. Chen RE, Thorner J. Function and regulation in MAPK signaling pathways: Lessons learned from the yeast Saccharomyces cerevisiae. Biochim Biophys Acta. 2007;1773(8):1311–1340. - PMC - PubMed
    1. Merlini L, Dudin O, Martin SG. Mate and fuse: How yeast cells do it. Open Biol. 2013;3(3):130008. - PMC - PubMed
    1. Klein S, Reuveni H, Levitzki A. Signal transduction by a nondissociable heterotrimeric yeast G protein. Proc Natl Acad Sci USA. 2000;97(7):3219–3223. - PMC - PubMed
    1. Butty A-C, Pryciak PM, Huang LS, Herskowitz I, Peter M. The role of Far1p in linking the heterotrimeric G protein to polarity establishment proteins during yeast mating. Science. 1998;282(5393):1511–1516. - PubMed

Publication types

MeSH terms

Substances

LinkOut - more resources