. 2016 Sep 27;113(39):11034-9.
doi: 10.1073/pnas.1606004113. Epub 2016 Sep 20.

Clathrin-dependent endocytosis is required for immunity mediated by pattern recognition receptor kinases

Affiliations

Clathrin-dependent endocytosis is required for immunity mediated by pattern recognition receptor kinases

Malick Mbengue et al. Proc Natl Acad Sci U S A. .

Abstract

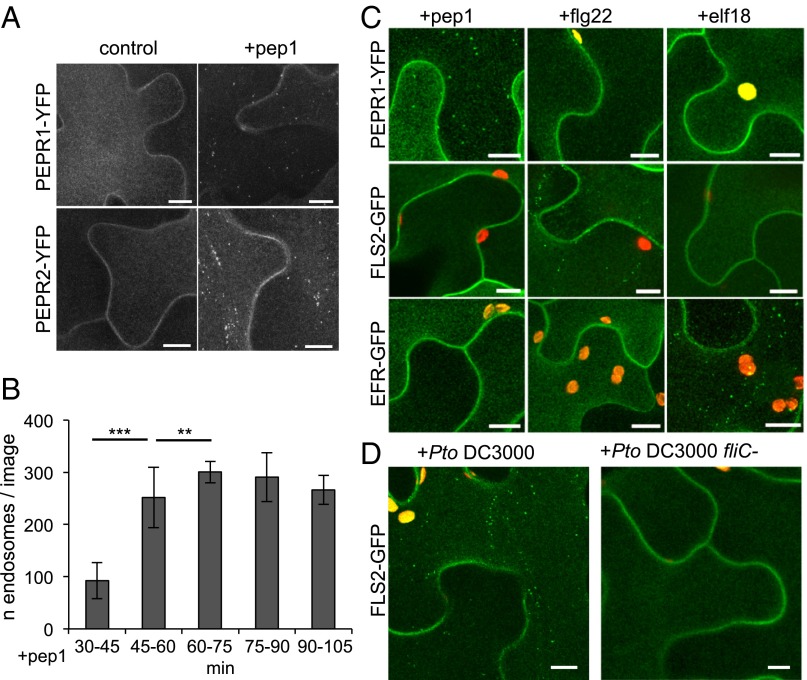
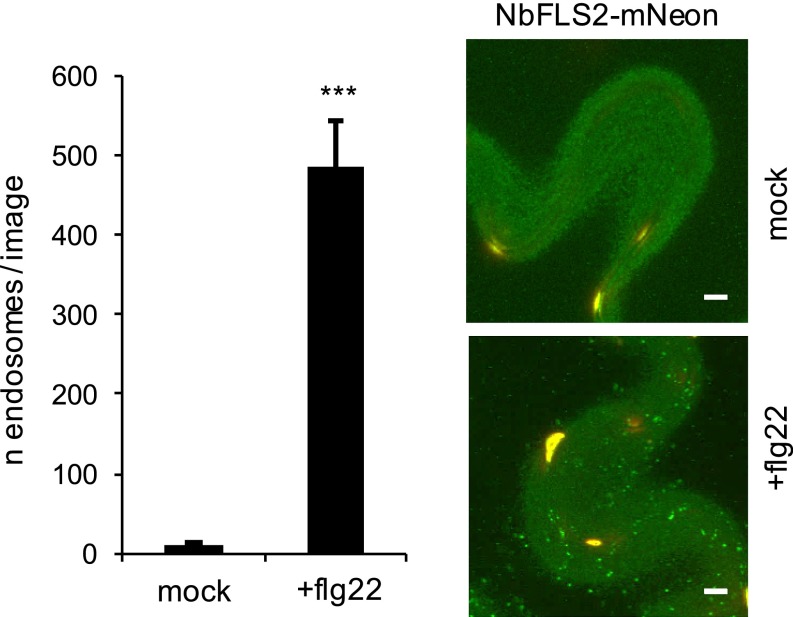
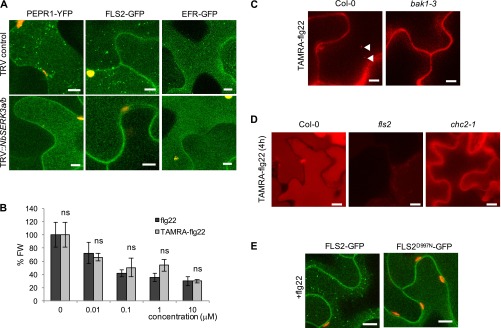
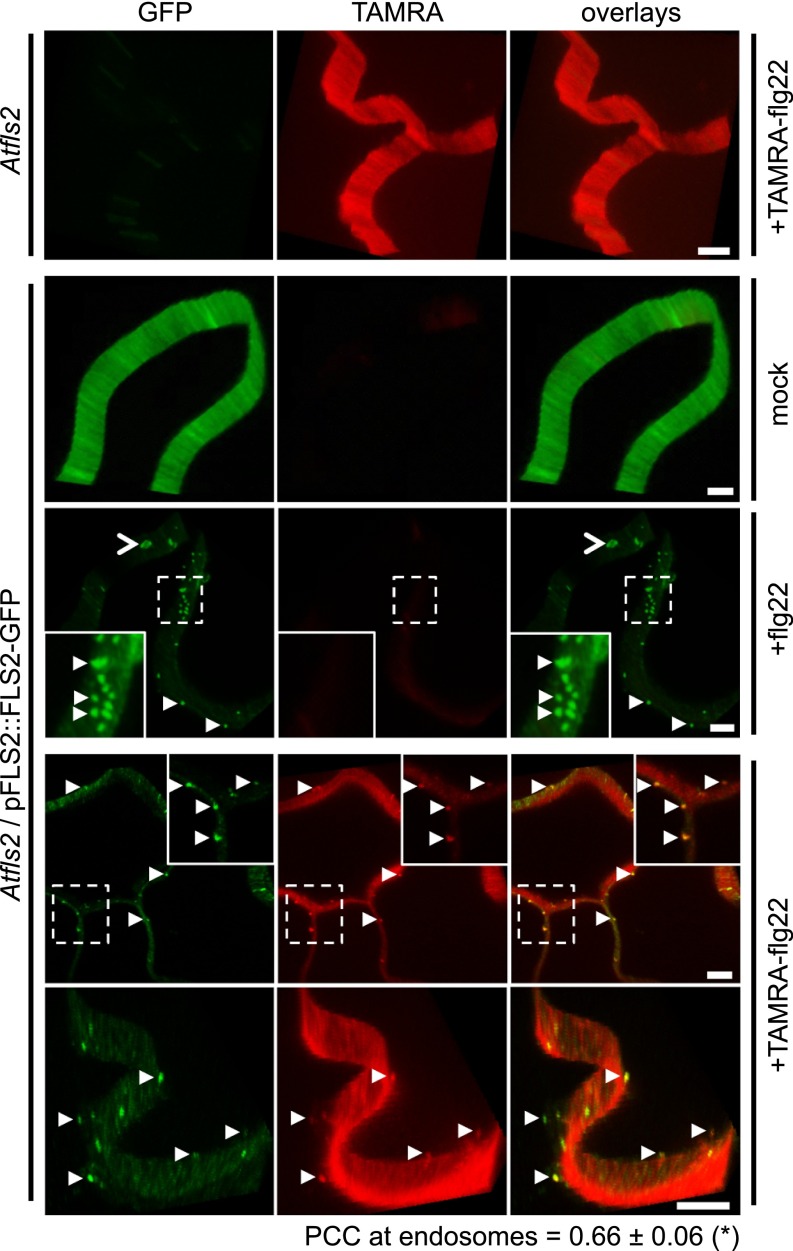
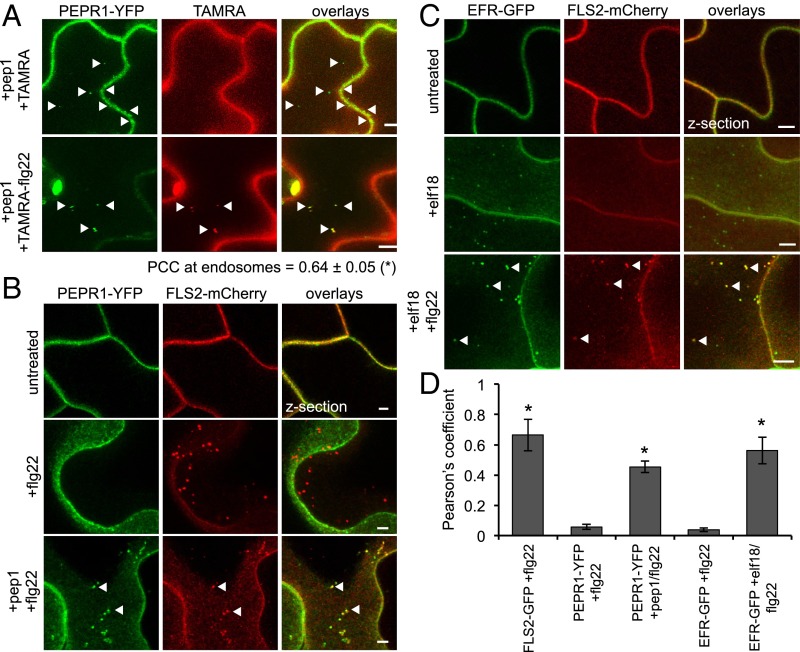
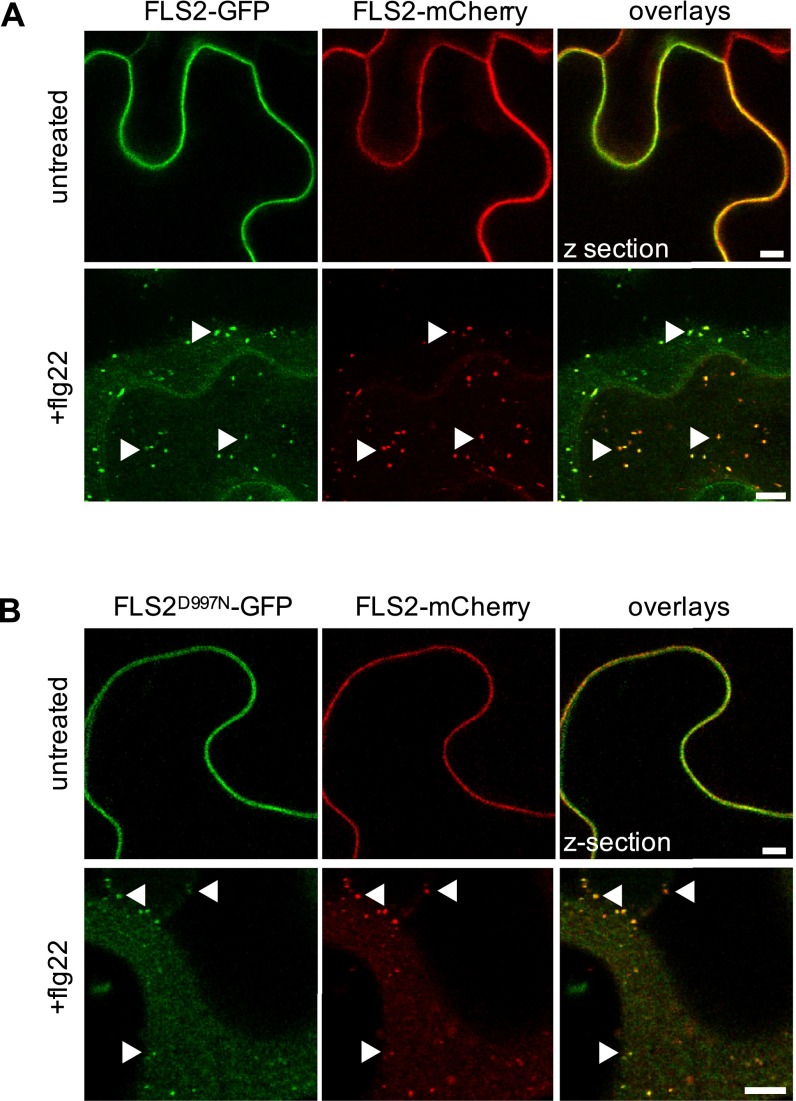
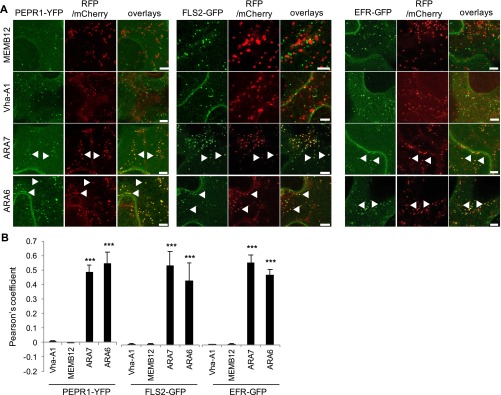
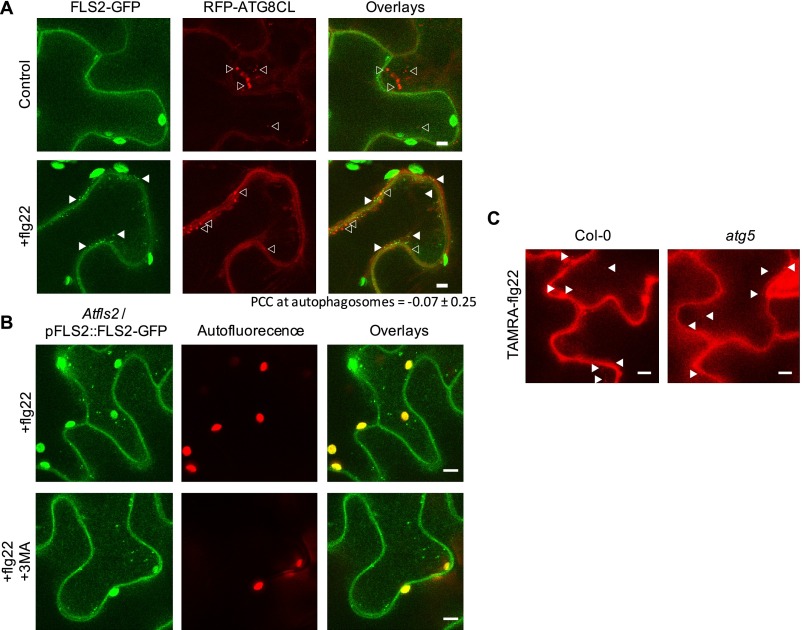
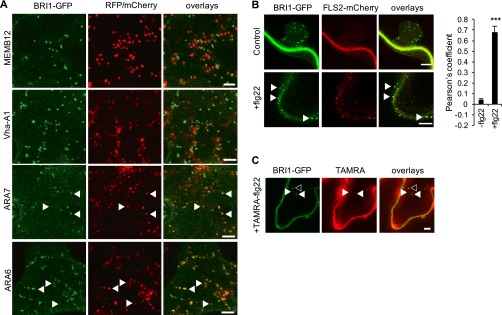
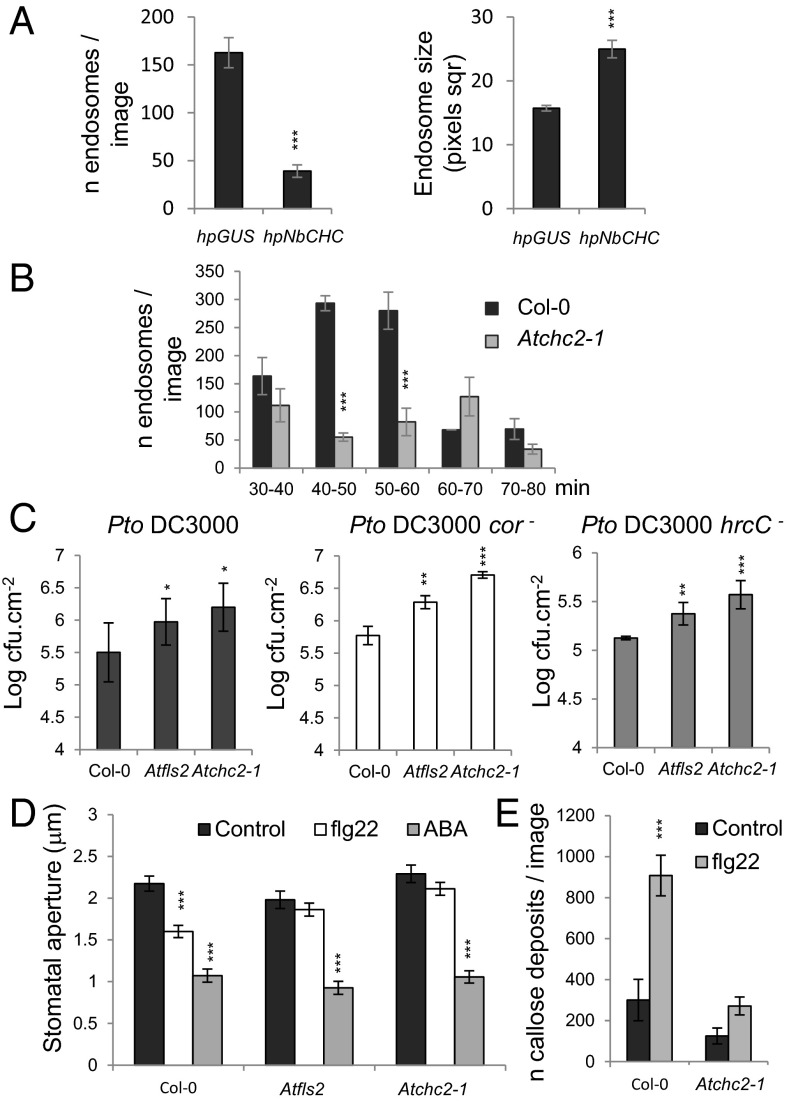
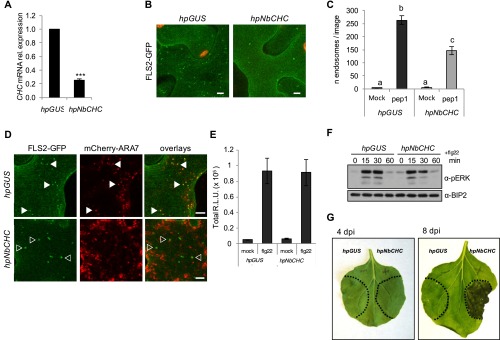
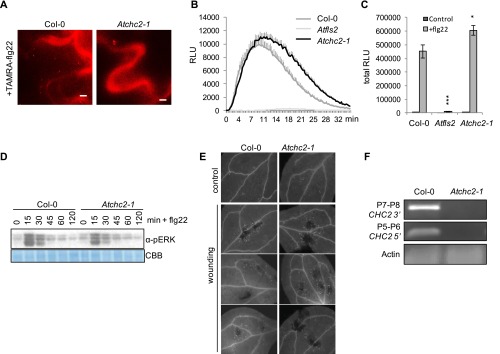
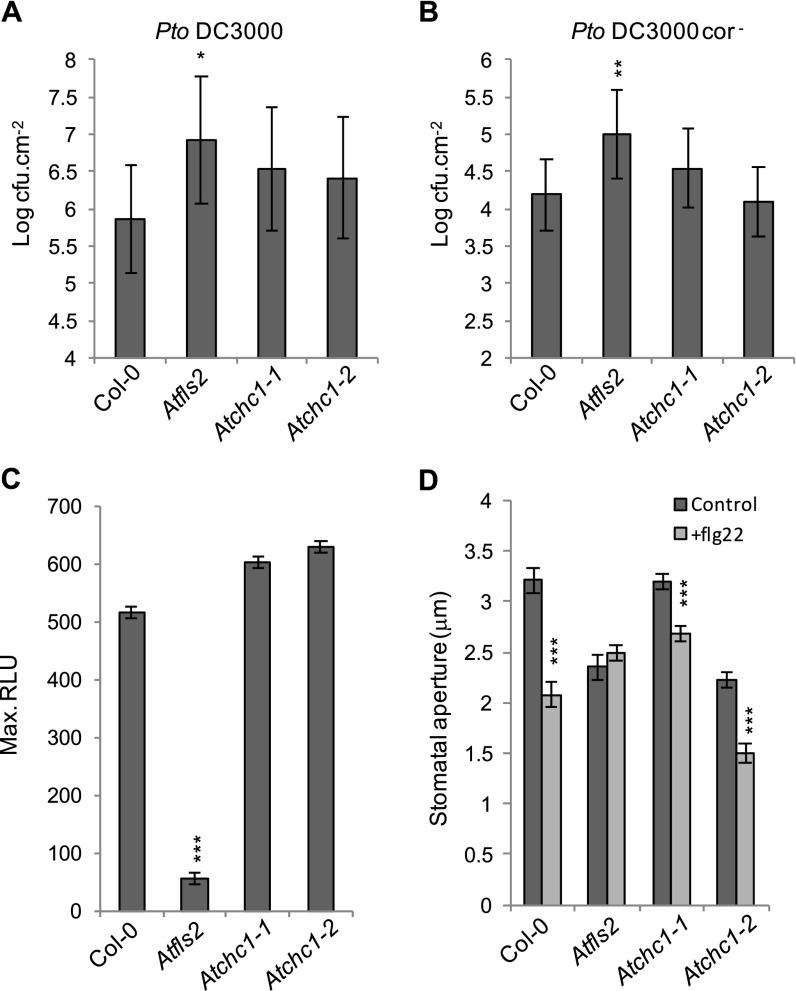
Sensing of potential pathogenic bacteria is of critical importance for immunity. In plants, this involves plasma membrane-resident pattern recognition receptors, one of which is the FLAGELLIN SENSING 2 (FLS2) receptor kinase. Ligand-activated FLS2 receptors are internalized into endosomes. However, the extent to which these spatiotemporal dynamics are generally present among pattern recognition receptors (PRRs) and their regulation remain elusive. Using live-cell imaging, we show that at least three other receptor kinases associated with plant immunity, PEP RECEPTOR 1/2 (PEPR1/2) and EF-TU RECEPTOR (EFR), internalize in a ligand-specific manner. In all cases, endocytosis requires the coreceptor BRI1-ASSOCIATED KINASE 1 (BAK1), and thus depends on receptor activation status. We also show the internalization of liganded FLS2, suggesting the transport of signaling competent receptors. Trafficking of activated PRRs requires clathrin and converges onto the same endosomal vesicles that are also shared with the hormone receptor BRASSINOSTERIOD INSENSITIVE 1 (BRI1). Importantly, clathrin-dependent endocytosis participates in plant defense against bacterial infection involving FLS2-mediated stomatal closure and callose deposition, but is uncoupled from activation of the flagellin-induced oxidative burst and MAP kinase signaling. In conclusion, immunity mediated by pattern recognition receptors depends on clathrin, a critical component for the endocytosis of signaling competent receptors into a common endosomal pathway.

Keywords: EFR; FLS2; PEPR1; clathrin; pattern-triggered immunity.


Conflict of interest statement

The authors declare no conflict of interest.

Figures

Fig. 1.
Fig. 1.
Ligand-induced endocytosis is conserved across PRRs. (A) Cotyledons of A. thaliana seedlings stably expressing PEPR1-YFP and PEPR2-YFP, as indicated, were treated with water or with pep1 for 40 min before imaging. Arrows point to PEPR1-YFP and PEPR2-YFP endosomes. Micrographs are maximum projections of 21 optical sections every 1 µm of z-distance. (Scale bars: 10 µm.) (B) Bar graphs representing the average ± SD number of PEPR1-YFP endosomes detected per 15-min time interval in A. thaliana cotyledons treated with pep1. (C and D) Confocal micrographs of N. benthamiana leaf epidermal cells expressing PEPR1-YFP, FLS2-GFP, and EFR-GFP challenged with pep1, flg22, and elf18 elicitor peptides, or total extracts of Pto DC3000 strains, as indicated. All constructs were expressed in N. benthamiana leaves, and treatments were performed 80 min before imaging. Micrographs are maximum projections of 8–12 confocal optical sections taken using a 1-µm z-distance. Chloroplast autofluorescence was recorded simultaneously in the red channel. (Scale bars: 10 µm.)
Fig. S1.
Fig. S1.
Activated NbFLS2 is internalized into endosomes. (Left) Bar graph showing the mean ± SD number of NbFLS2-tagged endosomes at 60–80 min after water (mock) and 10 μM flg22 treatment. (Right) Live imaging of NbFLS2-mNeon triggered with flg22. Treatments were performed at 80 min before imaging. Micrographs are maximum projections of 8–12 confocal optical sections taken using a 1-μm z-distance. Chloroplast autofluorescence was recorded simultaneously in the red channel. (Scale bars: 5 μm.)
Fig. S2.
Fig. S2.
PEPR1-YFP, FLS2-GFP, and EFR-GFP traffic into endosomes depending on the coreceptor. (A) PEPR1-YFP (Left), FLS2-GFP (Center), and EFR-GFP (Right) expressed in control (Upper) or NbSERK3a/b-silenced (Lower) plants before treatment with pep1, flg22, and elf18, respectively. NbSERK3a/b-silencing generally does not affect endosomes (12). (B) A nonsignificant (ns) difference in seedling growth inhibition after 7 d at different concentrations of flg22 and TAMRA-flg22 is observed in Col-0. Bars represent the average ± SD percent fresh weight compared with untreated (n = 8). The experiment was repeated twice, with the same results. (C) Micrographs representing maximum projections of 10 confocal images for every 0.5 μm of TAMRA-flg22 uptake in Col-0 and bak1-3 Arabidopsis plants at 45 min after a 10-s incubation in 10 μM TAMRA-flg22 solution. (Scale bars: 5 μm.) (D) Micrographs representing a Z section across the middle plane of cells of Col-0, fls2, and chc2-1 Arabidopsis plants using the same microscopy settings at 4 h after incubation with 10 μM TAMRA-flg22. (Scale bars: 5 μm.) (E) FLS2-GFP (Left) or the kinase-inactive point mutated FLS2D997N-GFP (Right) were expressed before treatment with flg22. In A and E, chloroplast autofluorescence was recorded simultaneously in the red channel. All constructs were expressed in N. benthamiana leaves. Micrographs are maximum projections of 8–12 confocal optical sections taken using a 1-µm z-distance. Peptide treatments were performed 80 min before imaging. (Scale bars: 10 µm.)
Fig. 2.
Fig. 2.
Flg22 is internalized together with FLS2. Representation of a z-projected 2-min time series of epidermal cells of the indicated genotypes after incubation with 10 µM TAMRA-flg22 for 80 min (fls2 for 120 min). Insets (dashed lines) are magnified in the bottom panel. White arrowheads point to endosomes, and open arrowheads point to chloroplasts. (Left) Fluorescence signals recorded in the green (FLS2-GFP) channels. (Middle) Fluorescence signals recorded in the red (TAMRA-flg22) channels. (Right) Fluorescence signals recorded in the overlaid channels. (Scale bars: 5 µm.) PCC, Pearson’s correlation coefficient. n = 3. *P (n − 2) < 0.01.
Fig. 3.
Fig. 3.
Ligand-activated PRRs colocalize at endosomes. (A) PEPR1-YFP localization at 45 min after a 10-s cotreatment with pep1 and TAMRA or with pep1 and TAMRA-flg22. Arrowheads point to endosomal signals of either PEPR1-YFP or TAMRA-flg22. (Scale bars: 5 μm.) Micrographs are maximum projections of 10–12 confocal optical sections taken using a 0.5-µm z-distance. n = 6. *P (n − 2) < 0.05. (B) PEPR1-YFP and FLS2-mCherry localization before and after simultaneous flg22 and pep1/flg22 treatments. (C) EFR-GFP and FLS2-mCherry localization before and after simultaneous elf18 and elf18/flg22 treatments. In B and C, all constructs are expressed in N. benthamiana leaves. Micrographs are maximum projections of 8–12 confocal optical sections taken using a 1-µm z-distance unless indicated otherwise. (Left) Green channels. (Middle) Red channels. (Right) Overlaid channels. White arrowheads point to colocalized signals at endosomes. Peptide treatments were performed 80 min before imaging. (Scale bars: 5 µm.) (D) Bar graphs showing the average ± SD Pearson’s correlation coefficient at endosomes between FLS2-mCherry and the coexpressed receptor after elicitor treatments, as indicated. n = 3. *P (n − 2) < 0.01.
Fig. S3.
Fig. S3.
FLS2-GFP and FLS2D997N-GFP colocalize with FLS2-mCherry at endosomes. (A) Confocal micrographs of FLS2-GFP coexpressed with FLS2-mCherry before (Upper) and after (Lower) flg22 treatment. (B) Confocal micrographs of FLS2D997N-GFP coexpressed with FLS2-mCherry before (Upper) and after (Lower) flg22 treatment. All constructs are expressed in N. benthamiana leaves. Flg22 treatment was performed 80 min before imaging. Micrographs are maximum projections of 8–12 confocal optical sections taken using a 1-µm z-distance unless indicated otherwise. (Left) Fluorescence signals recorded in the green channel. (Middle) Fluorescence signals recorded in the red channel. (Right) Fluorescence signals recorded in the overlaid channels. Arrows point to colocalized signals at endosomes. (Scale bars: 5 µm.)
Fig. S4.
Fig. S4.
PEPR1-YFP, FLS2-GFP, and EFR-GFP traffic into ARA7/ARA6 endosomes. (A) PEPR1-YFP, FLS2-GFP, and EFR-GFP were coexpressed with MEMB12, Vha-A1, ARA7, or ARA6 red-fluorescent protein fusions, as indicated, and receptor internalization was triggered using pep1, flg22, or elf18 elicitor peptides, respectively. (Left) Fluorescence signals recorded in the green channel. (Middle) Fluorescence signals recorded in the red channel. (Right) Fluorescence signals recorded in the overlaid channels. White arrows point to colocalized signals. (Scale bars: 5 µm.) All constructs were expressed in N. benthamiana leaves. Micrographs are maximum projections of 8–12 confocal optical sections taken using a 1-µm z-distance. Peptide treatments were performed 80 min before imaging. (B) Histogram showing the average ± SD Pearson’s correlation coefficient at endosomes between PEPR1-YFP, FLS2-GFP, and EFR-GFP signals after pep1, flg22, or elf18 treatment and the four red fluorescent protein-tagged endomembrane markers signals, as indicated. n = 3. ***P < 0.001.
Fig. S5.
Fig. S5.
Flg22-induced FLS2 is not recruited to the autophagy pathway. (A) FLS2-GFP was coexpressed with RFP-ATG8CL in N. benthamiana, and receptor internalization was triggered using flg22. (Left) Fluorescence signals recorded in the green channel. (Middle) Fluorescence signals recorded in the red channel. (Right) Fluorescence signals recorded in the overlaid channels. White arrowheads point to FLS2-GFP–positive endosomes. Open arrowheads point to RFP-ATG8CL–labeled autophagosomes. Micrographs are maximum projections of 8–12 confocal optical sections using a 1-µm z-distance. (Scale bars: 5 µm.) (B) Micrographs of cotyledons of A. thaliana fls2 mutant stably expressing FLS2-GFP, treated with water or 3-MA for 12 h in the dark before a 40-min flg22 treatment. (Left) Fluorescence signals recorded in the green channel. (Middle) Fluorescence signals recorded in the red channel. (Right) Fluorescence signals recorded in the overlaid channels. Micrographs are maximum projections of 8–12 confocal optical sections using a 1-µm z-distance. (Scale bars: 5 µm.) (C) Micrographs representing TAMRA-flg22 uptake in Col-0 and atg5 and are maximum projections of 8–10 confocal images using a 0.5-µm z-distance. Arrowheads point to TAMRA-flg22–positive endosomes. (Scale bars: 5 μm.)
Fig. S6.
Fig. S6.
BRI1-GFP endosomes colocalize with ARA6, activated FLS2-mCherry, and TAMRA-flg22. (A) Confocal micrographs of the middle planes of the cells of BRI1-GFP coexpressed with MEMB12, Vha-A1, ARA7, or ARA6 red-fluorescent protein fusions, as indicated. (B) Confocal micrographs of BRI1-GFP coexpressed with FLS2-mCherry before (Upper) or after (Lower) flg22 treatment. Histograms show the average ± SD Pearson’s correlation coefficient at endosomes between BRI1-GFP and FLS2-mCherry signals before and after flg22 treatment. n = 3. ***P < 0.001. (Left) Fluorescence signals recorded in the green channel. (Middle) Fluorescence signals recorded in the red channel. (Right) Fluorescence signals recorded in the overlaid channels. Arrows point to colocalized signals at endosomes. All constructs are expressed in N. benthamiana leaves. Peptide treatments were performed 80 min before imaging. Confocal micrographs are maximum projections of 8–12 confocal optical sections taken using a 1-µm z-distance. (Scale bars: 5 µm.) (C) Confocal micrographs of BRI1-GFP and TAMRA signals at 45 min after a 10-s incubation in 10 μM TAMRA-flg22 solution. Solid arrowheads correspond to colocalization at endosomes, and open arrowheads indicate BRI1-GFP–specific signals at endosomes. Micrographs correspond to 8–10 confocal images taken every 0.5 μm. (Scale bars: 5 μm.)
Fig. 4.
Fig. 4.
Clathrin regulates FLS2 internalization and flg22-induced immune responses. (A) Bar graphs showing the average ± SE number and size of FLS2-GFP endosomes detected per image in control and clathrin-silenced leaves (untreated, n = 7 images; flg22 treated, n = 25 images pooled from two biological replicates). (B) Bar graph showing the average ± SE number of TAMRA-flg22 endosomes detected per 10-min time interval in A. thaliana Col-0 and chc2-1 cotyledons treated with TAMRA-flg22. (C) Plants of the indicated genotypes were surface-inoculated with Pto DC3000, Pto DC3000 cor-, and Pto DC3000 hrcC-, and bacterial growth was examined at 3 dpi. Bars represent mean ± SE values. n = 8. Experiments were repeated independently at least twice, with similar results. (D) Quantification of aniline blue-stained callose deposits per image of the indicated genotypes and treatments. Bars represent mean ± SD. n = 19 from two independent experiments. (E) Stomatal apertures of the indicated genotypes were measured following the indicated treatments. Bars represent the average ± SE aperture from two independent experiments; average n = 92. *P < 0.05; **P < 0.01; ***P < 0.001, Student’s t test.
Fig. S7.
Fig. S7.
hpNbCHC silencing in N. benthamiana. (A) NbCHC transcript quantification (± SD) relative to control was determined at 4 d after N. benthamiana leaves were infiltrated with Agrobacterium carrying hpNbCHC or the hpGUS control constructs. (B) Live imaging of FLS2-GFP internalization after flg22 treatment in leaves silenced for GUS (hpGUS) or NbCLATHRIN HEAVY CHAIN (hpNbCHC). Micrographs are maximum projections of 8–12 confocal optical sections taken using a 1-µm z-distance. (Scale bars: 10 µm.) (C) Bar graphs showing the mean ± SEM number of PEPR1-YFP endosomes detected per image in control and clathrin-silenced leaves (images analyzed as indicated, pooled from two biological repetitions). Letters indicate statistical differences determined using the t test (P < 0.001). (D) Live imaging of FLS2-GFP coexpressed with mCherry-ARA7 in control and clathrin-silenced leaves after flg22 treatment, as indicated. (Left) Fluorescence signals recorded in the green channel. (Middle) Fluorescence signals recorded in the red channel. (Right) Fluorescence signals recorded in the overlaid channels. White arrowheads point to colocalized signals at endosomes. Open arrowheads point to enlarged FLS2-GFP–positive structures. Micrographs are maximum projections of 8–12 confocal optical sections taken using a 1-µm z-distance. (Scale bars: 5 µm.) (E) Total ROS production as mean ± SEM relative light units (RLU) in control and clathrin-silenced leaves before and after flg22 treatment. (F) Representative immunoblots of MAPK activation after 0, 15, 30, and 60 min of flg22 treatment in control and clathrin-silenced leaves. The anti-BIP2 immunoblot shows protein loading. (G) Representative pictures of N. benthamiana leaves expressing hpNbCHC vs. control. NbCHC silencing induces cell death at 7–8 d after inoculation.
Fig. S8.
Fig. S8.
Atchc2-1 is affected in flg22-induced immune responses. (A) Micrographs representing maximum projections of 10 confocal images for every 0.5 μm of TAMRA-flg22 uptake in Col-0 and chc2-1 (Scale bars: 5 μm). (B and C) Flg22-triggered (100 nM) ROS burst over 40 min in Col-0, fls2, and Atchc2-1. In B, lines represent the mean ± SE value of 16 rosette leaf disks. The experiment was performed twice, with the same results. In C, mean ± SEM values of total ROS production (as RLU) in Col-0, Atfls2, and Atchc2-1 are shown before and after flg22 treatment in 16 rosette leaf disks. The experiment was performed twice, with the same results. (D) Representative immunoblots of MAPK activation after 0, 15, 30, 60, and 120 min of treatment with 1 μM flg22 in Col-0 and Atchc2-1. Coomassie brilliant blue staining is shown for equal loading. (E) No difference in callose deposition between Col-0 and Atchc2-1 at 24 h after wounding. (F) RT-PCR of 5′ and 3′ regions of CHC2 from RNA extracts of the Atchc2-1 mutant and WT Col-0. No full-length transcripts were detected in Atchc2-1 mutant, indicating that it represents a knockout mutant as reported previously (23).
Fig. S9.
Fig. S9.
Atchc2-3 is affected in TAMRA-flg22 uptake and flg22-induced immune responses. (A) Confocal micrographs of TAMRA-flg22 signal at 45 min after a 10-s dip in a 10 μM TAMRA-flg22 solution of Col-0 and Atch2-3 mutant. Micrographs correspond to 8–10 confocal images taken every 0.5 μm. (Scale bars: 5 μm.) (B) Atchc2-3 shows enhanced susceptibility to Pto DC3000 and Pto DC3000 cor- compared with Col-0 at 3 d after spray infection with 0.2 and 0.3 OD bacteria, respectively. Bars represent mean ± SE values (n = 8). *P < 0.05; **P < 0.01 compared with control untreated, Student’s t test. (C) Measurement of callose deposition in Col-0 and Atchc2-3 without and with 5 μM flg22 treatment. Bars represent mean ± SD values. n = 21 from two independent experiments. ***P < 0.001 compared with control untreated, Student’s t test. (D) RT-PCR of 5′ and 3′ regions of CHC2 from RNA extracts of the Atchc2-3 mutant and WT Col-0. No full-length transcripts were detected in the Atchc2-3 mutant.
Fig. S10.
Fig. S10.
AtCHC1 is not involved in flg22-induced immune responses. (A and B) Atchc1-1 and Atchc1-2 do not exhibit altered immunity compared with Col-0 on infection with Pto DC3000 (A) and Pto DC3000 cor- (B) bacteria, respectively. Bars represent mean ± SE (n = 8). *P < 0.05; **P < 0.01 for Atfls2 compared with control untreated, Student’s t test. (C) Flg22 (100 nM)-triggered ROS bursts in Col-0, fls2 Atchc1-1, and Atchc1-2. Bars represent the mean ± SE of 16 rosette leaf disks. The experiment was performed twice, with the same results. (D) Stomatal aperture of Col-0, Atfls2, Atchc1-1, and Atchc1-2 measured after flg22 (10 μM) treatment. Bars represent the average ± SE aperture from two independent experiments.

Comment in

  • 10745

Similar articles

Cited by

References

    1. Böhm H, Albert I, Fan L, Reinhard A, Nürnberger T. Immune receptor complexes at the plant cell surface. Curr Opin Plant Biol. 2014;20:47–54. - PubMed
    1. Boller T, Felix G. A renaissance of elicitors: Perception of microbe-associated molecular patterns and danger signals by pattern-recognition receptors. Annu Rev Plant Biol. 2009;60:379–406. - PubMed
    1. Sun Y, et al. Structural basis for flg22-induced activation of the Arabidopsis FLS2-BAK1 immune complex. Science. 2013;342(6158):624–628. - PubMed
    1. Somssich M, et al. Real-time dynamics of peptide ligand-dependent receptor complex formation in planta. Sci Signal. 2015;8(388):ra76. - PubMed
    1. Beck M, Zhou J, Faulkner C, MacLean D, Robatzek S. Spatio-temporal cellular dynamics of the Arabidopsis flagellin receptor reveal activation status-dependent endosomal sorting. Plant Cell. 2012;24(10):4205–4219. - PMC - PubMed

Publication types

MeSH terms