

The influence of temperament and character profiles on specialty choice and well-being in medical residents
- PMID: 27651982
- PMCID: PMC5018665
- DOI: 10.7717/peerj.2319
The influence of temperament and character profiles on specialty choice and well-being in medical residents
Abstract
Background: Multiple factors influence the decision to enter a career in medicine and choose a specialty. Previous studies have looked at personality differences in medicine but often were unable to describe the heterogeneity that exists within each specialty. Our study used a person-centered approach to characterize the complex relations between the personality profiles of resident physicians and their choice of specialty.
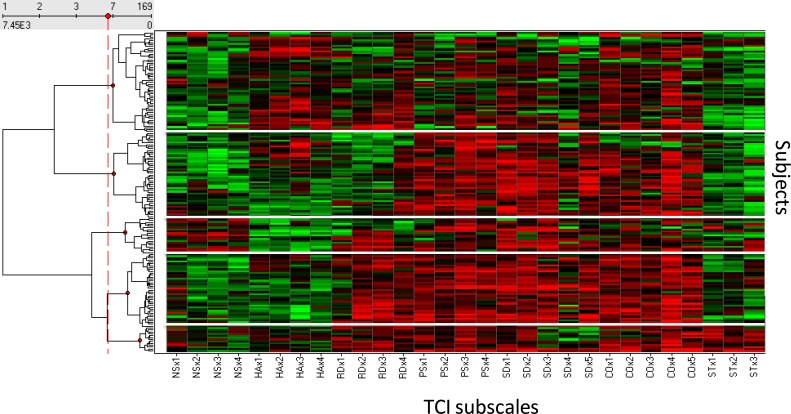
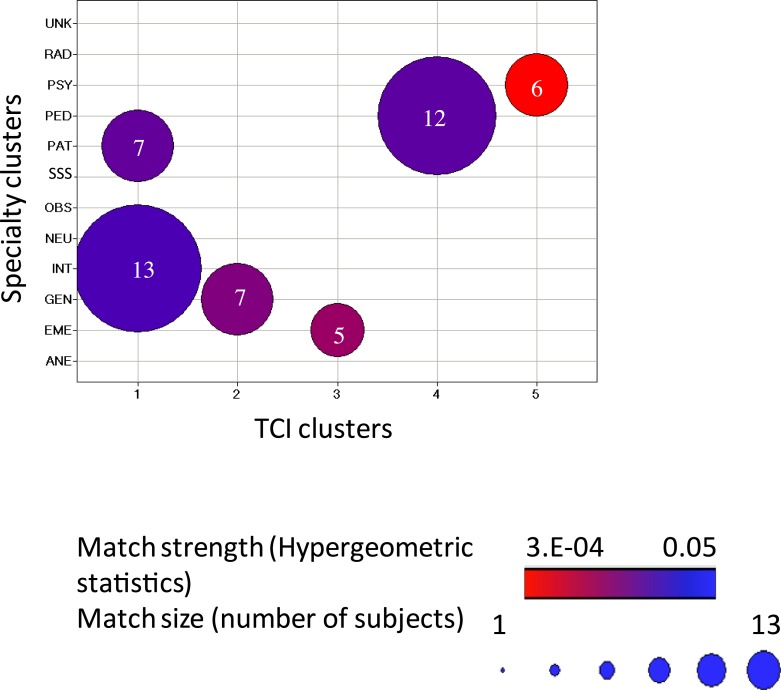
Methods: 169 resident physicians at a large Midwestern US training hospital completed the Temperament and Character Inventory (TCI) and the Satisfaction with Life Scale (SWLS). Clusters of personality profiles were identified without regard to medical specialty, and then the personality clusters were tested for association with their choice of specialty by co-clustering analysis. Life satisfaction was tested for association with personality traits and medical specialty by linear regression and analysis of variance.
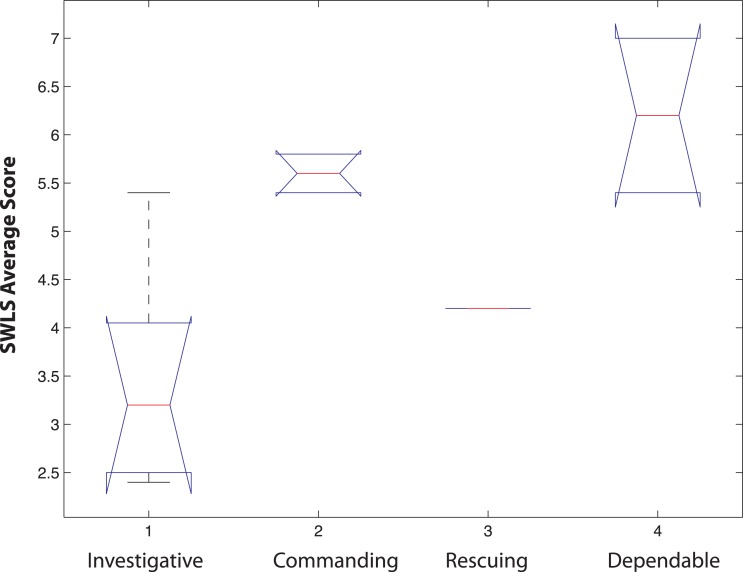
Results: We identified five clusters of people with distinct personality profiles, and found that these were associated with particular medical specialties Physicians with an "investigative" personality profile often chose pathology or internal medicine, those with a "commanding" personality often chose general surgery, "rescuers" often chose emergency medicine, the "dependable" often chose pediatrics, and the "compassionate" often chose psychiatry. Life satisfaction scores were not enhanced by personality-specialty congruence, but were related strongly to self-directedness regardless of specialty.
Conclusions: The personality profiles of physicians were strongly associated with their medical specialty choices. Nevertheless, the relationships were complex: physicians with each personality profile went into a variety of medical specialties, and physicians in each medical specialty had variable personality profiles. The plasticity and resilience of physicians were more important for their life satisfaction than was matching personality to the prototype of a particular specialty.
Keywords: Career choice; Character; Medical specialization; Personality; Temperament; Well-being.
Conflict of interest statement
C. Robert Cloninger is an Academic Editor for PeerJ.
Figures


Similar articles
-
Clonninger's temperament and character inventory profiles of anatomists: is there a relation with specialty choice?Bratisl Lek Listy. 2016;117(2):112-8. doi: 10.4149/bll_2016_022. Bratisl Lek Listy. 2016. PMID: 26830043
-
Personality traits and career choices among physicians in Finland: employment sector, clinical patient contact, specialty and change of specialty.BMC Med Educ. 2018 Mar 27;18(1):52. doi: 10.1186/s12909-018-1155-9. BMC Med Educ. 2018. PMID: 29587722 Free PMC article.
-
Swiss residents' speciality choices--impact of gender, personality traits, career motivation and life goals.BMC Health Serv Res. 2006 Oct 23;6:137. doi: 10.1186/1472-6963-6-137. BMC Health Serv Res. 2006. PMID: 17054803 Free PMC article.
-
[Personality factors in depressive disorders: contribution of the psychobiologic model developed by Cloninger].Encephale. 2002 Jul-Aug;28(4):363-73. Encephale. 2002. PMID: 12232546 Review. French.
-
New evidence for a pain personality? A critical review of the last 120 years of pain and personality.Scand J Pain. 2017 Oct;17:58-67. doi: 10.1016/j.sjpain.2017.07.011. Epub 2017 Jul 28. Scand J Pain. 2017. PMID: 28850375 Review.
Cited by
-
Identifying the Emergency Medicine Personality: A Multisite Exploratory Pilot Study.AEM Educ Train. 2018 Jan 31;2(2):91-99. doi: 10.1002/aet2.10078. eCollection 2018 Apr. AEM Educ Train. 2018. PMID: 30051075 Free PMC article.
-
Contributions of Affective Temperament Traits to Professional Choice: Evidence from the Study of Firefighters, Musicians, Athletes, Bank Managers, Nurses and Paramedics.Psychol Res Behav Manag. 2021 Jun 22;14:827-834. doi: 10.2147/PRBM.S313191. eCollection 2021. Psychol Res Behav Manag. 2021. PMID: 34188564 Free PMC article.
-
"It's Kind of a Rite of Passage": An Exploration Into Residents' Experience of Learning in a Critical Care Setting.J Grad Med Educ. 2024 Dec;16(6):701-712. doi: 10.4300/JGME-D-24-00415.1. Epub 2024 Dec 13. J Grad Med Educ. 2024. PMID: 39677303 Free PMC article.
-
The personality of newly graduated and employed nurses: Temperament and character profiles of Swedish nurses.Int J Nurs Stud Adv. 2021 Dec 18;4:100058. doi: 10.1016/j.ijnsa.2021.100058. eCollection 2022 Dec. Int J Nurs Stud Adv. 2021. PMID: 38745598 Free PMC article.
-
Personality distribution of Canadian medical students: A first look.Can Med Educ J. 2018 May 31;9(2):e11-e19. eCollection 2018 May. Can Med Educ J. 2018. PMID: 30018680 Free PMC article.
References
-
- Bezdek JC. Pattern analysis. In: Pedrycz W, Bonissone PP, Ruspini EH, editors. Handbook of fuzzy computation. Institute of Physics Publishing; Bristol: 1998.
-
- Borges NJ, Savickas ML. Personality and medical specialty choice: a literature review and integration. Journal of Career Assessment. 2002;10(3):362–380. doi: 10.1177/10672702010003006. - DOI
LinkOut - more resources
Full Text Sources
Other Literature Sources
