

The Selective Maintenance of Allelic Variation Under Generalized Dominance
- PMID: 27652891
- PMCID: PMC5100871
- DOI: 10.1534/g3.116.028076
The Selective Maintenance of Allelic Variation Under Generalized Dominance
Abstract
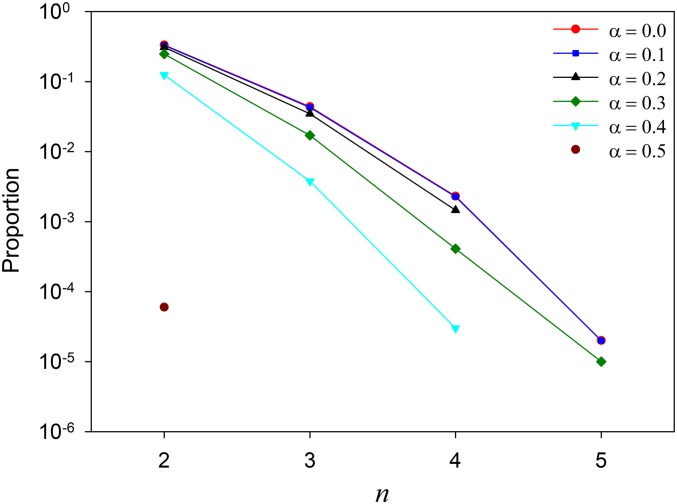
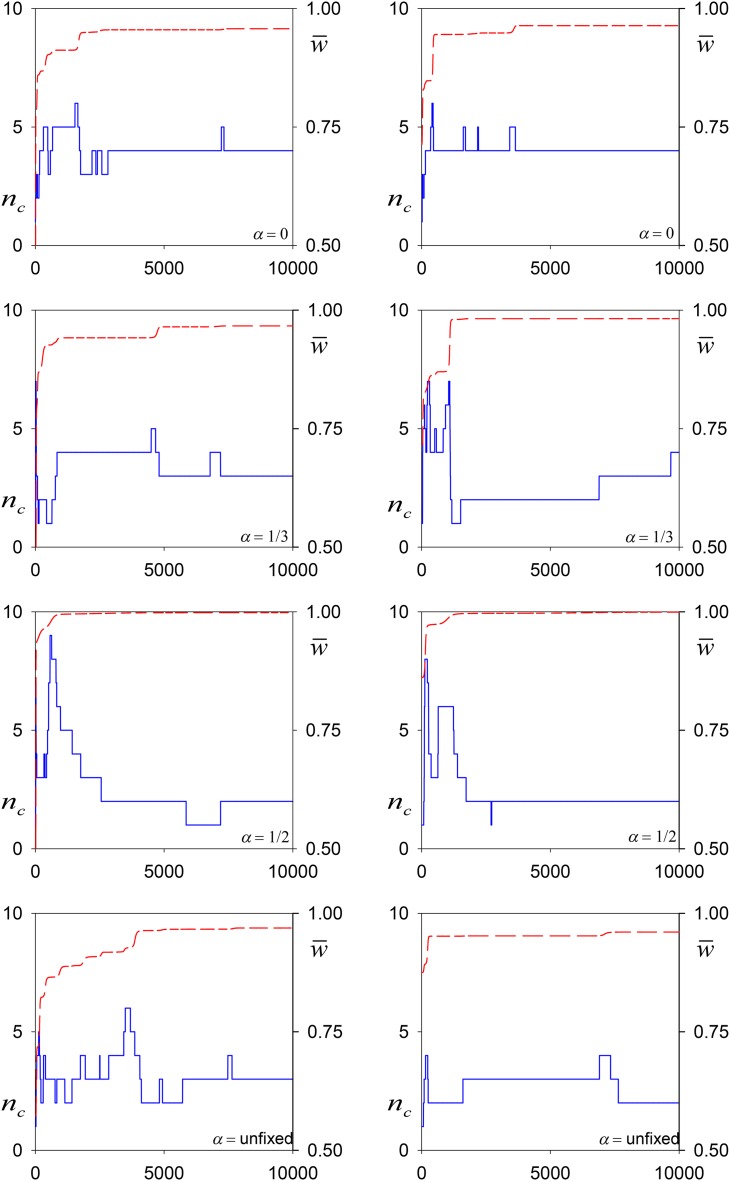
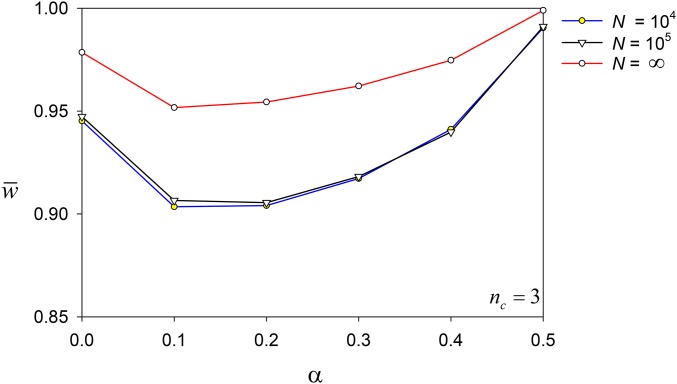
Simple models of viability selection acting on variation at a single diploid locus only maintain multiple alleles for very restricted sets of fitnesses. Most of these models assume that fitnesses are independent, even if the genotypes share alleles. Here, we extend this result to a model with generalized dominance interactions, in which fitnesses are strongly affected by what we call the "primary effects" of the genotype's component alleles, so that genotypes with shared alleles have correlated fitnesses. Nevertheless, in keeping with previously reported results, we also show that such fitness sets are easily constructed over time if recurrent mutation is occurring simultaneously. We find that such models maintain less variation over time than do (previous) models with independently sampled fitnesses, especially when the effects of genetic drift are taken into account. We also show that there is a weak tendency for greater weighting of primary effects to evolve over time.
Keywords: mathematical model; multiple alleles; natural selection; polymorphism; selection theory.
Copyright © 2016 Spencer and Mitchell.
Figures


Similar articles
-
Polymorphism and the Red Queen: the selective maintenance of allelic variation in a deteriorating environment.G3 (Bethesda). 2024 Jul 8;14(7):jkae107. doi: 10.1093/g3journal/jkae107. G3 (Bethesda). 2024. PMID: 38770661 Free PMC article.
-
Models of frequency-dependent selection with mutation from parental alleles.Genetics. 2013 Sep;195(1):231-42. doi: 10.1534/genetics.113.152496. Epub 2013 Jul 12. Genetics. 2013. PMID: 23852384 Free PMC article.
-
Stable two-allele polymorphisms maintained by fluctuating fitnesses and seed banks: protecting the blues in Linanthus parryae.Evolution. 2001 Jul;55(7):1283-98. doi: 10.1111/j.0014-3820.2001.tb00651.x. Evolution. 2001. PMID: 11525453
-
The maintenance of single-locus polymorphism by maternal selection.G3 (Bethesda). 2015 Mar 19;5(5):963-9. doi: 10.1534/g3.115.017392. G3 (Bethesda). 2015. PMID: 25795663 Free PMC article.
-
One selectionist's perspective.Q Rev Biol. 1989 Jun;64(2):127-45. doi: 10.1086/416236. Q Rev Biol. 1989. PMID: 2664855 Review.
Cited by
-
Polymorphism and the Red Queen: the selective maintenance of allelic variation in a deteriorating environment.G3 (Bethesda). 2024 Jul 8;14(7):jkae107. doi: 10.1093/g3journal/jkae107. G3 (Bethesda). 2024. PMID: 38770661 Free PMC article.
-
Population Genetics of the Highly Polymorphic RPP8 Gene Family.Genes (Basel). 2019 Sep 8;10(9):691. doi: 10.3390/genes10090691. Genes (Basel). 2019. PMID: 31500388 Free PMC article.
References
-
- Bürger R., 2000. The Mathematical Theory of Selection, Recombination, and Mutation. Wiley, Chichester, England.
LinkOut - more resources
Full Text Sources
Other Literature Sources
Miscellaneous