

Cardiac Calcium ATPase Dimerization Measured by Cross-Linking and Fluorescence Energy Transfer
- PMID: 27653478
- PMCID: PMC5034344
- DOI: 10.1016/j.bpj.2016.08.005
Cardiac Calcium ATPase Dimerization Measured by Cross-Linking and Fluorescence Energy Transfer
Abstract
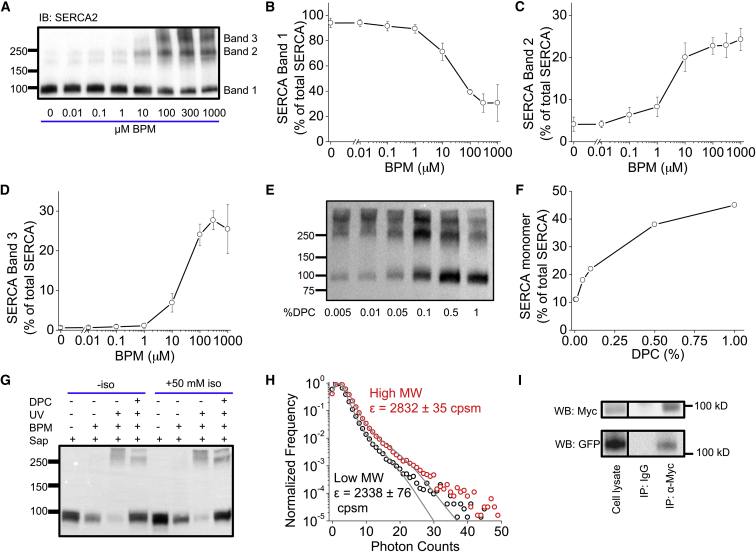
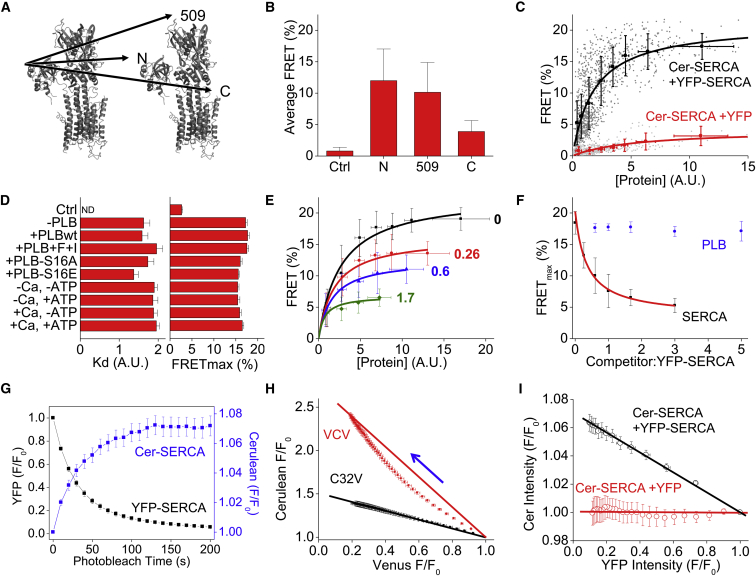
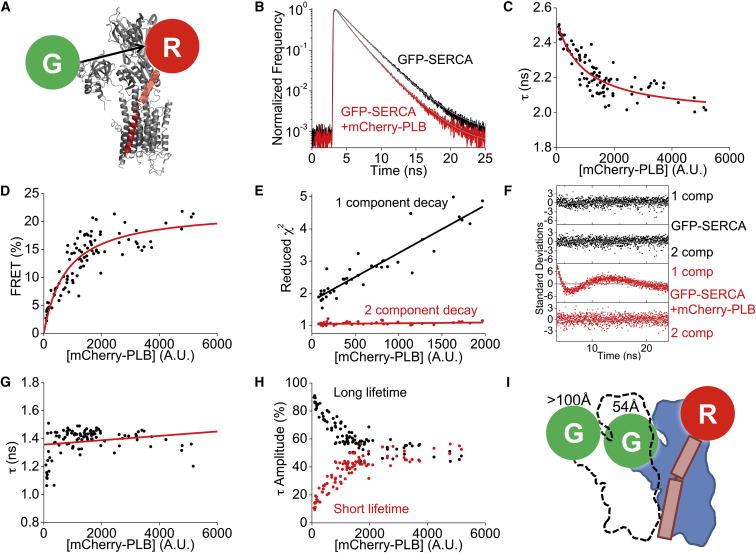
The cardiac sarco/endoplasmic reticulum calcium ATPase (SERCA) establishes the intracellular calcium gradient across the sarcoplasmic reticulum membrane. It has been proposed that SERCA forms homooligomers that increase the catalytic rate of calcium transport. We investigated SERCA dimerization in rabbit left ventricular myocytes using a photoactivatable cross-linker. Western blotting of cross-linked SERCA revealed higher-molecular-weight species consistent with SERCA oligomerization. Fluorescence resonance energy transfer measurements in cells transiently transfected with fluorescently labeled SERCA2a revealed that SERCA readily forms homodimers. These dimers formed in the absence or presence of the SERCA regulatory partner, phospholamban (PLB) and were unaltered by PLB phosphorylation or changes in calcium or ATP. Fluorescence lifetime data are compatible with a model in which PLB interacts with a SERCA homodimer in a stoichiometry of 1:2. Together, these results suggest that SERCA forms constitutive homodimers in live cells and that dimer formation is not modulated by SERCA conformational poise, PLB binding, or PLB phosphorylation.
Copyright © 2016 Biophysical Society. Published by Elsevier Inc. All rights reserved.
Figures
Similar articles
-
Phospholamban oligomerization, quaternary structure, and sarco(endo)plasmic reticulum calcium ATPase binding measured by fluorescence resonance energy transfer in living cells.J Biol Chem. 2008 May 2;283(18):12202-11. doi: 10.1074/jbc.M707590200. Epub 2008 Feb 19. J Biol Chem. 2008. PMID: 18287099 Free PMC article.
-
Acute inotropic and lusitropic effects of cardiomyopathic R9C mutation of phospholamban.J Biol Chem. 2015 Mar 13;290(11):7130-40. doi: 10.1074/jbc.M114.630319. Epub 2015 Jan 15. J Biol Chem. 2015. PMID: 25593317 Free PMC article.
-
Phospholamban C-terminal residues are critical determinants of the structure and function of the calcium ATPase regulatory complex.J Biol Chem. 2014 Sep 12;289(37):25855-66. doi: 10.1074/jbc.M114.562579. Epub 2014 Jul 29. J Biol Chem. 2014. PMID: 25074938 Free PMC article.
-
Phospholamban and sarcolipin: Are they functionally redundant or distinct regulators of the Sarco(Endo)Plasmic Reticulum Calcium ATPase?J Mol Cell Cardiol. 2016 Feb;91:81-91. doi: 10.1016/j.yjmcc.2015.12.030. Epub 2015 Dec 29. J Mol Cell Cardiol. 2016. PMID: 26743715 Free PMC article. Review.
-
The SarcoEndoplasmic Reticulum Calcium ATPase.Subcell Biochem. 2018;87:229-258. doi: 10.1007/978-981-10-7757-9_8. Subcell Biochem. 2018. PMID: 29464562 Review.
Cited by
-
RyR2 Binding of an Antiarrhythmic Cyclic Depsipeptide Mapped Using Confocal Fluorescence Lifetime Detection of FRET.ACS Chem Biol. 2023 Oct 20;18(10):2290-2299. doi: 10.1021/acschembio.3c00376. Epub 2023 Sep 28. ACS Chem Biol. 2023. PMID: 37769131 Free PMC article.
-
Phosphorylation of phospholamban promotes SERCA2a activation by dwarf open reading frame (DWORF).Cell Calcium. 2024 Jul;121:102910. doi: 10.1016/j.ceca.2024.102910. Epub 2024 May 24. Cell Calcium. 2024. PMID: 38823350 Free PMC article.
-
Newly Discovered Micropeptide Regulators of SERCA Form Oligomers but Bind to the Pump as Monomers.J Mol Biol. 2019 Nov 8;431(22):4429-4443. doi: 10.1016/j.jmb.2019.07.037. Epub 2019 Aug 23. J Mol Biol. 2019. PMID: 31449798 Free PMC article.
-
Melatonin: Regulation of Biomolecular Condensates in Neurodegenerative Disorders.Antioxidants (Basel). 2021 Sep 17;10(9):1483. doi: 10.3390/antiox10091483. Antioxidants (Basel). 2021. PMID: 34573116 Free PMC article. Review.
-
The antiapoptotic protein HAX-1 mediates half of phospholamban's inhibitory activity on calcium cycling and contractility in the heart.J Biol Chem. 2018 Jan 5;293(1):359-367. doi: 10.1074/jbc.RA117.000128. Epub 2017 Nov 17. J Biol Chem. 2018. PMID: 29150445 Free PMC article.
References
-
- Plank B., Pifl C., Suko J. Correlation between calmodulin-dependent increase in the rate of calcium transport and calmodulin-dependent phosphorylation of cardiac sarcoplasmic reticulum. Characterization of calmodulin-dependent phosphorylation. Eur. J. Biochem. 1983;136:215–221. - PubMed
-
- Simmerman H.K., Collins J.H., Jones L.R. Sequence analysis of phospholamban. Identification of phosphorylation sites and two major structural domains. J. Biol. Chem. 1986;261:13333–13341. - PubMed
-
- Tada M., Kirchberger M.A., Katz A.M. Phosphorylation of a 22,000-dalton component of the cardiac sarcoplasmic reticulum by adenosine 3′:5′-monophosphate-dependent protein kinase. J. Biol. Chem. 1975;250:2640–2647. - PubMed
-
- Kiss E., Ball N.A., Walsh R.A. Differential changes in cardiac phospholamban and sarcoplasmic reticular Ca2+-ATPase protein levels. Effects on Ca2+ transport and mechanics in compensated pressure-overload hypertrophy and congestive heart failure. Circ. Res. 1995;77:759–764. - PubMed
-
- Zarain-Herzberg A., Afzal N., Dhalla N.S. Decreased expression of cardiac sarcoplasmic reticulum Ca2+-pump ATPase in congestive heart failure due to myocardial infarction. Mol. Cell. Biochem. 1996;163-164:285–290. - PubMed
MeSH terms
Substances
Grants and funding
LinkOut - more resources
Full Text Sources
Other Literature Sources
Research Materials
