. 2016 Sep 20;111(6):1223-1234.
doi: 10.1016/j.bpj.2016.08.007.

Voltage Dependence of Conformational Dynamics and Subconducting States of VDAC-1

Affiliations

Voltage Dependence of Conformational Dynamics and Subconducting States of VDAC-1

Rodolfo Briones et al. Biophys J. .

Abstract

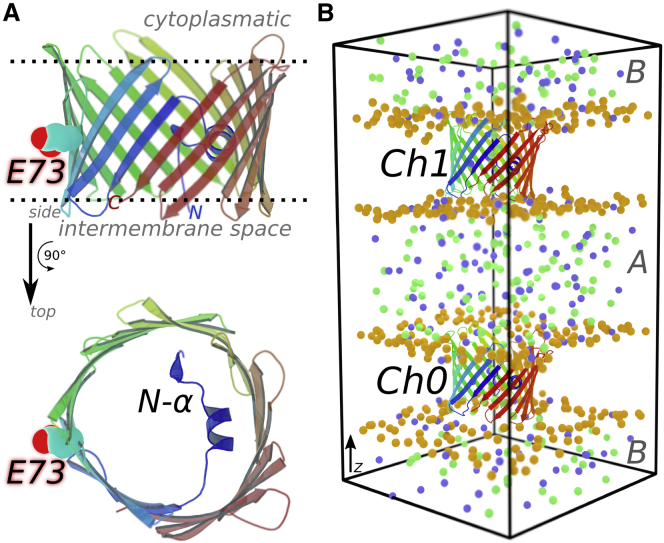
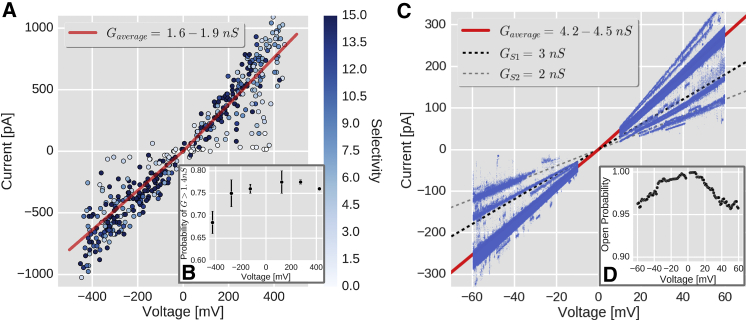
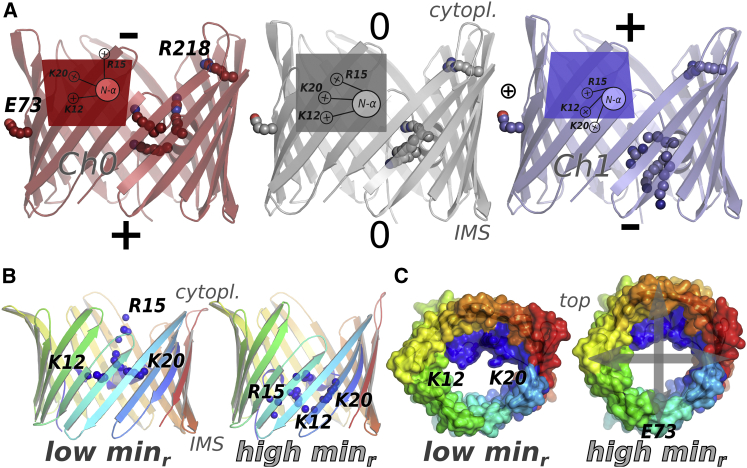
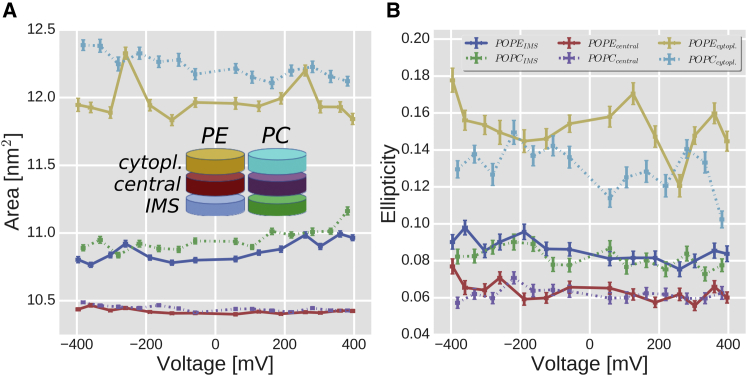
The voltage-dependent anion channel 1 (VDAC-1) is an important protein of the outer mitochondrial membrane that transports energy metabolites and is involved in apoptosis. The available structures of VDAC proteins show a wide β-stranded barrel pore, with its N-terminal α-helix (N-α) bound to its interior. Electrophysiology experiments revealed that voltage, its polarity, and membrane composition modulate VDAC currents. Experiments with VDAC-1 mutants identified amino acids that regulate the gating process. However, the mechanisms for how these factors regulate VDAC-1, and which changes they trigger in the channel, are still unknown. In this study, molecular dynamics simulations and single-channel experiments of VDAC-1 show agreement for the current-voltage relationships of an "open" channel and they also show several subconducting transient states that are more cation selective in the simulations. We observed voltage-dependent asymmetric distortions of the VDAC-1 barrel and the displacement of particular charged amino acids. We constructed conformational models of the protein voltage response and the pore changes that consistently explain the protein conformations observed at opposite voltage polarities, either in phosphatidylethanolamine or phosphatidylcholine membranes. The submicrosecond VDAC-1 voltage response shows intrinsic structural changes that explain the role of key gating amino acids and support some of the current gating hypotheses. These voltage-dependent protein changes include asymmetric barrel distortion, its interaction with the membrane, and significant displacement of N-α amino acids.


Figures

Figure 1
Figure 1
Structure and computational setup of mVDAC-1. The mVDAC-1 structure was taken from PDB: 3EMN (25). The cartoon representations show mVDAC-1 β-strands colored from the N- to the C-terminus in a blue-green-red scale. (A) Side and top perspectives of the mVDAC-1 structure, where glutamate 73 (E73) and the N-terminal α-helix (N) are highlighted, with E73 pointing toward the membrane, opposite to the N. (B) Computational electrophysiology setup (53) for simulating mVDAC-1 SC currents. One mVDAC-1 channel is inserted in each membrane bilayer (labeled Ch0 and Ch1). The bilayers separate solution compartments A and B due to periodic boundary conditions. The phosphorus atoms from phospholipids and chloride and sodium ions are shown as orange, green, and blue spheres, respectively. Water molecules and lipid acyl chains are not shown. The currents are triggered by setting up a constant ion difference between the compartments. To see this figure in color, go online.
Figure 2
Figure 2
SC current-voltage (I/V) relationships of wt VDAC-1. (A) Computational I/V relationship of mVDAC-1 simulated in 0.5 M NaCl, and at ion imbalances (Δq) from 2 to 14 (only POPE is shown; for POPC results, see Fig. S1 C). Each I/V data point (circles) is colored according to selectivity, defined as the permeation ratio between chloride and sodium. The mean conductance values (± SE) of 1.63 (± 0.08) and 1.96 (± 0.11) nS are shown as red lines for the negative and positive voltages, respectively. (B) Voltage-dependent pseudo-open probability of a single mVDAC-1 channel. Each data point represents the average probability (± SD) of finding the channel at a conductance value >1.4 and 1.5 nS. The I/V data were binned every 150 mV from −500 to 500 mV and excluded the voltage range from −50 to 50 mV. (C) I/V relationship of hVDAC-1 inserted in a solvent-free DPhPC/cholesterol (9:1) membrane bathed in 1 M KCl, 1 mM CaCl2, and 5 mM HEPES, pH 7.4. The voltage-ramp data (blue dots) were taken after the insertion of a single hVDAC-1 channel was proven by a mean conductance value of 4–4.5 nS. The dashed lines mark the 3 and 2 nS conductance values of the most frequent “closed” subconducting states visited by hVDAC-1 (GS1 and GS2). The red line shows the mean conductance value averaged over 185 voltage ramps, which was 4.2 and 4.5 nS (mean ± SE = 0.006) in the negative and positive voltage sides, respectively. (D) Voltage-dependent open probability of an SC hVDAC-1 for the voltage ramps shown in (C). To see this figure in color, go online.
Figure 3
Figure 3
mVDAC-1 global conformational models of the voltage (V) and the channel minimum-pore radius (minr). All models were generated using the protein atoms excluding the hydrogens. Model validation details are shown in Fig. S5. (A) Cartoon and schematic representations of mVDAC-1 conformational model changes in response to V. The predicted structures under negative voltage (Ch0) are in red, those under neutral voltage in gray, and those under positive voltage in blue (Ch1). Labels indicate the cytoplasmic (cytopl.) and the IMS sides. In the positive polarity, sodium ions (circled plus signs) were observed closer to E73. The cartoon shows the β-barrel mVDAC-1 structure. K12, R15, and K20 (together termed KRK), E73, and R218 are shown as spheres using the same color code. The schematic insets show the deformations of the barrel, the position of the N-terminal α-helix, and the relative conformation of the KRK, E73, and R218 side chains. (B and C) Extreme structures of the conformational model that correlate with the minr changes of the channel under negative voltage (Ch0) in the mVDAC-1 MD simulations. The structures are shown as cartoons (β-sheets in a blue-green-red scale) (B) and surface representations (C) of the conformations that show the lowest and highest minr values (from 4 to 11 Å) in the model. Residues K12, R15, and K20 are shown as blue spheres. These positively charged amino acids show larger contributions to the narrowing of the pore in this conformational model. The conformational changes depicted describe motions that distorted the barrel either parallel or perpendicular to the position of N. The distortion axes of the barrel are illustrated as gray arrows in (C). To see this figure in color, go online.
Figure 4
Figure 4
mVDAC-1 β-barrel deformations. (A) Changes of the barrel area (mean ± SE) as a function of the voltage and lipid composition. Each colored curve represents the area change for one of three barrel slices, depicted by the cartoon cylinder inset. (B) Changes of ellipticity ((ab)/a, where a>b are the ellipse axes) ± SE as a function of the voltage for the same barrel slices as in (A). In both (A) and (B), the dashed lines indicate the plots for PC lipids. To see this figure in color, go online.

References

    1. Hille B. 3rd ed. Sinauer; Sunderland, MA: 2001. Ion Channels of Excitable Membranes.
    1. Shrivastava I.H., Tieleman D.P., Sansom M.S. K+ versus Na+ ions in a K channel selectivity filter: a simulation study. Biophys. J. 2002;83:633–645. - PMC - PubMed
    1. Köpfer D.A., Song C., de Groot B.L. Ion permeation in K+ channels occurs by direct Coulomb knock-on. Science. 2014;346:352–355. - PubMed
    1. Machtens J.-P., Kortzak D., Fahlke C. Mechanisms of anion conduction by coupled glutamate transporters. Cell. 2015;160:542–553. - PubMed
    1. Rui H., Lee K.I., Im W. Molecular dynamics studies of ion permeation in VDAC. Biophys. J. 2011;100:602–610. - PMC - PubMed

LinkOut - more resources