. 2016 Sep 21;14(9):e1002561.
doi: 10.1371/journal.pbio.1002561. eCollection 2016 Sep.

The Biophysical Basis Underlying Gating Changes in the p.V1316A Mutant Nav1.7 Channel and the Molecular Pathogenesis of Inherited Erythromelalgia

Affiliations

The Biophysical Basis Underlying Gating Changes in the p.V1316A Mutant Nav1.7 Channel and the Molecular Pathogenesis of Inherited Erythromelalgia

Chiung-Wei Huang et al. PLoS Biol. .

Abstract

The Nav1.7 channel critically contributes to the excitability of sensory neurons, and gain-of-function mutations of this channel have been shown to cause inherited erythromelalgia (IEM) with neuropathic pain. In this study, we report a case of a severe phenotype of IEM caused by p.V1316A mutation in the Nav1.7 channel. Mechanistically, we first demonstrate that the Navβ4 peptide acts as a gating modifier rather than an open channel blocker competing with the inactivating peptide to give rise to resurgent currents in the Nav1.7 channel. Moreover, there are two distinct open and two corresponding fast inactivated states in the genesis of resurgent Na+ currents. One is responsible for the resurgent route and practically existent only in the presence of Navβ4 peptide, whereas the other is responsible for the "silent" route of recovery from inactivation. In this regard, the p.V1316A mutation makes hyperpolarization shift in the activation curve, and depolarization shift in the inactivation curve, vividly uncoupling inactivation from activation. In terms of molecular gating operation, the most important changes caused by the p.V1316A mutation are both acceleration of the transition from the inactivated states to the activated states and deceleration of the reverse transition, resulting in much larger sustained as well as resurgent Na+ currents. In summary, the genesis of the resurgent currents in the Nav1.7 channel is ascribable to the transient existence of a distinct and novel open state promoted by the Navβ4 peptide. In addition, S4-5 linker in domain III where V1316 is located seems to play a critical role in activation-inactivation coupling, chiefly via direct modulation of the transitional kinetics between the open and the inactivated states. The sustained and resurgent Na+ currents may therefore be correlatively enhanced by specific mutations involving this linker and relevant regions, and thus marked hyperexcitability in corresponding neural tissues as well as IEM symptomatology.


Conflict of interest statement

The authors have declared that no competing interests exist.

Figures

Fig 1
Fig 1. Clinical features of the index patient with erythromelalgia (IEM).
(A) Large areas of swelling erythema with blisters and wounds in the patient’s right foot. (B) Perfusion unit (P.U.) of the IEM patient (six measurements) and normal controls (six subjects, four measurements for each) at baseline, thermal stimulation (up to 44°C in 1 min) and 10 min cooling after thermal stimulation (“post-stimulation”) (***, p < 0.001). (C) Skin temperature of the right foot at baseline, thermal stimulation, and post-stimulation (***, p < 0.001; N.S., no statistically significant difference). Individual data is shown in the file of S1 Data.
Fig 2
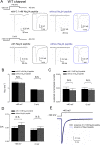
Fig 2. Resurgent and transient Na+ currents of WT Nav1.7 channel in the presence and absence of the Navβ4 peptide.
(A) The cells were held at –120 mV, and the resurgent Na+ currents were evoked by a voltage steps to –40 mV after a prepulse to either +40 mV or 0 mV for 30 ms in the presence or absence of 0.1 mM Navβ4 peptide. Inset figures: the transient currents during the prepulses are magnified in the time axis. (B) The decay phase of the transient currents from the 95% of the peak to the steady-state current was fitted by a standard exponential function: f(x) = A×exp(–t/τ)+ C. Note that the time constants of the decay phase of transient Na+ currents at +40 mV prepulse are shorter than that at 0 mV, but both remain the same in the presence and absence of 0.1 mM Navβ4 peptide (n = 15; N.S., no statistically significant difference). (C) Cumulative results were obtained from experiments with similar protocols described in part A but with longer prepulses to either +40 or 0 mV for ~100 ms in the WT channel. The sustained currents are defined as the average currents from 75 to 80 ms after peak transient current (and normalized to the peak transient current in the same sweep). At either +40 or 0 mV depolarization, there is no significant difference in the normalized sustained currents in the presence and absence of 0.1 mM Navβ4 peptide (n = 15; N.S., no statistically significant difference). (D) Cumulative results of C/A values from part B (C is divided by A from the same fit) are also compared to further substantiate the unaltered sustained currents by the Navb4 peptide either at +40 or 0 mV (n = 15 for each condition; N.S., no statistically significant difference). (E) The transient Na+ currents are adjusted to the same peak current amplitude and then average currents are obtained in the presence and absence of 0.1 mM Navβ4 peptide (n = 15 for each condition). Note that the two average currents are essentially superimposable. Individual data is shown in the file of S1 Data.
Fig 3
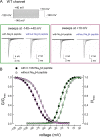
Fig 3. The activation and inactivation curves of the WT Nav1.7 channel in the presence and absence of the Navβ4 peptide.
(A) Sample sweeps for the making of the activation (green box, on the left) and inactivation (purple box, on the right) curves in the presence and absence of the Navβ4 peptide are shown (see Materials and Methods for the experimental protocols). (B) The activation and inactivation curves for the each cell are fitted with Boltzmann functions, and the cumulative results for Vh are –20.74±1.47 mV and –11.19±1.21 mV with and without the Navβ4 peptide, respectively (n = 15; p < 0.05), and k are 7.11±0.33 and 6.90±0.41 with and without the Navβ4 peptide fort the inactivation curve, respectively (n = 15; no significant difference). For the inactivation curves, the Vh are –83.64±2.17 mV and –71.80±1.61 mV with and without the Navβ4 peptide, respectively (n = 15; p < 0.05), and k are –11.55±0.43 and –10.89±0.37 with and without the Navβ4 peptide, respectively (n = 15; no significant difference). Single Boltzmann functions fits to the mean values are for the activation curve, the Vh and k are ~–20.7 mV and ~8.0 with 0.1 mM Navβ4 peptide, and ~–11.43 mV and ~7.6 without the Navβ4 peptide, respectively; for the inactivation curves, the Vh and k are ~–83.8 mV and ~12.8 with 0.1 mM Navβ4 peptide and ~–71.7 mV and ~11.6 without the Navβ4 peptide, respectively. Individual data is shown in the file of S1 Data.
Fig 4
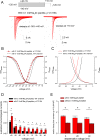
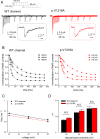
Fig 4. The activation and inactivation curves of the p.V1316A mutant channel in the presence of the Navβ4 peptide.
(A) Sample sweeps for the making of the activation (left panel, currents during the –140 to +40 mV prepulse) and inactivation (right panel, currents during the +10 mV pulse following the prepulse) curves of the p.V1316A mutant channel in the presence of the Navβ4 peptide are shown (see Materials and Methods for the experimental protocols). (B) The activation and inactivation curves for each cell are also fitted with Boltzmann functions, and the cumulative results for Vh and k are –30.48±2.45 mV (n = 12; p < 0.05, versus WT channel) and 8.05±0.51 (n = 12; no significant difference versus WT channel) for the activation curves, respectively. For the inactivation curves, Vh and k are –77.04±2.17 mV (n = 12; p < 0.05, versus WT channel) and –10.9±0.39 (n = 12; no significant difference versus WT channel) in the p.V1316A mutant channel, respectively. Single Boltzmann fits to the mean values are for the p.V1316A mutant channel: Vh and k are ~–30.7 mV and ~8.7; for the activation curve; Vh and k are ~–77.1 mV and ~12.0 for the inactivation curve. The solid black lines for the WT channel are taken from Fig 2B for comparison. (C) A closer view of the fitting lines in part B between –100 and 0 mV. (D) Cumulative results were obtained with the same protocols described in part A for the WT and p.V1316A mutant channels (n = 15 for the WT channels; n = 12 for the p.V1316A mutant channels). The ratio between the sustained and peak transient currents (in the same sweep) is significantly larger in the p.V1316A mutant channel with depolarization potentials between –40 and +40 mV. *, p < 0.05. (E) At each depolarization voltage (0, +20, and +40 mV), the time constants (tau) of the decay (inactivation) phase of transient Na+ currents in the p.V1316A mutant channel are normalized to the average time constants of the inactivation phase of transient Na+ currents in the WT channel to give the relative inactivation tau, either in the presence or absence of 0.1 mM Navβ4 peptide. The cumulative results (n = 10–12 for each measurement) show that the relative inactivation time constant at each depolarization voltage is significantly lengthened by the p.V1316A mutation only in the presence but not in the absence of the Navβ4 peptide. *, p < 0.05. Individual data is shown in the file of S1 Data.
Fig 5
Fig 5. Larger resurgent Na+ currents in the p.V1316A mutant than that in the WT channels.
(A) The cells were held at –120 mV, and the resurgent Na+ currents of WT channel were evoked by pulses between 0 and –120 mV in 10 mV increments following a depolarization prepulse of either +40 mV or 0 mV for 10 ms in the presence of the Navβ4 peptide. (B) Sample sweeps for the p.V1316A mutant channel in the presence of 0.1 mM Navβ4 peptide following the same protocol as part A. (C) Cumulative results were obtained from experiments described in part A for the WT and p.V1316A mutant channels (each n = 10). The ratio between resurgent and peak transient Na+ current (in the same sweep) is significantly larger in the p.V1316A mutant than WT channels at repolarization potentials between –10 and –70 mV. *, p < 0.05. Individual data is shown in the file of S1 Data.
Fig 6
Fig 6. The activation curve of resurgent Na+ currents in the WT and p.V1316A mutant channels.
(A) Sample sweeps were obtained in the presence of 0.1 mM Navβ4 peptide for the WT channel. The cell was first held at –120 mV for ~30 ms, and then stepped to different depolarization prepulses between –60 and +180 mV for 30 ms in 10 mV increment. Resurgent Na+ currents were then evoked by a pulse to –60 mV for 150 ms. (B) The relative magnitude of resurgent Na+ currents for the WT channel is defined by normalization of the peak amplitude of resurgent Na+ currents at –60 mV following different prepulses to that following a prepulse of +140 mV in the same cell, and then plotted against the prepulse potential. The same experiments were also repeated with prepulses only 3 ms in length. The resurgent activation curve for each cell are also obtained by fittings with Boltzmann functions, and the cumulative results for Vh are 38.63±4.39 mV and 49.19±2.58 mV for 3 ms and 30 ms prepulses, respectively (n = 10 for the 3 ms; n = 9 for the 30 ms), and k are 39.40±3.37 and 29.01±1.46 for 3 ms and 30 ms prepulses, respectively. Single Boltzmann fits to the mean values are for 3 ms: Vh = ~44.93 mV, k = ~43.63, and for 30 ms: Vh = ~48.63 mV, k = ~28.59. (C) The activation curve of resurgent Na+ currents in the p.V1316A mutant channel is obtained with the same protocols as that in part B (prepulse = 30 ms, n = 10). The activation curves of transient Na+ currents for the WT and p.V1316A mutant channels and the activation curves of resurgent Na+ currents in the WT channels (the fitting lines in Figs 3B and 4B, and part B, respectively) are replotted for comparison. The resurgent activation curve of p.V1316A mutant channels for each cells are also obtained by fitting Boltzmann functions, and the cumulative results for Vh and k are 59.76±2.17 mV (n = 10; p < 0.05 versus the activation curve of transient currents in the p.V1316A mutant channels) and 21.70±1.14 (n = 10; p < 0.05 versus the activation curve of transient currents in the p.V1316A mutant channels), respectively. Single Boltzmann fits to the mean values are for p.V1316A mutant channel: Vh = ~59.5 mV and k = ~21.39. Note that the activation curves of resurgent Na+ currents in both WT and p.V1316A mutant channels are markedly shifted to the more positive voltage range and with a much less steep slope than those for the transient currents. Individual data is shown in the file of S1 Data.
Fig 7
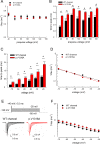
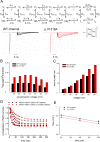
Fig 7. Monotonously accelerated decay of resurgent Na+ currents by membrane hyperpolarization in the WT and p.V1316A mutant channels.
(A) Cumulative results were obtained with the same protocols described in Fig 6A (each n = 10). The inverses of decay time constants of the resurgent Na+ currents are obtained at –60 mV after prepulses of +40~+160 mV for ~10 ms in 20 mV increment for WT and p.V1316A mutant channels. Note that the inverse decay time constants are very similar in WT and p.V1316A mutant channels. (B) Cumulative results were obtained from the experiments described in part A (each n = 10). Note that the time to peak of the resurgent Na+ currents in the p.V1316A mutant channel is always slower than that in the WT channel at all of the prepulse voltages tested. *; p < 0.05. (C) The time to the resurgent Na+ current peak (the time from ending of depolarization prepulse of +40 mV to the resurgent current peak at different voltages) was measured with the same protocol in Fig 5 and plotted against the voltage of the resurgent pulse in the WT and p.V1316A mutant channels (each n = 10). Note trend of voltage dependence. Note that the time to the resurgent Na+ currents peak is evidently larger in the p.V1316A mutant than that of the WT channels with the repolarization potentials between –20 and –70 mV. *; p < 0.05. (D) The inverses of the time constants for the decay phase of resurgent Na+ currents (the same data as that in Fig 5, n = 10) was plotted against the voltage in semi-logarithmic scales for the WT and p.V1316A mutant channels. The lines are linear regression fits of the form: 1/tau(V) = 0.06×exp(–0.81V/25) ms-1 for WT channel and 1/tau(V) = 0.04×exp(–0.97V/25) ms-1 for p.V1316A mutant channel, respectively, where V is the membrane potential in mV. The inverses of time constants of decay kinetics in the resurgent currents are very similar in the WT and p.V1316A mutant channels. (E) The cells were held at –120 mV and stepped to +40 mV for 0.5 ms of depolarization (the activation pulse), and following by repolarization from –80 mV to –20 mV for ~20 ms (the deactivation pulse) in the WT and p.V1316A mutant channels. The tail currents show faster decay kinetics as the deactivating pulse goes more negative. (F) The decay phase of tail currents in part E is fitted by mono-exponential functions for different deactivating potentials in the WT and p.V1316A mutant channels. The inverses of time constants of decaying phase in tail currents are plotted against voltage in semi-logarithmic scales for WT and p.V1316A mutant channels (n = 10). The lines are linear regression fitted of the form: 1/tau(V) = 0.97×exp(–0.72V/25) ms-1 for WT channel, and 1/tau(V) = 1.25×exp(–0.71V/25) ms-1 for p.V1316A mutant channel, respectively, where V is the membrane potential in mV. Note that the inverses of time constants of decay kinetic phases in the tail currents are very similar in the WT and p.V1316A mutant channels. Individual data is shown in the file of S1 Data.
Fig 8
Fig 8. Smaller resurgent Na+ currents with lengthening of the depolarization prepulse.
(A) The cell was first held at –120 mV, and then stepped to a gradually lengthened depolarization prepulse at +60 mV before stepped to –60 mV for 280 ms to document the resurgent currents. Note that the resurgent Na+ currents get smaller with lengthening of the prepulse in the WT and p.V1316A mutant channels. Sample resurgent Na+ currents magnified in time scale are shown in inset figures. (B) The normalized amplitude of resurgent Na+ currents (normalized to the first current in each series) is plotted against the length of the prepulse (to +20, +40, and +60 mV, the protocols were the same as that in part A). The lines are fits to the data points of the form: normalized resurgent currents = (1–fo)× exp(–(x–3)/τ)+ fo, where x is the prepulse length in ms. τ and fo are 16.34 ms and 0.15 for +20 mV, 37.6 ms and 0.26 for +40 mV, and 64.88 ms and 0.34 for +60 mV prepulse, respectively, in the WT channel (each n = 7). On the other hand, τ and fo are 28.73 ms and 0.18 for +20 mV, 44.41 ms and 0.27 for +40 mV, and 98.84 ms and 0.31 for +60 mV prepulse, respectively, in the p.V1316A mutant channel (each n = 7). (C) The inverses of time constants in part B are plotted against the prepulse voltage in semi-logarithmic scale. The data are fitted with the following equation 1/tau(V) = 0.13×exp(–0.9V/25) ms–1 for the WT channel, and 1/tau(V) = 0.07×exp(–0.8V/25) ms–1 for the p.V1316A mutant channel, respectively, where V is the prepulse potential in mV. (D) The fo (the residual resurgent Na+ currents) in part B are plotted against different depolarization potentials (e.g., +20, +40, and +60 mV) in the WT and p.V1316A mutant channels. Note that there is no significant difference between the WT and p.V1316A mutant channels at each voltage (n = 7; N.S., no statistically significant difference). Individual data is shown in the file of S1 Data.
Fig 9
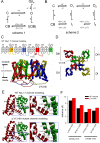
Fig 9. Gating schemes of the Nav1.7 channel and the genesis of the resurgent currents.
(A) The conventional view of the action of the Navβ4 peptide on Na+ channel (scheme 1). C and O are the closed and open states, respectively. +V and–V (or +V’ and–V’) denote voltage-dependent rates accelerated by depolarization and hyperpolarization, respectively. The inactivation state (I) is virtually an open but blocked state (OB), the making of which is coupled to channel activation (C to O to I) because of the essentially negligible (the very slow) C to CB transition. The “+(V+ΔV)” and “–(V+ΔV)” indicate that the voltage dependence of the transitions between state OB (i.e., state I) and CB would be shifted by ΔV for the binding energy of the inactivating peptide. In the absence of Navβ4 peptide, the recovery of the inactivated channel would primarily take the I to CB to C route due to the very slow I to O transition, and thus result in no currents during the recovery process. The Navβ4 peptide is a pore blocker that competes with the inactivating peptide for the open channel pore. The Oβ4 is therefore also a blocked state allowing no current passage, but could only go through the open state to the closed state during hyperpolarization. The resurgent currents are thus generated at the repolarization phase following a depolarization. The size of the arrows in the scheme roughly denotes the relative rate of the transition. The rate from O to Oβ4 cannot be negligible compared to that from O to I for discernible resurgent currents to occur. (B) A new model for the genesis of resurgent currents (scheme 2). O1, O2, I1, and I2 are the first and second open and inactivated states, respectively. The Navβ4 peptide is primarily a gating modifier giving rise to the new gating states O2 and I2, rather than a pore blocker competing with the inactivating peptide. Upon a strong-enough depolarization, a sizable amount of channels in state O1 would quickly move to state O2 and then inactivated (state I2) because the O1 to O2 transition is very fast and no longer negligible compared to the O1 to I1 transition. The I2 to I1 transition is relatively slow so that the recovery from I2 upon repolarization would have a significant chance to take the I2 to O2 to O1 to C route and give rise to discernible resurgent currents. Moreover, although the steady-state occupancy in general favors I1 over I2 (the steady-state I1/I2 ratio is weakly voltage-dependent and is larger at +20 than at +60 mV, Figs 8 and 10), the redistribution from I2 to I1 is relatively slow and would take ~10 ms or longer to accomplish (Figs 8B and 10D). The recovery from state I1, on the other hand, would primarily go through the CB to C route because of the extremely slow rate from I1 to O1, and thus allows no resurgent currents. The resurgent current therefore is a transitional phenomenon, not only because state O2 is itself transient, but also because the inactivated state giving rise to O2 during recovery (i.e., I2) is also mostly transient (rather than an “end” state) at a fixed membrane depolarization. (C) The homology model is constructed based on X-ray crystal structures of Arcobacter butzleri voltage-gated Na+ channel (NavAb) of a closed-pore conformation using Discovery studio V3.0 software (see Material and Methods for more detail). Side view of the homology model of WT Nav1.7 channel shows the transmembrane part of the four domains. Domains I, II, III, and IV are colored yellow, blue, red, and green, respectively. Transmembrane segments (S1–S6) of domain III are highlighted. The side chain of V1316 in the S3–S4 linker of domain III is indicated in the ball and stick model. (D) A regional view of the homology model of WT Nav1.7 channel from the extracellular side of the pore. (E) Two domains (domain III and IV) of the homology model of WT Nav1.7 and p.V1316A mutant channels are shown in the ribbon presentation. The side chains of V1316 in the (S4–S5 linker/D3), L1610 and R1611 (both in S5/D4) are indicated with sticks and balls of different colors. An enlarged view of the boxed area is shown in the right panel, demonstrating inter-residue distances (from side chain tip to tip) of ~10.2 Å and ~6.6 Å between V1316 and L1610 and between V1316 and R1611, respectively, in the WT Nav1.7 channel. On the other hand, the inter-residue distances (from side chain tip to tip) between p.V1316A and L1610, and p.V1316A and R1611 are ~11.3 Å, ~8.1 Å, respectively, in the p.V1316A mutant channel. (F) A summary plot of the relative (tip to tip) distances between residues V1316 (or p.V1316A) and L1610, R1611, V1722, and G1723 in the homology modeling. Note the evidently increased distances in all cases in the p.V1316A mutant than in the WT channels (see also S2 Fig). Individual data is shown in the file of S1 Data.
Fig 10
Fig 10. Computational simulations of resurgent Na+ currents in the WT and p.V1316A mutant channels.
(A) The gating scheme and simulated currents of WT and p.V1316A mutant channels with the same stimulation protocols identical to that in Fig 5A and 5B. The peak of transient currents has been adjusted to be the same in both sets of the simulated currents. There are two open (O1 and O2) and two corresponding inactivated (I1 and I2) states. O2 and I2 are responsible for the genesis of resurgent currents and are significantly existent only in the presence of appropriate gating modifiers such as Navβ4 peptide (see Discussion for more molecular and biophysical details). The full set of kinetic parameters is provided in Table 1. In comparison with the WT channels, the main gating changes caused by the p.V1316A mutation include larger rate constants for α, β and I2O2, and smaller rate constants for O2I2, I1I2 and I2I1. (B) The peak amplitude of the simulated resurgent currents with the same protocols in Fig 5C. (C) The time to peak of resurgent currents was simulated with the same protocols in Fig 7C. (D) The decay of resurgent current with lengthening of the depolarization prepulse is simulated with the same experimental protocol in Fig 8. The lines are fits to the data points of the form: normalized resurgent currents = (1–fo)× exp(–(x–3)/τ)+ fo, where x is the prepulse length in ms. τ and fo are ~8.1 ms and 0.34 for +20 mV, ~20.8 ms and 0.39 for +40 mV, and ~37.8 ms and 0.49 for +60 mV prepulse, respectively, in the WT channel. On the other hand, τ and fo are ~13.6 ms and 0.31 for +20 mV, ~33.3 ms and 0.39 for +40 mV, and ~60.9 ms and 0.54 for +60 mV prepulse, respectively, in the p.V1316A mutant channel. (E) The inverses of time constants in part D are plotted against the prepulse voltage in semi-logarithmic scale. The data are fitted with the following equation 1/tau(V) = 0.29×exp(–1.1V/25) ms–1 for the WT channel, and 1/tau(V) = 0.17×exp(–1.03V/25) ms–1 for the p.V1316A mutant channel, respectively, where V is the prepulse potential in mV. Individual data is shown in the file of S1 Data.

Similar articles

Cited by

References

    1. Catterall WA. From ionic currents to molecular mechanisms: the structure and function of voltage-gated sodium channels. Neuron. 2000;26(1):13–25. . - PubMed
    1. Toledo-Aral JJ, Moss BL, He ZJ, Koszowski AG, Whisenand T, Levinson SR, et al. Identification of PN1, a predominant voltage-dependent sodium channel expressed principally in peripheral neurons. Proc Natl Acad Sci U S A. 1997;94(4):1527–32. - PMC - PubMed
    1. Yarov-Yarovoy V, DeCaen PG, Westenbroek RE, Pan CY, Scheuer T, Baker D, et al. Structural basis for gating charge movement in the voltage sensor of a sodium channel. Proc Natl Acad Sci U S A. 2012;109(2):E93–102. 10.1073/pnas.1118434109 - DOI - PMC - PubMed
    1. Catterall WA, Goldin AL, Waxman SG. International Union of Pharmacology. XLVII. Nomenclature and structure-function relationships of voltage-gated sodium channels. Pharmacol Rev. 2005;57(4):397–409. 10.1124/pr.57.4.4 . - DOI - PubMed
    1. Enomoto A, Han JM, Hsiao CF, Chandler SH. Sodium currents in mesencephalic trigeminal neurons from Nav1.6 null mice. J Neurophysiol. 2007;98(2):710–9. 10.1152/jn.00292.2007 . - DOI - PubMed

LinkOut - more resources