. 2016 Sep 20;45(3):656-668.
doi: 10.1016/j.immuni.2016.08.018.

CD8(+) Lymphocytes Are Required for Maintaining Viral Suppression in SIV-Infected Macaques Treated with Short-Term Antiretroviral Therapy

Affiliations

CD8(+) Lymphocytes Are Required for Maintaining Viral Suppression in SIV-Infected Macaques Treated with Short-Term Antiretroviral Therapy

Emily K Cartwright et al. Immunity. .

Abstract

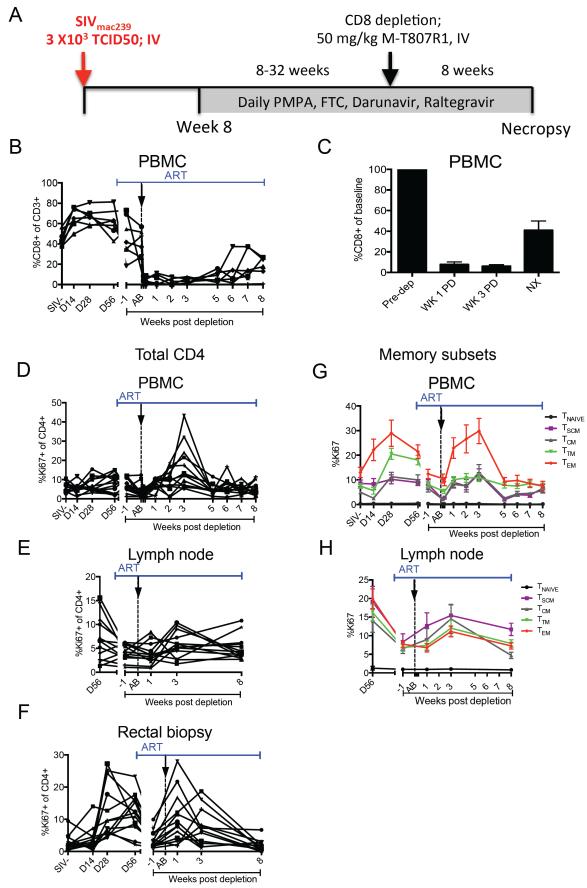
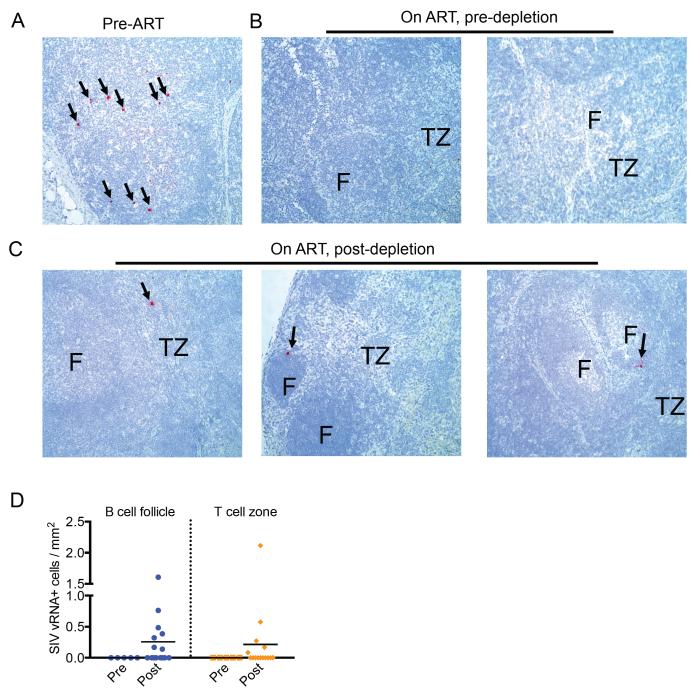
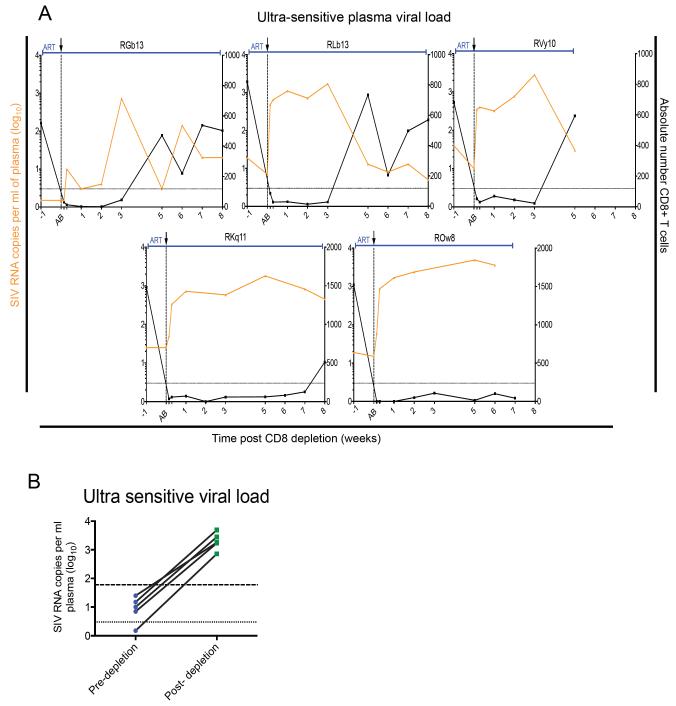
Infection with HIV persists despite suppressive antiretroviral therapy (ART), and treatment interruption results in rapid viral rebound. Antibody-mediated CD8(+) lymphocyte depletion in simian immunodeficiency virus (SIV)-infected rhesus macaques (RMs) shows that these cells contribute to viral control in untreated animals. However, the contribution of CD8(+) lymphocytes to maintaining viral suppression under ART remains unknown. Here, we have shown that in SIV-infected RMs treated with short-term (i.e., 8-32 week) ART, depletion of CD8(+) lymphocytes resulted in increased plasma viremia in all animals and that repopulation of CD8(+) T cells was associated with prompt reestablishment of virus control. Although the number of SIV-DNA-positive cells remained unchanged after CD8 depletion and reconstitution, the frequency of SIV-infected CD4(+) T cells before depletion positively correlated with both the peak and area under the curve of viremia after depletion. These results suggest a role for CD8(+) T cells in controlling viral production during ART, thus providing a rationale for exploring immunotherapeutic approaches in ART-treated HIV-infected individuals.


Figures

Figure 1
Figure 1. Treatment of SIV-infected ART-treated RM with the depleting anti-CD8 antibody MT-807R1
(A) Study design. (B) CD3+CD8+ T cells as percentage of CD3+ lymphocytes in PBMC. (C) CD8+ T cells as percentage of pre-depletion frequencies (“baseline”) in PBMC. Data shown is for 13 SIV-infected ART treated RM. Bars drawn at the mean and error bars represent standard error of mean. Proliferation (Ki67+) of total CD4+ T cells in (D) PBMC, (E) LN, and (F) RB. Proliferation (Ki67+) of CD4+ T cell subsets in (G) PBMC and (H) LN. Gap in x-axis represents 8-32 weeks of continuous ART. Black arrow and dotted vertical line indicate MT-807R1 administration. NX=necropsy.
Figure 2
Figure 2. CD8 depletion results in increased plasma viremia in ART-treated SIV-infected RMs
Viral load (red) and CD8+ T cell counts (black) of SIV-infected RM that were (A) persistently suppressed, (B) intermittently suppressed, and (C) never fully suppressed on ART. Black arrow and dotted vertical line indicate anti-CD8 antibody MT-807R1 administration. (D) Geometric mean viremia for each statistical period for 13 RM. (Described fully in Table S3). Bars show the geometric mean with 95% CI, *p< 0.05, ***p<0.001. (E) Geometric mean viremia for each statistical period for 7 persistently suppressed RM. Bars show the geometric mean with 95% CI, *p <0.05. Statistical analysis was conducted using a linear, mixed effects model.
Figure 3
Figure 3. CD8 depletion results in increased SIV-RNA in LNs of ART-treated SIV-infected RMs
Representative in situ hybridization of SIV-RNA in LNs of (A) chronically infected, (B) ART-treated, pre-CD8 depletion, and (C) ART-treated, post-CD8 depletion RMs. Data presented in (B) and (C) are from LNs of two and three different animals, respectively. Red indicates SIV-RNA positive, productively infected cell; F=follicle, TZ= T cell zone. Images are 20X magnification. (D) Number of SIV-RNA-positive cells per millimeter square in the B cell area (left) and T cell area (right) of the LN before and after CD8 depletion.
Figure 4
Figure 4. Ultrasensitive viral load assay confirms the increase in viremia post-CD8 depletion
(A) Viral load (orange) and CD8+ T cell counts (black) of SIV-infected RM that were persistently suppressed. Shaded area represents ART period. Black arrow and dotted vertical line indicate anti-CD8 antibody MT-807R1 administration. (B) Pre-depletion and peak post-depletion viremia (log10) for 5 RM. Dotted line is limit of detection of ultrasensitive viral load assay (3 copies/ml plasma). Dashed line is limit of detection of standard viral load assay (60 copies/ml plasma). Paired t-test, *p< 0.05.
Figure 5
Figure 5. Pre-depletion levels of SIV infection in CD4+ T cells predicts post CD8-depletion changes in viremia
Fraction of SIV-infected sorted CD4+ T cells in (A) PBMC and (B) LN. WK 3= week 3 post-depletion, NX= necropsy. Kruskal-Wallis, NS=not significant. Correlation of cell-associated SIV-DNA in peripheral CD4+ T cells pre-depletion and the peak viral rebound (C) and area-under-the-curve (D) post depletion. Data is shown for all 13 animals. Spearman rank correlation. (formula image
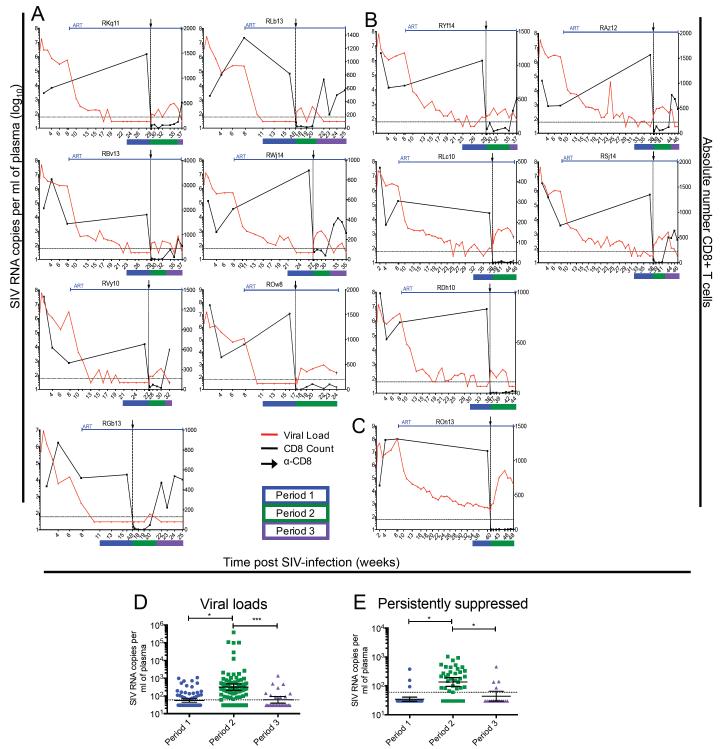
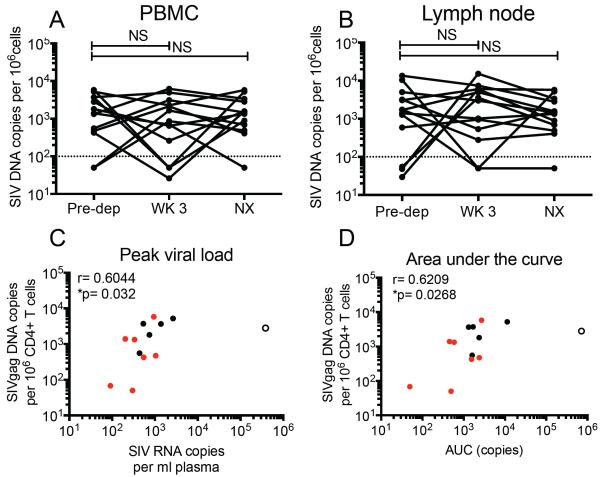
) persistent suppressors, (◯) intermittent suppressors,(엯) never suppressed.
Figure 6
Figure 6. Highlighter plots of Single Genome Amplification derived Env amino acid sequences
Highlighter plots were generated to illustrate variation in amino acid composition within Env over the course of the experimental protocol in three animals: RLb13 (left), ROw8 (center), and RKq11 (right). Sequences were isolated at peak viral load, pre-ART initiation, and post-CD8 depletion (range week 1 to week 6). Colored ticks indicate deviation from master sequence.

Comment in

References

    1. Altfeld M, Addo MM, Rosenberg ES, Hecht FM, Lee PK, Vogel M, Yu XG, Draenert R, Johnston MN, Strick D, et al. Influence of HLA-B57 on clinical presentation and viral control during acute HIV-1 infection. Aids. 2003;17:2581–2591. - PubMed
    1. Bartz SR, Hohenwalter E, Hu MK, Rich DH, Malkovsky M. Inhibition of human immunodeficiency virus replication by nonimmunosuppressive analogs of cyclosporin A. Proceedings of the National Academy of Sciences of the United States of America. 1995;92:5381–5385. - PMC - PubMed
    1. Betts MR, Nason MC, West SM, De Rosa SC, Migueles SA, Abraham J, Lederman MM, Benito JM, Goepfert PA, Connors M, et al. HIV nonprogressors preferentially maintain highly functional HIV-specific CD8+ T cells. Blood. 2006;107:4781–4789. - PMC - PubMed
    1. Borrow P, Lewicki H, Hahn BH, Shaw GM, Oldstone MB. Virus-specific CD8+ cytotoxic T-lymphocyte activity associated with control of viremia in primary human immunodeficiency virus type 1 infection. Journal of virology. 1994;68:6103–6110. - PMC - PubMed
    1. Borrow P, Lewicki H, Wei X, Horwitz MS, Peffer N, Meyers H, Nelson JA, Gairin JE, Hahn BH, Oldstone MB, Shaw GM. Antiviral pressure exerted by HIV-1-specific cytotoxic T lymphocytes (CTLs) during primary infection demonstrated by rapid selection of CTL escape virus. Nature medicine. 1997;3:205–211. - PubMed

Publication types

MeSH terms