. 2016 Sep 20;16(12):3181-3194.
doi: 10.1016/j.celrep.2016.08.064.

Bcl11a Deficiency Leads to Hematopoietic Stem Cell Defects with an Aging-like Phenotype

Affiliations

Bcl11a Deficiency Leads to Hematopoietic Stem Cell Defects with an Aging-like Phenotype

Sidinh Luc et al. Cell Rep. .

Abstract

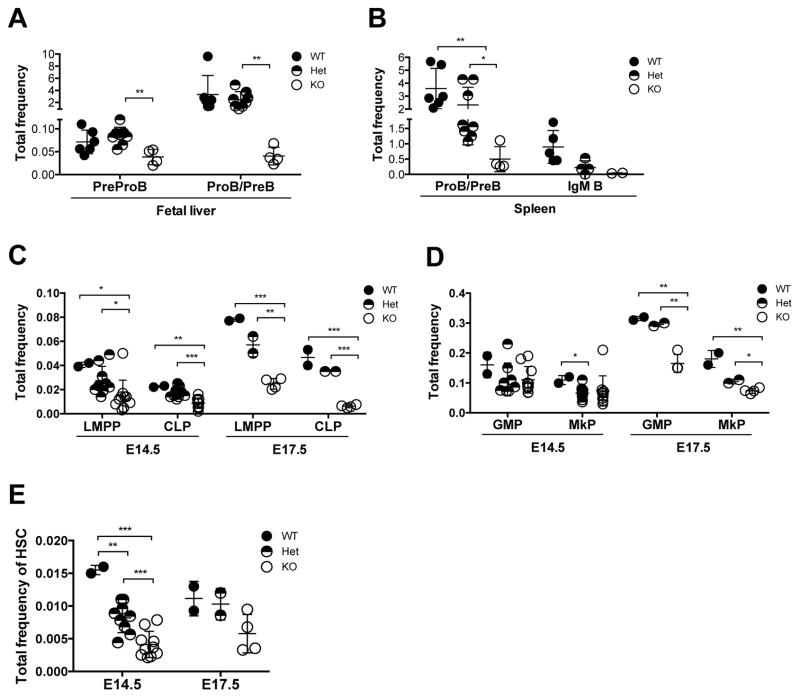
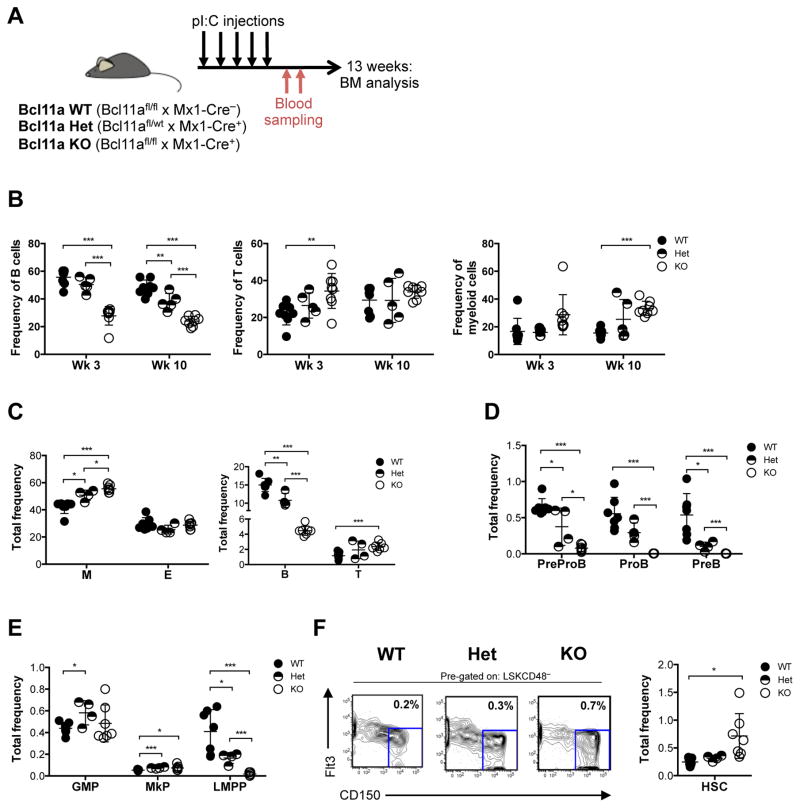
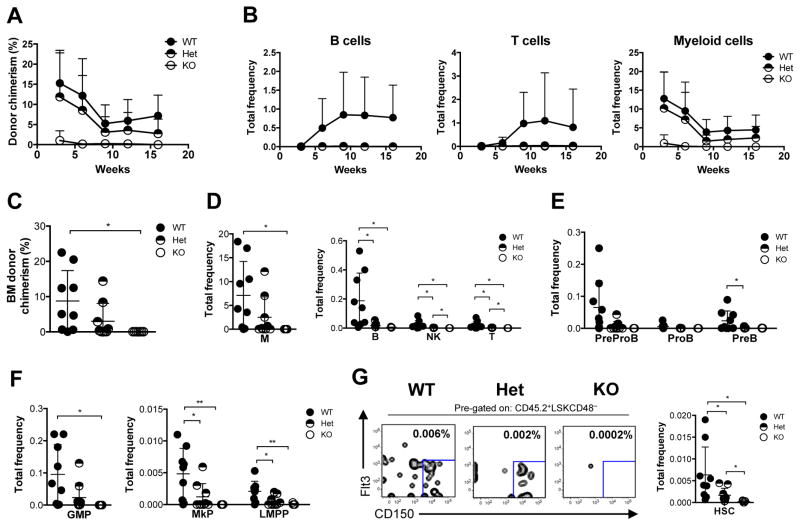
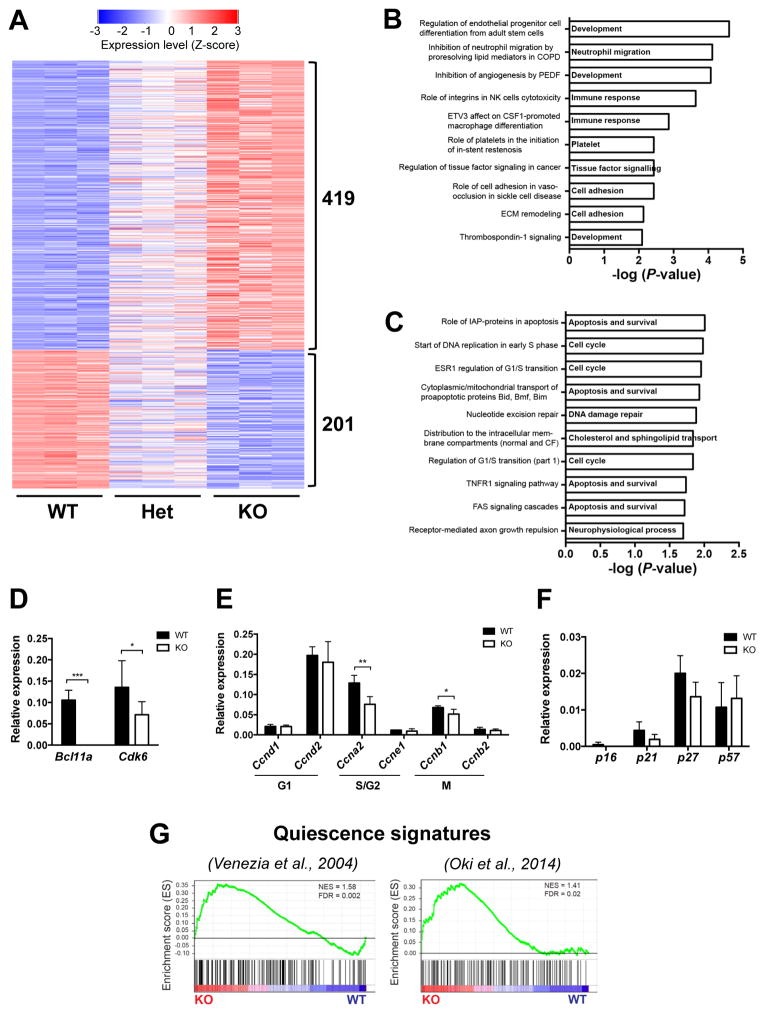
B cell CLL/lymphoma 11A (BCL11A) is a transcription factor and regulator of hemoglobin switching that has emerged as a promising therapeutic target for sickle cell disease and thalassemia. In the hematopoietic system, BCL11A is required for B lymphopoiesis, yet its role in other hematopoietic cells, especially hematopoietic stem cells (HSCs) remains elusive. The extensive expression of BCL11A in hematopoiesis implicates context-dependent roles, highlighting the importance of fully characterizing its function as part of ongoing efforts for stem cell therapy and regenerative medicine. Here, we demonstrate that BCL11A is indispensable for normal HSC function. Bcl11a deficiency results in HSC defects, typically observed in the aging hematopoietic system. We find that downregulation of cyclin-dependent kinase 6 (Cdk6), and the ensuing cell-cycle delay, correlate with HSC dysfunction. Our studies define a mechanism for BCL11A in regulation of HSC function and have important implications for the design of therapeutic approaches to targeting BCL11A.


Figures

Figure 1
Figure 1. Decreases in HSCs and lymphoid progenitors in Bcl11a-deficient embryos
(A) PreProB cell and ProB cell/PreB cell (ProB/PreB) frequency in E18.5 fetal liver of Bcl11afl/Δ × Gata1-Cre embryos. (B) ProB/PreB and IgM+ B cell frequency in E18.5 fetal spleen of Bcl11afl/Δ × Gata1-Cre embryos. (C) Lymphoid-primed multipotent (LMPP) and common lymphoid progenitor (CLP) frequency in E14.5 and E17.5 fetal liver of Bcl11afl/Δ × Gata1-Cre embryos. (D) Granulocyte-monocyte progenitor (GMP) and megakaryocyte progenitor (MkP) frequency in E14.5 and E17.5 fetal liver of Bcl11afl/Δ × Gata1-Cre embryos. (E) Hematopoietic stem cell (LSKCD48Flt3CD150+) frequency in E14.5 and E17.5 fetal liver of Bcl11afl/Δ × Gata1-Cre embryos. Error bars represent mean ± SD. In (A–B) n = 5–6 WT, 4–8 Het, 2–4 KO from E18.5 embryos. In (C–E) n = 2 WT, 9 Het, 10 KO from E14.5 embryos and n = 2 WT, 2 Het, 4 KO from E17.5 embryos. *p<0.05; **p<0.01; ***p<0.001. See also Figure S1.
Figure 2
Figure 2. Acute deletion of Bcl11a in steady-state hematopoiesis results in loss of lymphoid progenitors and B cells
(A) Experimental design for characterization of the hematopoietic system following acute deletion of Bcl11a. (B) Frequency of peripheral blood B, T and myeloid cells 3 and 10 weeks following Bcl11a gene deletion. (C) Frequency of BM myeloid (M), erythroid (E), B and T cells 13 weeks following Bcl11a gene deletion. (D) Frequency of BM B cell progenitors 13 weeks following Bcl11a gene deletion. (E) Frequency of BM GMP, MkP and LMPP 13 weeks following Bcl11a gene deletion. (F) Frequency of BM HSC 13 weeks following Bcl11a gene deletion (right) and representative FACS profiles (left). Mean frequencies of total HSCs from kit-enriched BM is shown in the FACS plots. Error bars represent mean ± SD. In (B) n = 8 WT, 5 Het, 8 KO, in (C–F) n = 7 WT, 4 Het, 7 KO. *p<0.05; **p<0.01; ***p<0.001. See also Figures S2 and S3.
Figure 3
Figure 3. HSCs from Bcl11a-deficient mice have impaired repopulation ability
(A) Experimental design to evaluate HSC activity from Bcl11a-deficient mice. (B) Donor-chimerism in peripheral blood following transplantation of HSCs from Bcl11a WT, Het and KO mice before and after Bcl11a gene deletion. (C) Frequency of donor-derived BM myeloid (M), B, NK and T cells 18 weeks following Bcl11a gene deletion. (D) Frequency of donor-derived BM B cell progenitors 18 weeks following Bcl11a gene deletion. (E) Frequency of donor-derived BM GMP, MkP and LMPP 18 weeks following Bcl11a gene deletion. (F) Frequency of donor-derived BM HSC 18 weeks following Bcl11a gene deletion (right) and representative FACS profiles (left). Mean frequencies of total HSCs from kit-enriched BM is shown in the FACS plots. Error bars represent mean ± SD. In (B) n = 7 WT, 8 Het, 7–8 KO, in (C–F) n = 6 WT, 7 Het, 6 KO. *p<0.05; **p<0.01; ***p<0.001. See also Figure S4.
Figure 4
Figure 4. Bcl11a-deficiency results in impaired HSC self-renewal capacity
(A) Donor-chimerism in peripheral blood following secondary transplantation of Bcl11a WT, Het and KO HSCs isolated from primary transplanted mice. (B) Donor-derived B, T and myeloid cells in peripheral blood from (A). (C) Donor-chimerism in BM 21 weeks following secondary transplantation of Bcl11a WT, Het and KO HSCs. (D) Frequency of donor-derived BM myeloid (M), B, NK and T cells 21 weeks following secondary transplantation. (E) Frequency of donor-derived BM B cell progenitors 21 weeks following secondary transplantation. (F) Frequency of donor-derived BM GMP, MkP and LMPP 21 weeks following secondary transplantation. (G) Frequency of donor-derived BM HSC 21 weeks following secondary transplantation (right) and representative FACS profiles (left). Mean frequencies of total HSCs from kit-enriched BM is shown in the FACS plots. Data and error bars represent mean ± SD. In (A–B) n = 9 WT, 9 Het, 7 KO, in (C–G) n = 9 WT, 9 Het, 7 KO. *p<0.05; **p<0.01; ***p<0.001. See also Figure S5.
Figure 5
Figure 5. Bcl11a-deficient HSCs have downregulated Cdk6 expression and a quiescence signature
(A) Heatmap representation of differentially regulated genes (≥2 fold; p<0.01) between Bcl11a WT and KO HSCs ranked according to log-fold change. (B) Enriched pathways of genes upregulated in Bcl11a-deficient HSCs. (C) Enriched pathways of genes downregulated in Bcl11a-deficient HSCs. (D) Relative mRNA expression of Bcl11a and Cdk6 in sorted Bcl11a WT and KO HSCs. (E) Relative mRNA expression of typical cell cycle promoting genes in sorted Bcl11a WT and KO HSCs. (F) Relative mRNA expression of typical cell cycle inhibitor genes in sorted Bcl11a WT and KO HSCs. (G) Gene set enrichment analysis of two quiescence gene signatures in Bcl11a WT and KO HSCs. In (A–C, G) n = 3/genotype, in (D–F) n = 4–7/genotype. Data in (D–F) represent mean ± SD. *p<0.05; **p<0.01; ***p<0.001. See also Figure S6 and Tables S1 and S2.
Figure 6
Figure 6. Bcl11a-deficient HSCs have delayed cell cycle kinetics
(A) Cell cycle analysis by DAPI staining of Bcl11a WT and KO HSCs (left) and the cell cycle profiles (right) 7 weeks post-p(I:C). n = 4 WT, 6 KO. (B) Cell cycle analysis by Ki-67 and DAPI staining showing frequency of HSCs in G0 and G1 (left) and representative FACS profiles (right) 7 weeks post-p(I:C). n = 4 WT, 6 KO. (C) Frequency of Bcl11a WT and KO HSCs with BrdU incorporation at 12, 24 and 60 hours after BrdU injection in vivo. n = 3–4 WT, 3 KO. (D) Cell cycle analysis by DAPI staining (left) and the cell cycle profiles (right) following transplantation of Bcl11a WT and KO HSCs, 4–7 weeks post-p(I:C). n = 5 WT, 4 KO. (E) Cell cycle analysis by Ki-67 and DAPI staining showing frequency of HSCs in G0 and G1 (left) and the representative FACS profiles (right) following transplantation of Bcl11a WT and KO HSCs, 4–7 weeks post-p(I:C). n = 9 WT, 8 KO. (F) Cell division analysis 24 and 48 hours (hrs) after plating of clonal HSCs from Bcl11a WT and KO HSCs. n = 120 WT cells, 99 KO cells (24 hrs) and 152 WT cells, 125 KO cells (48 hrs). (G) Flow cytometry analysis of cell division kinetics 6 days after plating HSCs from Bcl11a WT and KO HSCs. Data from 2 independent experiments. (H) Quantification of cell expansion from cultured single HSCs at day 10. n = 153 WT cells, 98 KO cells. (I) Frequency of Annexin V+ apoptotic HSCs in Bcl11a WT and KO mice. n = 7 WT, 6 KO. Data and error bars represent mean ± SD. *p<0.05; **p<0.01; ***p<0.001.
Figure 7
Figure 7. HSCs from Bcl11a-deficient mice resemble the phenotype of aging HSCs
(A) Gene set enrichment analyses of two aging gene signatures in Bcl11a WT and KO HSCs. (B) Relative mRNA expression of Bcl11a and Cdk6 in sorted HSCs from 2-month and 15–17-month old C57BL7 mice. n = 4/group. (C) Relative mRNA expression of cell cycle genes in sorted HSCs from 2-month and 15–17-month old C57BL7 mice. n = 4/group. (D) Representative FACS profiles of γH2AX staining in HSCs showing mean frequencies from (E). (E) Frequency of γH2AX in HSCs from Bcl11a WT and KO mice 10 weeks post-p(I:C) and an irradiated control (5 Gy). n = 4 WT, 3 KO, 1 irradiated control. (F) Relative mRNA expression of Mcm genes in sorted HSCs from 2-month and 15–17-month old C57BL7 mice. n = 4/group. (G) Gene set enrichment analysis of a Mcm gene signature in Bcl11a WT and KO HSCs. (H) Relative mRNA expression of Mcm genes in Bcl11a WT and KO HSCs. (I) Gene set enrichment analyses of upregulated and downregulated genes (≥2-fold, p<0.01) from Bcl11a KO mice in a data set from old (>22 months old) and young (2–3 months old) long-term HSCs acquired from Kowalczyk et al. (J) Hemoglobin levels (g/dL) in 2-month (2-mo) and 10-month (10-mo) old Bcl11a WT and KO mice. n = 8 WT, 6 KO 2-mo and 15 WT, 8 KO 10 mo. (K) Frequency of γH2AX in HSCs from 9-month old Bcl11a WT and KO mice and 2-month and 8-month old C57BL6 (B6) mice. n = 3 WT, 3 KO; 3 B6 2-mo, 2 B6 8-mo. In (A, G, I) n = 3/genotype. Data represent mean ± SD. *p<0.05; **p<0.01; ***p<0.001. See also Figure S7.

Similar articles

Cited by

References

    1. Alcalay M, Meani N, Gelmetti V, Fantozzi A, Fagioli M, Orleth A, Riganelli D, Sebastiani C, Cappelli E, Casciari C, Sciurpi MT, Mariano AR, Minardi SP, Luzi L, Muller H, Di Fiore PP, Frosina G, Pelicci PG. Acute myeloid leukemia fusion proteins deregulate genes involved in stem cell maintenance and DNA repair. Journal of Clinical Investigation. 2003;112:1751–1761. doi: 10.1172/JCI200317595. - DOI - PMC - PubMed
    1. Bauer DE, Kamran SC, Lessard S, Xu J, Fujiwara Y, Lin C, Shao Z, Canver MC, Smith EC, Pinello L, Sabo PJ, Vierstra J, Voit RA, Yuan GC, Porteus MH, Stamatoyannopoulos JA, Lettre G, Orkin SH. An erythroid enhancer of BCL11A subject to genetic variation determines fetal hemoglobin level. Science. 2013;342:253–257. doi: 10.1126/science.1242088. - DOI - PMC - PubMed
    1. Beerman I, Seita J, Inlay MA, Weissman IL, Rossi DJ. Quiescent hematopoietic stem cells accumulate DNA damage during aging that is repaired upon entry into cell cycle. Cell Stem Cell. 2014;15:37–50. doi: 10.1016/j.stem.2014.04.016. - DOI - PMC - PubMed
    1. Busch K, Klapproth K, Barile M, Flossdorf M, Holland-Letz T, Schlenner SM, Reth M, Höfer T, Rodewald H-R. Fundamental properties of unperturbed haematopoiesis from stem cells in vivo. Nature. 2015 doi: 10.1038/nature14242. - DOI - PubMed
    1. Daniel MG, Lemischka IR, Moore K. Converting cell fates: generating hematopoietic stem cells de novovia transcription factor reprogramming. Ann N Y Acad Sci. 2016 doi: 10.1111/nyas.12989. n/a–n/a. - DOI - PMC - PubMed