. 2016 Sep 20;16(12):3195-3207.
doi: 10.1016/j.celrep.2016.08.050.

Multivalent Chromatin Engagement and Inter-domain Crosstalk Regulate MORC3 ATPase

Affiliations

Multivalent Chromatin Engagement and Inter-domain Crosstalk Regulate MORC3 ATPase

Forest H Andrews et al. Cell Rep. .

Abstract

MORC3 is linked to inflammatory myopathies and cancer; however, the precise role of MORC3 in normal cell physiology and disease remains poorly understood. Here, we present detailed genetic, biochemical, and structural analyses of MORC3. We demonstrate that MORC3 is significantly upregulated in Down syndrome and that genetic abnormalities in MORC3 are associated with cancer. The CW domain of MORC3 binds to the methylated histone H3K4 tail, and this interaction is essential for recruitment of MORC3 to chromatin and accumulation in nuclear bodies. We show that MORC3 possesses intrinsic ATPase activity that requires DNA, but it is negatively regulated by the CW domain, which interacts with the ATPase domain. Natively linked CW impedes binding of the ATPase domain to DNA, resulting in a decrease in the DNA-stimulated enzymatic activity. Collectively, our studies provide a molecular framework detailing MORC3 functions and suggest that its modulation may contribute to human disease.


Figures

Figure 1
Figure 1. MORC3 is consistently upregulated in Trisomy 21 cells
(a) Box and whisker plots of MORC2, MORC3 and MORC4 expression levels across tissue types from the GTEx Portal. (b–d) Box and whisker plots of MORC3, MORC2 and MORC4 expression in D21 and T21 fibroblasts (b), lymphoblastoid cell lines (c), and patient monocytes and T cells (d). mRNA expression values are in reads per kilobase per million (RPKM). Benjamini-Hochberg adjusted p-values were calculated using DESeq2. (e) Venn diagram of differentially expressed genes in Down syndrome from human fibroblasts, human lymphoblastoids, and mouse brains. See also Figure S1.
Figure 2
Figure 2. MORC3-CW binds to the histone H3 tail
(a) Architecture of MORC3. (b) Representative scanned image of a peptide microarray hybridized with GST-MORC3 CW domain. Red spots are bound MORC3. Green spots are an internal printing control and are used to filter false negatives from quantified datasets (see (Rothbart et al., 2012)). (c) Scatter plot of relative signal intensities from two microarrays hybridized with GST-MORC3 CW domain. Average signal intensities from quantified arrays were normalized to the most intense series of peptide spots and plotted on a relative scale from 0 (weak binding) to 1 (strong binding). The correlation coefficient was calculated by linear regression analysis using GraphPad Prism v5. (d) Normalized average microarray signal intensities measuring the interaction GST-MORC3 CW domain with the indicated histone peptides. Error represents ± s.e.m. from two arrays. (e) Superimposed 1H,15N HSQC spectra of MORC3-CW collected upon titration with H3K4me3 and H3K4me0 peptides (residues 1–12 of H3). Spectra are color coded according to the protein:peptide molar ratio. (f) Binding affinities of wild type MORC-CW for the indicated histone peptides measured by tryptophan fluorescence. (g) Representative binding curve used to determine the Kd values by fluorescence. See also Tables S1 and S2.
Figure 3
Figure 3. The molecular basis for recognition of H3K4me3 and H3K4me1 by MORC3-CW
(a) The ribbon diagram of the MORC3 CW domain in complex with H3K4me3 peptide (yellow). Dashed lines represent intermolecular hydrogen bonds. The protein residues involved in the interactions with A1, R2, K4me3, Q5, R8 and K9 of the peptide are colored wheat, blue, salmon, light green, pink and brown, respectively. (b) The surface cartoon of CW domain with histone peptide shown in ribbon and stick. (c) A 2FoFc map was calculated and contoured at 1.0σ as a yellow mesh around the model of histone peptide and grey mesh around Trp-groove residues. (c) Overlay of the structures of the MORC3 CW:H3K4me3 and MORC3 CW:H3K4me1 complexes. (d) A zoom-in view of the superimposed K4me1- and K4me3-binding grooves. Water molecules are shown as red spheres. See also Table S3.
Figure 4
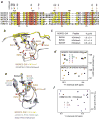
Figure 4. The end-wall residues control selectivity of MORC3-CW
(a) Alignment of the CW domain sequences: absolutely, moderately and weakly conserved residues are colored red, yellow and light purple, respectively. The residues of MORC3-CW involved in contact with each residue of histone H3 are indicated by arrows. An asterisk indicates E453. (b) A close-up view of the overlaid K4me3-binding sites in MORC3 (wheat) and ZCWPW1 (grey). (c) Binding affinities of the MORC3-CW mutants as determined by intrinsic tryptophan fluorescence. (d) Superimposed 1H,15N HSQC spectra of mutated MORC3-CW, collected upon titration with H3K4me3 peptide. Spectra are color coded according to the protein:peptide molar ratio. (e) A close-up view of the overlaid K4me3-binding sites in MORC3-CW (wheat) and PHD fingers of JARID1A (cyan) and ING2 (purple). (f) Superimposed 1H,15N HSQC spectra of KDM1B CW, recorded as H3K4me2 was titrated in. See also Figure S2.
Figure 5
Figure 5. The critical role of the histone-binding site residues of MORC3-CW
(a) Binding affinities of the MORC3-CW mutants as determined by tryptophan fluorescence (a) or NMR (b). (b) Superimposed 1H,15N HSQC spectra of the MORC3-CW mutants, collected upon titration with H3K4me3. Spectra are color coded according to the protein:peptide molar ratio. (c) Representative binding curves used to determine the Kd values by NMR. (d) Superimposed 1H,15N HSQC spectra of MORC3-CW, recorded as H3 peptide (residues T3-S10) was titrated in. See also Figures S3 and S4.
Figure 6
Figure 6. MORC3 is an ATPase
(a) Superimposed 1H,15N TROSY (top-left and bottom row) spectra and 1H,15N HSQC spectra (top-right) of MORC3-CW E453A, collected upon titration with indicated ligands. Spectra are color coded according to the protein:ligands molar ratio. (b) Representative ITC binding curves observed for the interaction between MORC3 His-ATPase and CW. (c) The rate of ATP hydrolysis by MORC3 His-ATPase. Error represents SD between at least three separate experiments (two experiments for His-ATPase-CW with DNA or H3 at 30 °C). (d, e) EMSA with NCPs (d) or 601 DNA (e) in the presence of increasing amounts of His-ATPase, as described in methods. (f) EMSA with 601 DNA in the presence of increasing amounts of His-ATPase-CW. (g) Superimposed 1H,15N HSQC spectra of MORC3-CW upon titration with 601 DNA. (h) A model for the regulation of MORC3. See also Figure S5.
Figure 7
Figure 7. The CW domain is required for the recruitment of MORC3 to chromatin
(a) Chromatin association assays for FLAG-tagged MORC3 (WT) or the indicated mutants from asynchronously growing HeLa cells. Mock, no DNA control. (b) Representative confocal microscopy images of FLAG-tagged wild-type and mutant forms of MORC3 in HeLa cells. Scale bars, 10 μm. See also Figure S6.

References

    1. Dutta R, Inouye M. GHKL, an emergent ATPase/kinase superfamily. Trends in biochemical sciences. 2000;25:24–28. - PubMed
    1. Fiorentino DF, Chung LS, Christopher-Stine L, Zaba L, Li S, Mammen AL, Rosen A, Casciola-Rosen L. Most patients with cancer-associated dermatomyositis have antibodies to nuclear matrix protein NXP-2 or transcription intermediary factor 1gamma. Arthritis and rheumatism. 2013;65:2954–2962. - PMC - PubMed
    1. Gonzalez-Fernandez R, Morales M, Avila J, Martin-Vasallo P. Changes in leukocyte gene expression profiles induced by antineoplastic chemotherapy. Oncology letters. 2012;3:1341–1349. - PMC - PubMed
    1. Gunawardena H, Wedderburn LR, Chinoy H, Betteridge ZE, North J, Ollier WE, Cooper RG, Oddis CV, Ramanan AV, Davidson JE, et al. Autoantibodies to a 140-kd protein in juvenile dermatomyositis are associated with calcinosis. Arthritis and rheumatism. 2009;60:1807–1814. - PMC - PubMed
    1. Guo X, Wang L, Li J, Ding Z, Xiao J, Yin X, He S, Shi P, Dong L, Li G, et al. Structural insight into autoinhibition and histone H3-induced activation of DNMT3A. Nature. 2015;517:640–644. - PubMed