. 2016 Sep 20;16(12):3322-3333.
doi: 10.1016/j.celrep.2016.08.044.

Neuronal Nuclear Membrane Budding Occurs during a Developmental Window Modulated by Torsin Paralogs

Affiliations

Neuronal Nuclear Membrane Budding Occurs during a Developmental Window Modulated by Torsin Paralogs

Lauren M Tanabe et al. Cell Rep. .

Abstract

DYT1 dystonia is a neurodevelopmental disease that manifests during a discrete period of childhood. The disease is caused by impaired function of torsinA, a protein linked to nuclear membrane budding. The relationship of NE budding to neural development and CNS function is unclear, however, obscuring its potential role in dystonia pathogenesis. We find NE budding begins and resolves during a discrete neurodevelopmental window in torsinA null neurons in vivo. The developmental resolution of NE budding corresponds to increased torsinB protein, while ablating torsinB from torsinA null neurons prevents budding resolution and causes lethal neural dysfunction. Developmental changes in torsinB also correlate with NE bud formation in differentiating DYT1 embryonic stem cells, and overexpression of torsinA or torsinB rescues NE bud formation in this system. These findings identify a torsinA neurodevelopmental window that is essential for normal CNS function and have important implications for dystonia pathogenesis and therapeutics.


Figures

Figure 1
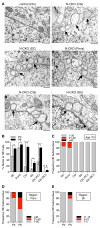
Figure 1. Neuronal Nuclear Membrane Budding Increases During Early Postnatal CNS Maturation
Conditional CNS deletion of torsinA caused neuronal NE buds in all CNS regions examined. (A) Ultrastructural images of normal control and nestin-Cre conditional knockout (N-CKO) neuronal nuclei with NE budding from P8 cortex (ctx; first row). Subsequent rows are examples from spinal cord (SC), pons, Purkinje cells of cerebellum (Cbl), and striatum (Str). Nuclear membrane buds are denoted by arrows, N = Nucleus, C = Cytosol. Scale bar = 500 nm. (B) Percentage of nuclei with NE buds in the CNS regions shown in (A) at P0 and P8 (n = 2, per region/age). PC = Purkinje cells; GC = granule cells. Results are expressed as mean ± SEM. One-way Anova; * = P < 0.05, ** = P < 0.01, **** = P < 0.0001. (C) Stacked bar graphs showing percentage of nuclei (at P0) with different numbers of buds/nucleus by region in all regions examined. (D–E) The number of NE buds/nucleus continues to accumulate from P0 to P8. Stacked bar graphs show percentage of nuclei with different numbers of buds/nucleus in (D) pons and (E) striatum (n = 2, per region/age).
Figure 2
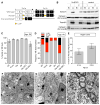
Figure 2. Neuronal Nuclear Membrane Budding is a Cell Autonomous Process that Occurs During a Neurodevelopmental Window
(A) Western blot demonstrating efficient deletion of torsinA protein in Syn-CKO mice in cortex (Ctx), pons, and spinal cord (SC), but not striatum (Str), cerebellum (Cbl), or liver (n = 2, per region). (B) Quantification of the torsinA western blots displayed in (A). (C) Percentage of nuclei with NE buds in P10 Syn-CKO mice in regions of confirmed torsinA deletion. Results are expressed as mean ± SEM. (D) Western blot showing efficient deletion of torsinA protein from striatum in Dlx-CKO mice. (E) Developmental time course of NE bud frequency in striatum of Dlx-CKO mice from E18.5 to P42 reveals the trajectory of NE bud development, peak, and resolution. (F) Striatal lysates from wild-type mice demonstrate that endogenous levels of torsinB levels are low as NE buds accumulate (P0 to P7), and that torsinA and torsin B exhibit opposite changes in levels of expression as NE buds resolve (P7 to P28). Levels of the torsinA-interacting proteins LAP1 and LULL1 remain largely unchanged during this period of CNS maturation. The changes for torsinA, torsinB, LAP1, and LULL1 are quantified in (G) as a relative percentage to calnexin control. Results are expressed as mean ± SEM. All lysates in duplicate for western blot.
Figure 3
Figure 3. TorsinB Modulates the Timing of Critical Period Opening for Neuronal NE Budding
(A) Schematic of the floxed Tor1(ab) allele and product of Cre recombination. (B) Western blot demonstrating deletion of torsinA and torsinB from brain (Br), but not liver (Lv) in N-dCKO mice. (C) Neurons of N-dCKO mice exhibit similarly high levels NE bud formation in areas of differing developmental age/maturational state (P0; n = 2, per region/age). (D) Stacked bar graphs show percentage of nuclei with differing numbers of buds/nucleus by region (P0). (E) N-dCKO mice exhibit NE budding in migrating cortical neurons, a developmental stage in which budding does not occur in N-CKO mice. Quantification of percentage of affected nuclei (n = 2 per age). (F – H) Ultrastructural images of migrating cortical neurons of N-dCKO animals at E16.5. (F) Low magnification image of several migrating nuclei (N). (G) Higher magnification of elongated migrating nuclei with NE buds. (H) Boxed NE from (G) shows arrows pointing at NE buds at greater magnification. Scale bars = 1 um. Results are expressed as mean ± SEM.
Figure 4
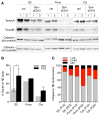
Figure 4. TorsinB Modulates the Timing of Neurodevelopmental Window Closure for NE Budding
(A) Western blot demonstrating conditional deletion of torsinA and torsinB protein in spinal cord (SC), pons, and cortex (Ctx) in Syn-dCKO mice. Note that Synapsin 1-Cre expresses exclusively within neurons, so much of the remaining protein likely derives from non-neuronal cells. (B) NE budding continues to increase in Syn-dCKO neurons from P10 to P23, when it resolves completely in Syn-CKO mice (n = 2, per region/age). One-way Anova; * = P < 0.05. (C) Stacked bar graph shows percentage of nuclei with differing numbers of buds/nucleus (P10 and P23). Note that NE buds/nucleus continues to accumulate during this time. Results are expressed as mean ± SEM.
Figure 5
Figure 5. TorsinB overexpression suppresses NE budding during the maturation of DYT1-mutant neurons
(A) Diagrammatic overview of experimental design. Wild-type and DYT1-mutant mouse ES (mES) cells were grown in suspension for 2 days to form embryoid bodies (EBs). They were then driven down either a neural or cardiomyocyte lineage. For the neural lineage, they were exposed to retinoic acid (RA) for 5 days and subsequently plated on poly-D-lysine (PDL) and laminin for up to 8 days, during which time they extended processes, and neuron (N) markers. For the cardiomyocyte (CM) lineage, they were exposed to ascorbic acid (AA) for 5 days and subsequently plated on gelatin for up to 8 days; these cultures developed beating foci within 48 hours of AA exposure. (B) Western blots of NF-M and GAD65/67 demonstrating that control and DYT1-mutant mES cells differentiate into neurons with a similar time course following RA exposure. γ-tubulin used as loading control. (C) Ultrastructural analysis of mutant neurons and muscle demonstrates the development of NE buds selectively in the neural lineage that are indistinguishable from those observed in mouse brain. (D) Percentage of neuronal nuclei with buds increases as the cells mature on PDL/laminin (n = 2 per time-point). (E) Expression of torsinA, torsinB, LAP1 and LULL1 demonstrates a unique divergence of torsinB expression levels during neural and cardiomyocyte differentiation. Note that the asterisk denotes the major immunoreactive band of LULL1 in the cardiomyocyte lysate. (F) Relative quantification of torsinA and torsinB levels shown in (E). (G) Introduction of lentiviral GFP-torsinA, GFP-torsinB, or GFP-torsin2A midway through neuronal differentiation. Both torsinA and torsinB rescued NE budding phenotype in mutant neuronal EBs. Mann-Whitney: Compared to vehicle, GFP-torsinA: P = 0.000094; GFP-torsinB: P = 0.006365 ; P = 0.112278; ** = P < 0.01,**** = P < 0.0001. Results are expressed as mean ± SEM.

Similar articles

Cited by

References

    1. Bahn E, Siegert S, Pfander T, Kramer ML, Schulz-Schaeffer WJ, Hewett JW, Breakefield XO, Hedreen JC, Rostásy KM. TorsinB expression in the developing human brain. Brain Res. 2006;1116:112–119. doi: 10.1016/j.brainres.2006.07.102. - DOI - PubMed
    1. Bain G, Ray WJ, Yao M, Gottlieb DI. Retinoic acid promotes neural and represses mesodermal gene expression in mouse embryonic stem cells in culture. Biochem Biophys Res Commun. 1996;223:691–694. doi: 10.1006/bbrc.1996.0957. - DOI - PubMed
    1. Brown RSH, Zhao C, Chase AR, Wang J, Schlieker C. The mechanism of Torsin ATPase activation. Proc Natl Acad Sci USA. 2014;111:E4822–31. doi: 10.1073/pnas.1415271111. - DOI - PMC - PubMed
    1. Burke RE, Fahn S, Gold AP. Delayed-onset dystonia in patients with “static” encephalopathy. J Neurol Neurosurg Psychiatr. 1980;43:789–797. - PMC - PubMed
    1. CLARK WH. Electron microscope studies of nuclear extrusions in pancreatic acinar cells of the rat. J Biophys Biochem Cytol. 1960;7:345–352. - PMC - PubMed