

Estimating National Trends in Inpatient Antibiotic Use Among US Hospitals From 2006 to 2012
- PMID: 27653796
- PMCID: PMC10863902
- DOI: 10.1001/jamainternmed.2016.5651
Estimating National Trends in Inpatient Antibiotic Use Among US Hospitals From 2006 to 2012
Abstract
Importance: The rising threat of antibiotic resistance and other adverse consequences resulting from the misuse of antibiotics requires a better understanding of antibiotic use in hospitals in the United States.
Objective: To use proprietary administrative data to estimate patterns of US inpatient antibiotic use in recent years.
Design, setting, and participants: For this retrospective analysis, adult and pediatric in-patient antibiotic use data was obtained from the Truven Health MarketScan Hospital Drug Database (HDD) from January 1, 2006, to December 31, 2012. Data from adult and pediatric patients admitted to 1 of approximately 300 participating acute care hospitals provided antibiotic use data for over 34 million discharges representing 166 million patient-days.
Main outcomes and measures: We retrospectively estimated the days of therapy (DOT) per 1000 patient-days and the proportion of hospital discharges in which a patient received at least 1 dose of an antibiotic during the hospital stay. We calculated measures of antibiotic usage stratified by antibiotic class, year, and other patient and facility characteristics. We used data submitted to the Centers for Medicare and Medicaid Services Healthcare Cost Report Information System to generate estimated weights to apply to the HDD data to create national estimates of antibiotic usage. A multivariate general estimating equation model to account for interhospital covariance was used to assess potential trends in antibiotic DOT over time.
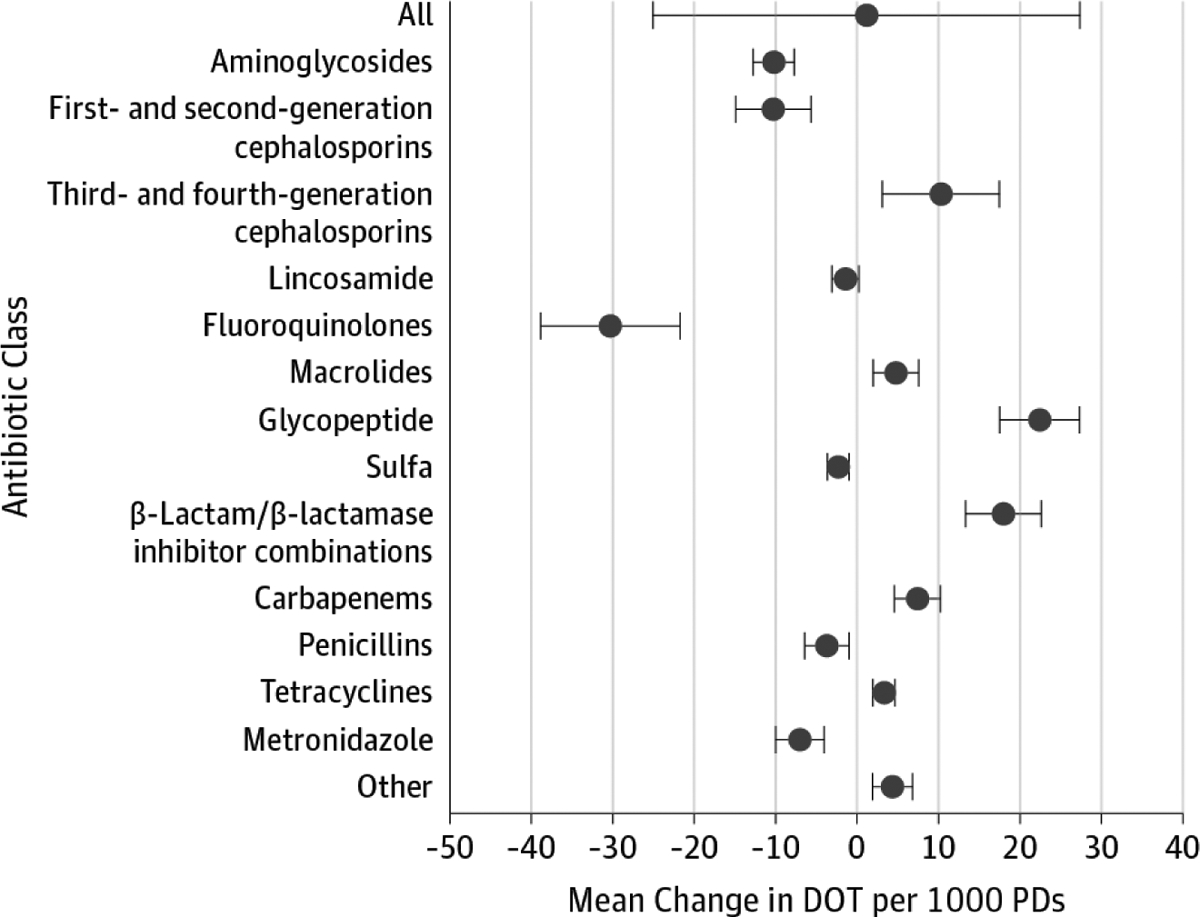
Results: During the years 2006 to 2012, 300 to 383 hospitals per year contributed antibiotic data to the HDD. Across all years, 55.1% of patients received at least 1 dose of antibiotics during their hospital visit. The overall national DOT was 755 per 1000 patient-days. Overall antibiotic use did not change significantly over time. The multivariable trend analysis of data from participating hospitals did not show a statistically significant change in overall use (total DOT increase, 5.6; 95% CI, -18.9 to 30.1; P = .65). However, the mean change (95% CI) for the following antibiotic classes increased significantly: third- and fourth-generation cephalosporins, 10.3 (3.1-17.5); macrolides, 4.8 (2.0-7.6); glycopeptides, 22.4 (17.5-27.3); β-lactam/β-lactamase inhibitor combinations, 18.0 (13.3-22.6); carbapenems, 7.4 (4.6-10.2); and tetracyclines, 3.3 (2.0-4.7).
Conclusions and relevance: Overall DOT of all antibiotics among hospitalized patients in US hospitals has not changed significantly in recent years. Use of some antibiotics, especially broad spectrum agents, however, has increased significantly. This trend is worrisome in light of the rising challenge of antibiotic resistance. Our findings can help inform national efforts to improve antibiotic use by suggesting key targets for improvement interventions.
Conflict of interest statement
Figures
Comment in
-
Tipping the Balance Toward Fewer Antibiotics.JAMA Intern Med. 2016 Nov 1;176(11):1649-1650. doi: 10.1001/jamainternmed.2016.6254. JAMA Intern Med. 2016. PMID: 27653497 No abstract available.
References
-
- Jacob JT, Gaynes RP. Emerging trends in antibiotic use in US hospitals: quality, quantification and stewardship. Expert Rev Anti Infect Ther. 2010; 8(8):893–902. - PubMed
-
- Centers for Disease Control and Prevention, US Department of Health and Human Services. Antibiotic resistance threats in the United States, 2013. http://www.cdc.gov/drugresistance/pdf/ar-threats-2013-508.pdf. Accessed August 11, 2016.
-
- The White House. National Strategy for Combating Antibiotic-Resistant Bacteria. https://www.whitehouse.gov/sites/default/files/docs/carb_national_strate.... Accessed August 11, 2016.
Publication types
MeSH terms
Substances
Grants and funding
LinkOut - more resources
Full Text Sources
Other Literature Sources
Medical
