

Natural genetic variation profoundly regulates gene expression in immune cells and dictates susceptibility to CNS autoimmunity
- PMID: 27653816
- PMCID: PMC5133152
- DOI: 10.1038/gene.2016.37
Natural genetic variation profoundly regulates gene expression in immune cells and dictates susceptibility to CNS autoimmunity
Abstract
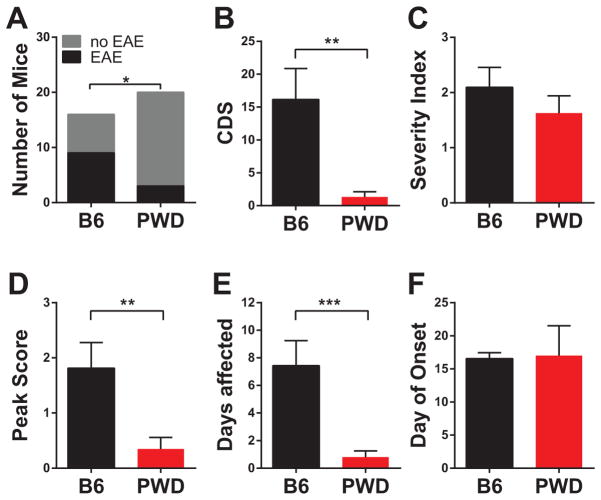
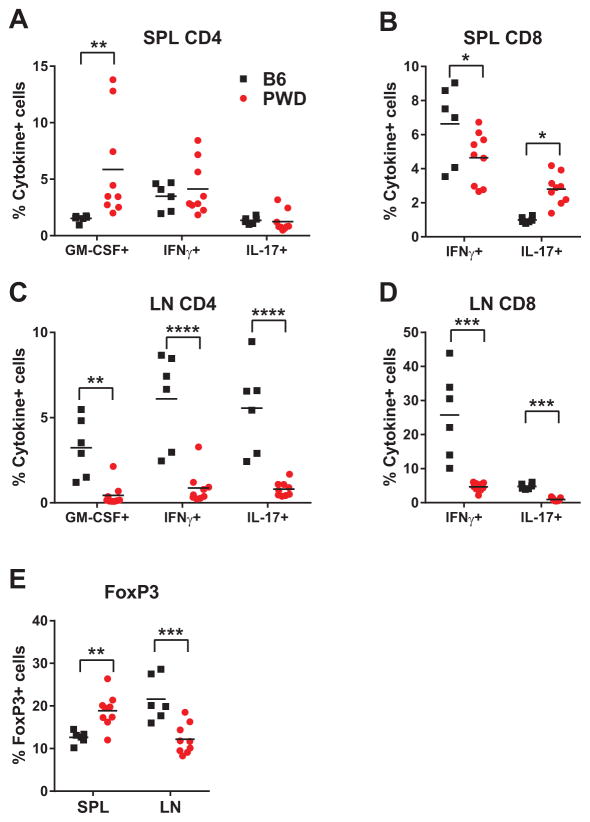
Regulation of gene expression in immune cells is known to be under genetic control, and likely contributes to susceptibility to autoimmune diseases such as multiple sclerosis (MS). How this occurs in concert across multiple immune cell types is poorly understood. Using a mouse model that harnesses the genetic diversity of wild-derived mice, more accurately reflecting genetically diverse human populations, we provide an extensive characterization of the genetic regulation of gene expression in five different naive immune cell types relevant to MS. The immune cell transcriptome is shown to be under profound genetic control, exhibiting diverse patterns: global, cell-specific and sex-specific. Bioinformatic analysis of the genetically controlled transcript networks reveals reduced cell type specificity and inflammatory activity in wild-derived PWD/PhJ mice, compared with the conventional laboratory strain C57BL/6J. Additionally, candidate MS-GWAS (genome-wide association study candidate genes for MS susceptibility) genes were significantly enriched among transcripts overrepresented in C57BL/6J cells compared with PWD. These expression level differences correlate with robust differences in susceptibility to experimental autoimmune encephalomyelitis, the principal model of MS, and skewing of the encephalitogenic T-cell responses. Taken together, our results provide functional insights into the genetic regulation of the immune transcriptome, and shed light on how this in turn contributes to susceptibility to autoimmune disease.
Conflict of interest statement
The authors declare no conflicts of interest.
Figures


Similar articles
-
Identification of genetic determinants of the sexual dimorphism in CNS autoimmunity.PLoS One. 2015 Feb 11;10(2):e0117993. doi: 10.1371/journal.pone.0117993. eCollection 2015. PLoS One. 2015. PMID: 25671658 Free PMC article.
-
Interactions between host genetics and gut microbiota determine susceptibility to CNS autoimmunity.Proc Natl Acad Sci U S A. 2020 Nov 3;117(44):27516-27527. doi: 10.1073/pnas.2002817117. Epub 2020 Oct 19. Proc Natl Acad Sci U S A. 2020. PMID: 33077601 Free PMC article.
-
Sex- and species-specific contribution of CD99 to T cell costimulation during multiple sclerosis.Biol Sex Differ. 2024 May 15;15(1):41. doi: 10.1186/s13293-024-00618-y. Biol Sex Differ. 2024. PMID: 38750588 Free PMC article.
-
The immune-modulatory role of apolipoprotein E with emphasis on multiple sclerosis and experimental autoimmune encephalomyelitis.Clin Dev Immunol. 2010;2010:186813. doi: 10.1155/2010/186813. Epub 2010 May 31. Clin Dev Immunol. 2010. PMID: 20613949 Free PMC article. Review.
-
Deubiquitinating enzymes (DUBs): DoUBle-edged swords in CNS autoimmunity.J Neuroinflammation. 2020 Apr 6;17(1):102. doi: 10.1186/s12974-020-01783-8. J Neuroinflammation. 2020. PMID: 32248814 Free PMC article. Review.
Cited by
-
Lipocalin 10 as a New Prognostic Biomarker in Sepsis-Induced Myocardial Dysfunction and Mortality: A Pilot Study.Mediators Inflamm. 2021 May 22;2021:6616270. doi: 10.1155/2021/6616270. eCollection 2021. Mediators Inflamm. 2021. PMID: 34121925 Free PMC article.
-
Identification of novel loci controlling inflammatory bowel disease susceptibility utilizing the genetic diversity of wild-derived mice.Genes Immun. 2020 Nov;21(5):311-325. doi: 10.1038/s41435-020-00110-8. Epub 2020 Aug 26. Genes Immun. 2020. PMID: 32848229 Free PMC article.
-
Sex-Specific Gene-by-Vitamin D Interactions Regulate Susceptibility to Central Nervous System Autoimmunity.Front Immunol. 2018 Jul 17;9:1622. doi: 10.3389/fimmu.2018.01622. eCollection 2018. Front Immunol. 2018. PMID: 30065723 Free PMC article.
-
Burkholderia pseudomallei invades the olfactory nerve and bulb after epithelial injury in mice and causes the formation of multinucleated giant glial cells in vitro.PLoS Negl Trop Dis. 2020 Jan 24;14(1):e0008017. doi: 10.1371/journal.pntd.0008017. eCollection 2020 Jan. PLoS Negl Trop Dis. 2020. PMID: 31978058 Free PMC article.
-
A genetic locus complements resistance to Bordetella pertussis-induced histamine sensitization.Commun Biol. 2023 Mar 6;6(1):244. doi: 10.1038/s42003-023-04603-w. Commun Biol. 2023. PMID: 36879097 Free PMC article.
References
-
- Smolen JS, Aletaha D, McInnes IB. Rheumatoid arthritis. Lancet. 2016 - PubMed
-
- Uramoto KM, Michet CJ, Jr, Thumboo J, Sunku J, O’Fallon WM, Gabriel SE. Trends in the incidence and mortality of systemic lupus erythematosus, 1950–1992. Arthritis Rheum. 1999;42(1):46–50. - PubMed
-
- The Cost Burden of Autoimmune Disease: The Latest Front in the War on Healthcare Spending. American Autoimmune Related Diseases Association (AARDA) National Coalition of Autoimmune Patient Groups (NCAPG); 2011.
MeSH terms
Grants and funding
LinkOut - more resources
Full Text Sources
Other Literature Sources
Medical
Molecular Biology Databases
