

Human and server docking prediction for CAPRI round 30-35 using LZerD with combined scoring functions
- PMID: 27654025
- PMCID: PMC5313330
- DOI: 10.1002/prot.25165
Human and server docking prediction for CAPRI round 30-35 using LZerD with combined scoring functions
Abstract
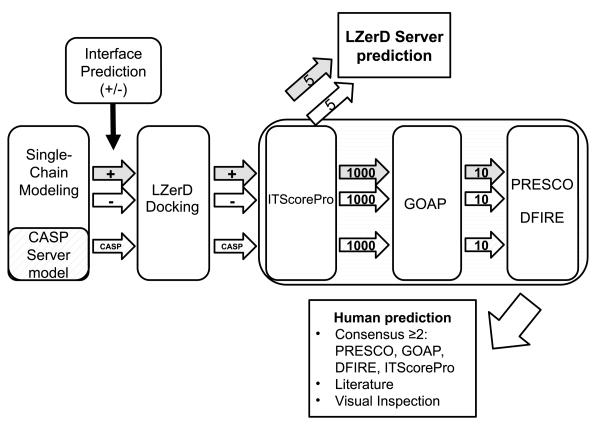
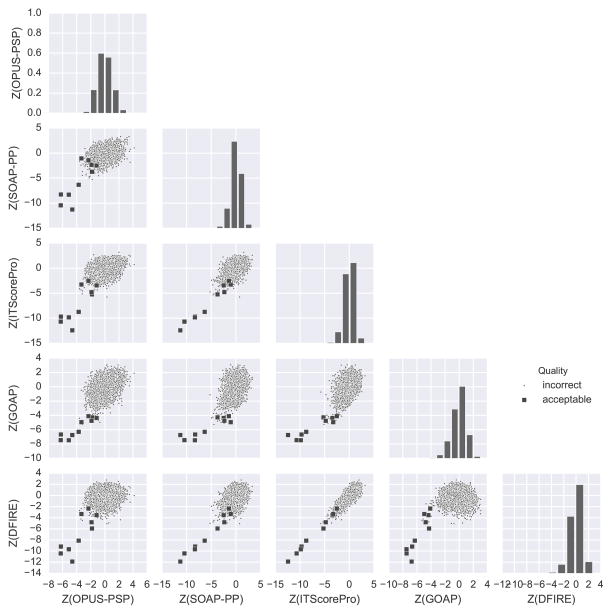
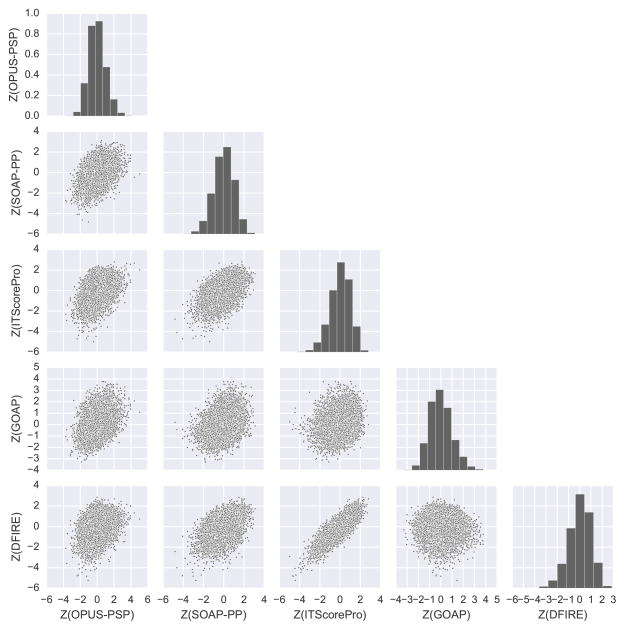
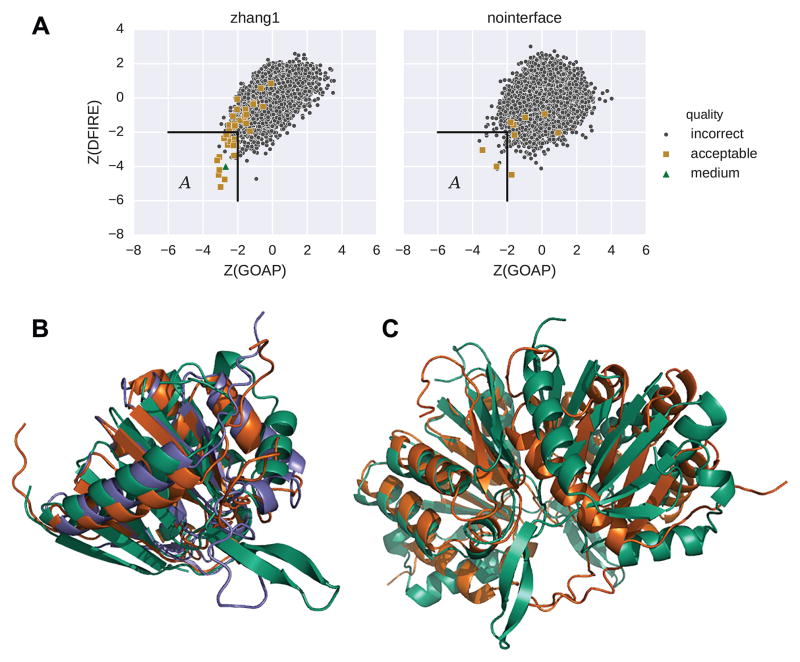
We report the performance of protein-protein docking predictions by our group for recent rounds of the Critical Assessment of Prediction of Interactions (CAPRI), a community-wide assessment of state-of-the-art docking methods. Our prediction procedure uses a protein-protein docking program named LZerD developed in our group. LZerD represents a protein surface with 3D Zernike descriptors (3DZD), which are based on a mathematical series expansion of a 3D function. The appropriate soft representation of protein surface with 3DZD makes the method more tolerant to conformational change of proteins upon docking, which adds an advantage for unbound docking. Docking was guided by interface residue prediction performed with BindML and cons-PPISP as well as literature information when available. The generated docking models were ranked by a combination of scoring functions, including PRESCO, which evaluates the native-likeness of residues' spatial environments in structure models. First, we discuss the overall performance of our group in the CAPRI prediction rounds and investigate the reasons for unsuccessful cases. Then, we examine the performance of several knowledge-based scoring functions and their combinations for ranking docking models. It was found that the quality of a pool of docking models generated by LZerD, that is whether or not the pool includes near-native models, can be predicted by the correlation of multiple scores. Although the current analysis used docking models generated by LZerD, findings on scoring functions are expected to be universally applicable to other docking methods. Proteins 2017; 85:513-527. © 2016 Wiley Periodicals, Inc.
Keywords: CAPRI; computational methods; prediction accuracy; protein docking prediction; protein structure prediction; protein-protein docking; structure modeling.
© 2016 Wiley Periodicals, Inc.
Figures
Similar articles
-
What method to use for protein-protein docking?Curr Opin Struct Biol. 2019 Apr;55:1-7. doi: 10.1016/j.sbi.2018.12.010. Epub 2019 Feb 1. Curr Opin Struct Biol. 2019. PMID: 30711743 Free PMC article. Review.
-
Improved performance in CAPRI round 37 using LZerD docking and template-based modeling with combined scoring functions.Proteins. 2018 Mar;86 Suppl 1(Suppl 1):311-320. doi: 10.1002/prot.25376. Epub 2017 Sep 11. Proteins. 2018. PMID: 28845596 Free PMC article.
-
Performance of MDockPP in CAPRI rounds 28-29 and 31-35 including the prediction of water-mediated interactions.Proteins. 2017 Mar;85(3):424-434. doi: 10.1002/prot.25203. Epub 2016 Dec 2. Proteins. 2017. PMID: 27802576 Free PMC article.
-
Performance and enhancement of the LZerD protein assembly pipeline in CAPRI 38-46.Proteins. 2020 Aug;88(8):948-961. doi: 10.1002/prot.25850. Epub 2019 Nov 25. Proteins. 2020. PMID: 31697428 Free PMC article.
-
Assessment of Protein-Protein Docking Models Using Deep Learning.Methods Mol Biol. 2024;2780:149-162. doi: 10.1007/978-1-0716-3985-6_10. Methods Mol Biol. 2024. PMID: 38987469 Review.
Cited by
-
Modeling protein-nucleic acid complexes with extremely large conformational changes using Flex-LZerD.Proteomics. 2023 Sep;23(17):e2200322. doi: 10.1002/pmic.202200322. Epub 2022 Dec 25. Proteomics. 2023. PMID: 36529945 Free PMC article.
-
Assembly of Protein Complexes In and On the Membrane with Predicted Spatial Arrangement Constraints.bioRxiv [Preprint]. 2023 Nov 9:2023.10.20.563303. doi: 10.1101/2023.10.20.563303. bioRxiv. 2023. Update in: J Mol Biol. 2024 Mar 15;436(6):168486. doi: 10.1016/j.jmb.2024.168486. PMID: 37961264 Free PMC article. Updated. Preprint.
-
Integrative Protein Assembly With LZerD and Deep Learning in CAPRI 47-55.Proteins. 2025 Mar 17:10.1002/prot.26818. doi: 10.1002/prot.26818. Online ahead of print. Proteins. 2025. PMID: 40095385
-
Performance and Its Limits in Rigid Body Protein-Protein Docking.Structure. 2020 Sep 1;28(9):1071-1081.e3. doi: 10.1016/j.str.2020.06.006. Epub 2020 Jul 9. Structure. 2020. PMID: 32649857 Free PMC article.
-
What method to use for protein-protein docking?Curr Opin Struct Biol. 2019 Apr;55:1-7. doi: 10.1016/j.sbi.2018.12.010. Epub 2019 Feb 1. Curr Opin Struct Biol. 2019. PMID: 30711743 Free PMC article. Review.
References
-
- Kihara D, Skolnick J. Microbial genomes have over 72threading algorithm PROSPECTOR_Q. Proteins: Struct, Funct, Bioinf. 2004;55:464–473. - PubMed
-
- Gonen S, DiMaio F, Gonen T, Baker D. Design of ordered two-dimensional arrays mediated by noncovalent protein-protein interfaces. Science. 2015;348:1365–8. - PubMed
Publication types
MeSH terms
Substances
Grants and funding
LinkOut - more resources
Full Text Sources
Other Literature Sources
