. 2016 Sep 1;57(11):4886-4897.
doi: 10.1167/iovs.16-19395.

Postnatal Chick Choroids Exhibit Increased Retinaldehyde Dehydrogenase Activity During Recovery From Form Deprivation Induced Myopia

Affiliations

Postnatal Chick Choroids Exhibit Increased Retinaldehyde Dehydrogenase Activity During Recovery From Form Deprivation Induced Myopia

Angelica R Harper et al. Invest Ophthalmol Vis Sci. .

Abstract

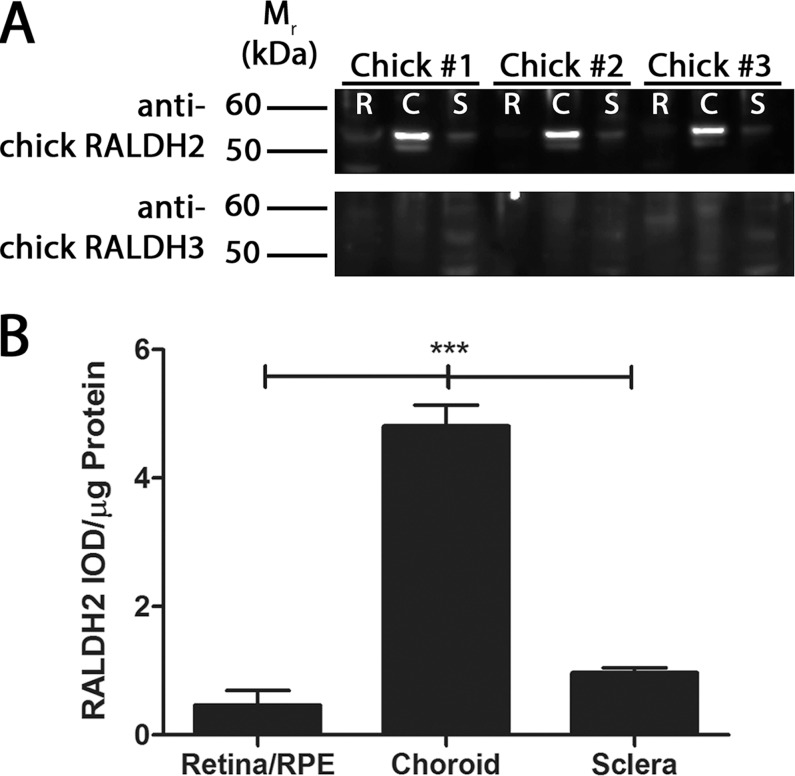
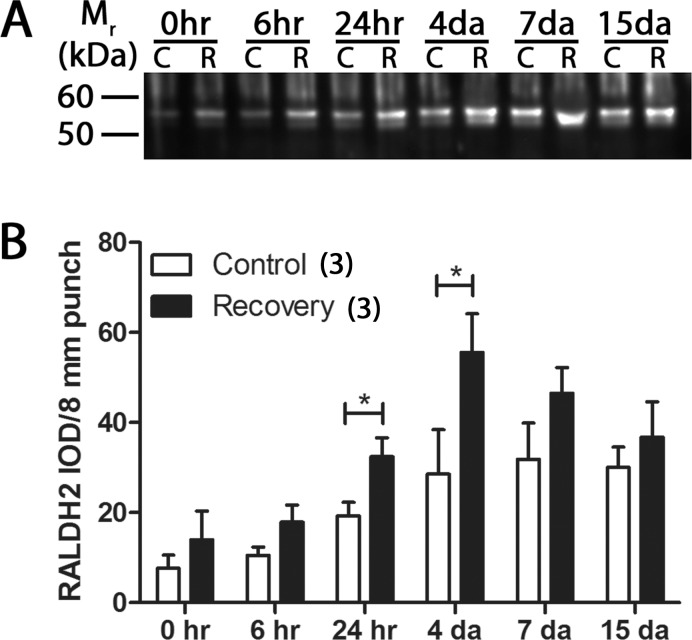
Purpose: Increases in retinaldehyde dehydrogenase 2 (RALDH2) transcript in the chick choroid suggest that RALDH2 may be responsible for increases observed in all-trans-retinoic acid (atRA) synthesis during recovery from myopic defocus. The purpose of the present study was to examine RALDH2 protein expression, RALDH activity, and distribution of RALDH2 cells in control and recovering chick ocular tissues.

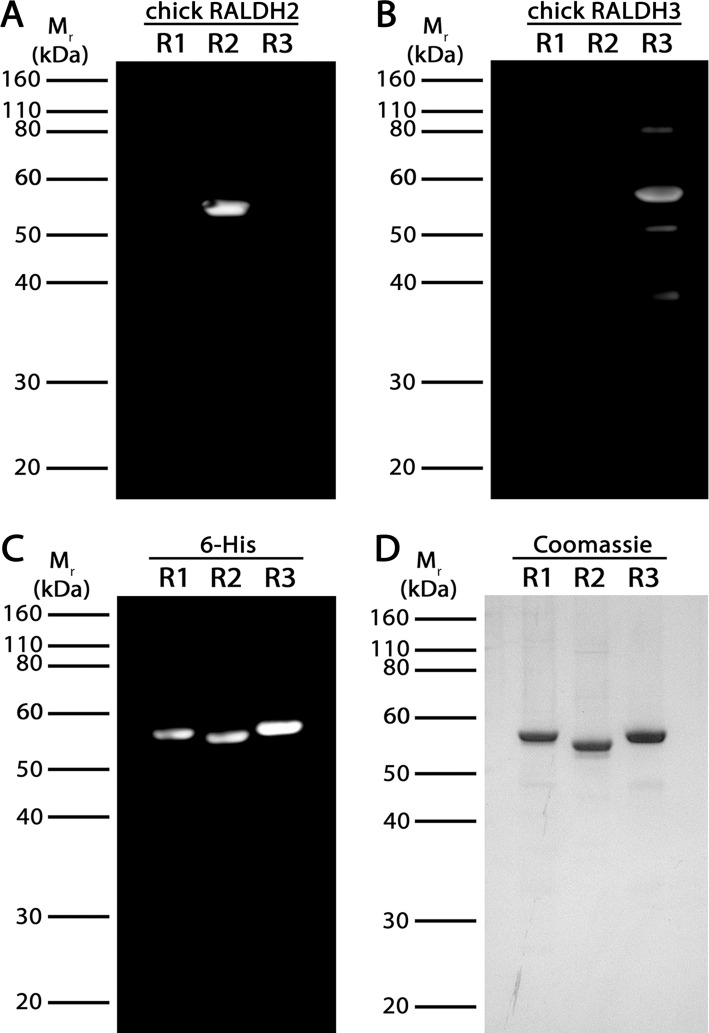
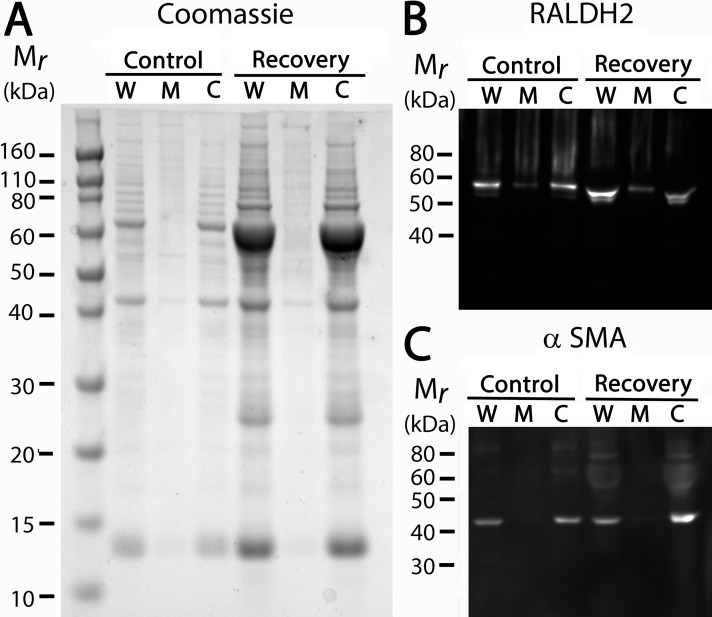
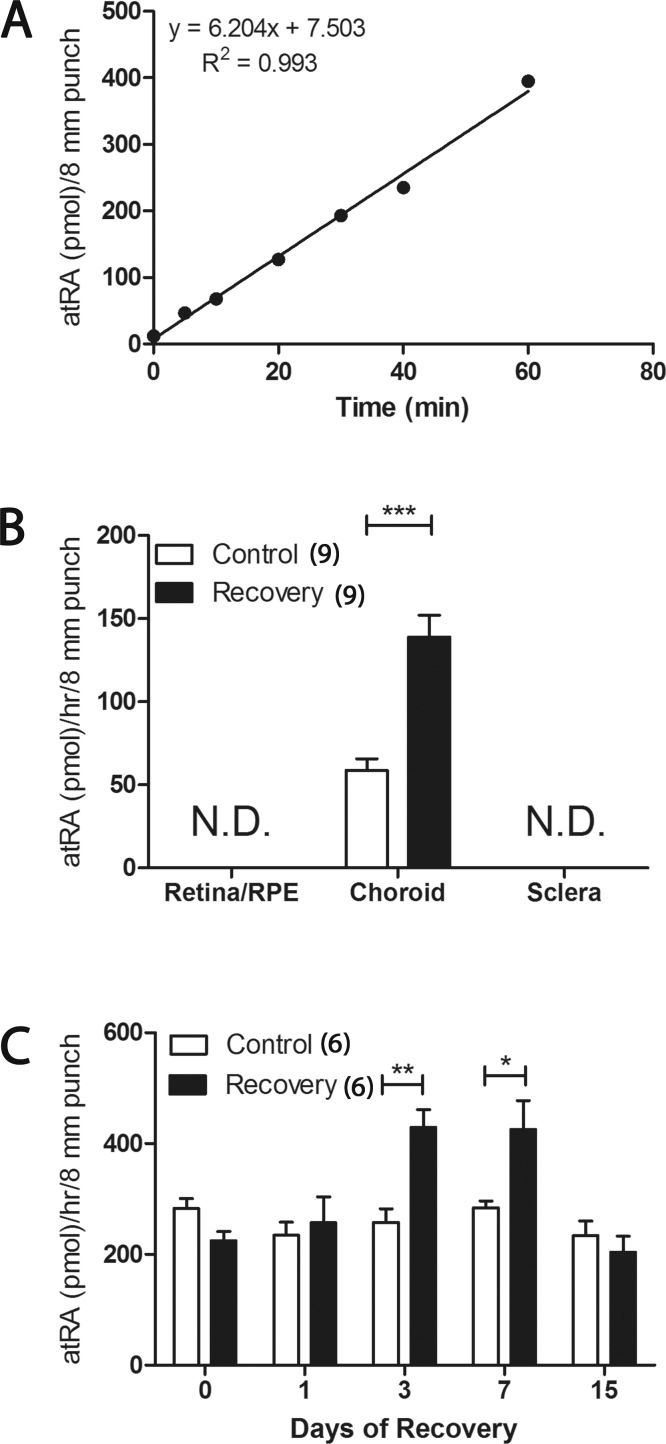
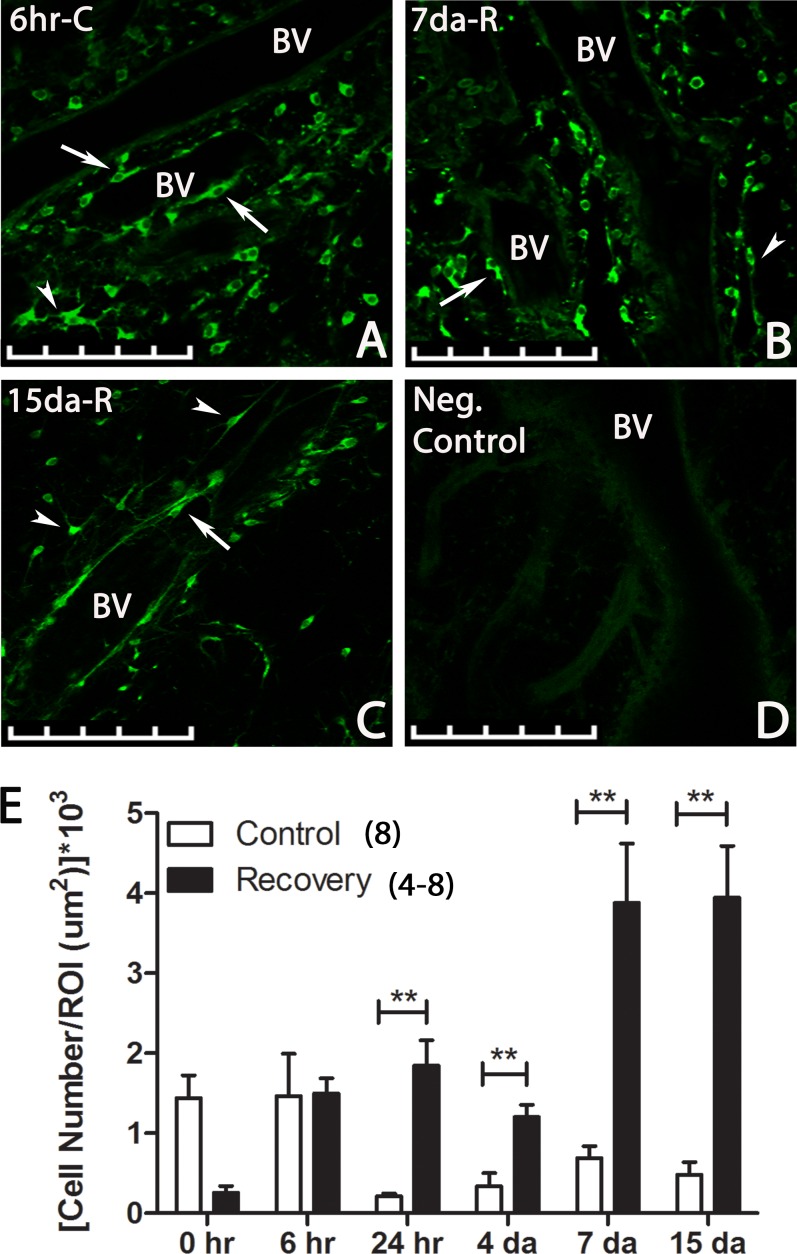
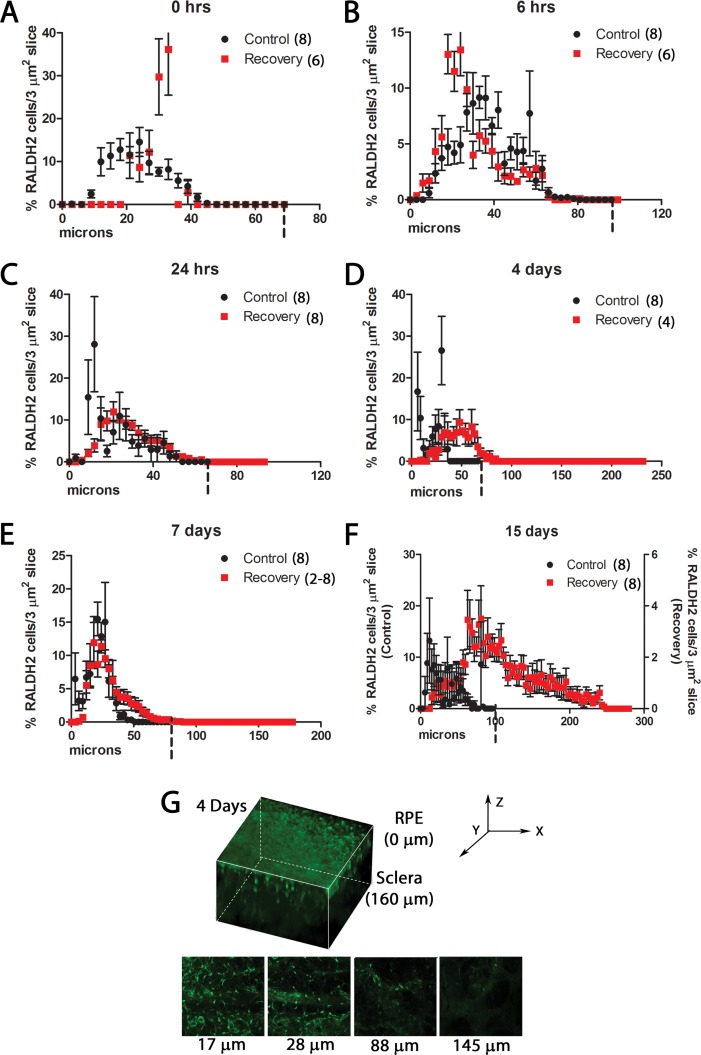
Methods: Myopia was induced in White Leghorn chicks for 10 days, followed by up to 15 days of unrestricted vision (recovery). Expression of RALDH isoforms in chick ocular tissues was evaluated by Western blot. Catalytic activity of RALDH was measured in choroidal cytosol fractions using an in vitro atRA synthesis assay together with HPLC quantification of synthesized atRA. Distribution of RALDH2 cells throughout the choroid was evaluated by immunohistochemistry.

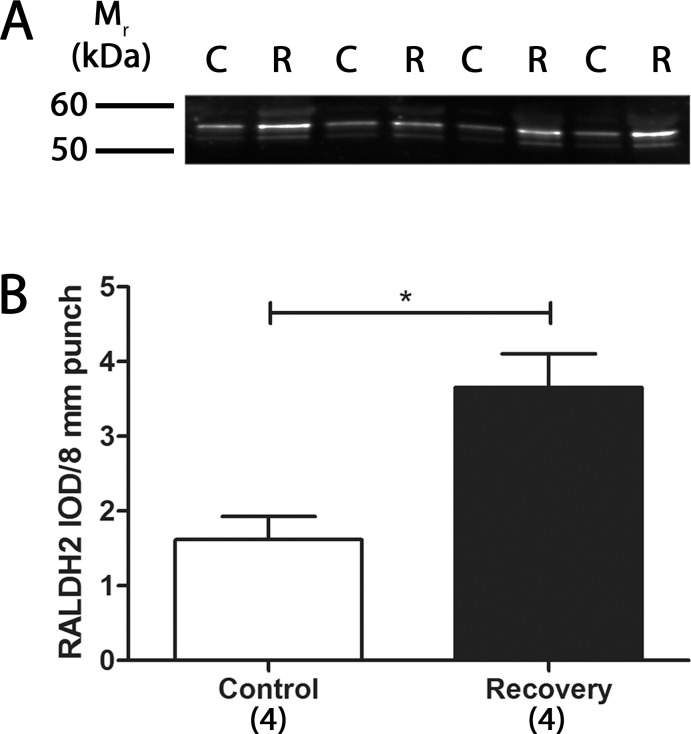
Results: RALDH2 was expressed predominately in the chick choroid (P < 0.001) and increased after 24 hours and 4 days of recovery (76%, 74%, and 165%, respectively; P < 0.05). Activity of RALDH was detected solely in the choroid and was elevated at 3 and 7 days of recovery compared to controls (70% and 48%, respectively; P < 0.05). The number of RALDH2 immunopositive cells in recovering choroids was increased at 24 hours and 4 to 15 days of recovery (P < 0.05) and were concentrated toward the RPE side compared to controls.

Conclusions: The results of this study suggest that RALDH2 is the major RALDH isoform in the chick choroid and is responsible for the increased RALDH activity seen during recovery.


Figures

Figure 1
Figure 1
Western blot and SDS-PAGE analysis of recombinant chick RALDH1, 2, and 3. (AC) Recombinant RALDH1, 2, and 3 (500 ng) were immunoblotted with anti-chick RALDH2 (A), anti-chick RALDH3 (B), or anti-6His (C). (D) 500 ng of purified, recombinant RALDH1 (R1), RALDH2 (R2), and RALDH3 (R3) were run on a 1.0 mm 10% Bis/Tris gel. RALDH1, 2, and 3 (∼55–57 kDa) were greater than 90% pure, as determined by Coomassie Blue staining.
Figure 2
Figure 2
SDS-PAGE gel and Western blot analysis of choroidal RALDH2 and α-smooth muscle actin (αSMA) in various cellular fractions. (A) Whole tissue homogenates (W), microsomal fractions (M), and cytosol fractions (C) of control and 4-day recovering choroids were run on a 1.0 mm 10% Bis/Tris gel. (B, C) Identical gels were immunoblotted with anti-chick RALDH2 or anti-αSMA. RALDH2 immunopositive bands (∼55–57 kDa) were detected strongly in the whole tissue homogenates and cytosol fractions of chick choroidal tissue, with faint detection in the microsomal fractions, while α-smooth muscle actin was detected solely in the whole tissue homogenates and cytosol fractions. A 10 μL amount of each sample was loaded per gel.
Figure 3
Figure 3
Western blot analysis and quantification of RALDH2 and RALDH3 in chick ocular tissues. (A) Cytosol fractions from chick ocular tissues were immunoblotted with anti-chick RALDH2 or anti-chick RALDH3. Top: RALDH2 immunopositive bands (∼55 kDa) were present in choroid (C) of chick eyes and barely detectible in the retina/RPE (R) and sclera (S). Bottom: RALDH3 was not detected in any of the ocular tissues. Three μg total protein/lane was loaded for each blot. (B) Average abundance of RALDH2 (± SEM) in chick ocular tissues was measured as the integrated optical density (IOD) per μg protein of RALDH2-immunopositive bands (n = 3). ***P < 0.001 (1-way ANOVA followed by Bonferroni's multiple comparison test).
Figure 4
Figure 4
Western blot analysis and quantification of RALDH2 in control and 4-day recovering choroids. (A) Cytosol fractions from control (C) and day 4 recovering (R) choroids were immunoblotted with anti-chick RALDH2. RALDH2 immunopositive bands (∼55 kDa) were present in control and recovering choroids. (B) Average RALDH2 abundance (± SEM) in control and day 4 recovering choroids was measured as the IOD per 8-mm biopsy punch (n = 4). *P < 0.05 (paired t-test).
Figure 5
Figure 5
Western blot analysis and quantification of RALDH2 in choroids over a 15-day recovery period. (A) Cytosol fractions from control (C) and recovering (R) choroids were immunoblotted with anti-chick RALDH2 at various time points during the course of recovery. RALDH2 immunopositive bands (∼55 kDa) were present in control and recovering choroids at all time points examined. Blot shown is representative of 3 independent blots. (B) Average RALDH2 abundance (± SEM) in control and recovering choroids was measured as the IOD per 8 mm biopsy punch (n = 3 for each time point). *P < 0.05 (Wilcoxon matched-pairs signed rank test).
Figure 6
Figure 6
RALDH enzymatic activity in control and recovering chick ocular tissues using a HPLC/spectrophotometric assay for NAD-dependent atRA synthesis. (A) atRA synthesis is linear in untreated choroidal lysates from 0 to 60 minutes. All subsequent synthesis assays were conducted for 30 minutes. (B) Average RALDH enzymatic activity (± SEM) in chick ocular tissues in control and day 4 recovering eyes (n = 9). Activity was not detectible (N.D.) in the retina/RPE or sclera. (C) Average RALDH enzymatic activity (± SEM) in control and recovering choroids at various time points during the course of recovery (n = 6 measurements for each time point). Each activity measurement represents the average of two duplicate samples. *P < 0.05, **P < 0.01, ***P < 0.001 (paired t-test).
Figure 7
Figure 7
Multiphoton images and quantification of RALDH2 expressing cells (green) in control and recovering choroids after immunolabeling with the anti-chick RALDH2 antibody. (AC) Images of representative RALDH2 immunopositive cells in choroids throughout recovery. RALDH2 labeling was detected in round or spindle-shaped cell bodies with some cells exhibiting long, thin projections (arrowhead). Some choroidal stromal cells were located in close association with blood vessels (arrow). BV, blood vessel; 6hr-C, 6-hour control; 7da-R, 7-day recovery; 15da-R; 15-day recovery. (D) Negative control choroid (incubation in preimmune rabbit serum instead of primary antibody) demonstrating absence of labeling in the tissue. Scale bars: 100 μm in (AD). (E) Average total RALDH2 cell number (± SEM) in control and recovering choroids (30–300 μm thick z-stacks) at various time points throughout recovery. Results were normalized to cross-sectional area for each ROI selected to perform the counting (n = 4–8). **P < 0.01 (paired t-test).
Figure 8
Figure 8
Distribution of RALDH2 immunopositive cells throughout the thickness of control and recovering choroids. (AF) Percentage of RALDH2 cells located in each 3 μm2 slice of z-stack images obtained in Figure 7 in control (black) and recovering (red) choroids at various time points throughout recovery (n = 2–8 regions per cross sectional area). The side of the choroid closest to Bruch's membrane was designated at 0 μm. Dashed vertical bars on x-axis represent total thickness of control choroids (which were substantially thinner than recovering choroids following 24 hours of recovery). *(F) Data from 15-day recovering choroids is plotted on an expanded y-axis to demonstrate relative RALDH2 distribution across choroid. (G) 3D reconstruction of a z-stack obtained by multiphoton from a 4-day recovering choroid. RALDH2 immunopositive cells (green) are found closer to the RPE side of the choroid (0 μm) than to the scleral side of the choroid (160 μm). Single images represent single slices taken throughout the thickness of the choroid. Micrometers under all images indicate distance from the scleral side of the choroid.

References

    1. O'Leary DJ,, Millodot M. Eyelid closure causes myopia in humans. Experientia. 1979; 35: 1478–1479. - PubMed
    1. Rabin J,, Van Sluyters RC,, Malach R. Emmetropization: a vision-dependent phenomenon. Invest Ophthalmol Vis Sci. 1981; 20: 561–564. - PubMed
    1. Rasooly R,, BenEzra D. Congenital and traumatic cataract. The effect on ocular axial length. Arch Ophthalmol. 1988; 106: 1066–1068. - PubMed
    1. Twomey JM,, Gilvarry A,, Restori M,, Kirkness CM,, Moore AT,, Holden AL. Ocular enlargement following infantile corneal opacification. Eye (Lond). 1990; 4: 497–503. - PubMed
    1. Norton TT,, Rada JA. Reduced extracellular matrix in mammalian sclera with induced myopia. Vision Res. 1995; 35: 1271–1281. - PubMed

LinkOut - more resources