. 2016 Sep 1;57(11):4898-4909.
doi: 10.1167/iovs.16-19212.

Lack of R-Ras Leads to Increased Vascular Permeability in Ischemic Retinopathy

Affiliations

Lack of R-Ras Leads to Increased Vascular Permeability in Ischemic Retinopathy

Maria Vähätupa et al. Invest Ophthalmol Vis Sci. .

Abstract

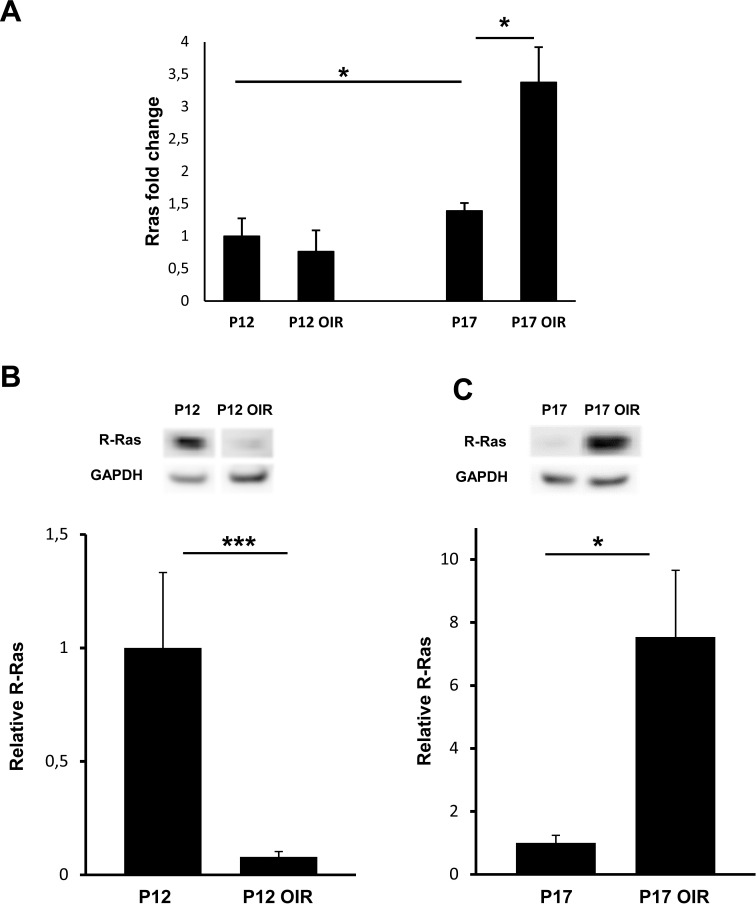
Purpose: The role of R-Ras in retinal angiogenesis and vascular permeability was evaluated in an oxygen-induced retinopathy (OIR) model using R-Ras knockout (KO) mice and in human diabetic neovascular membranes.

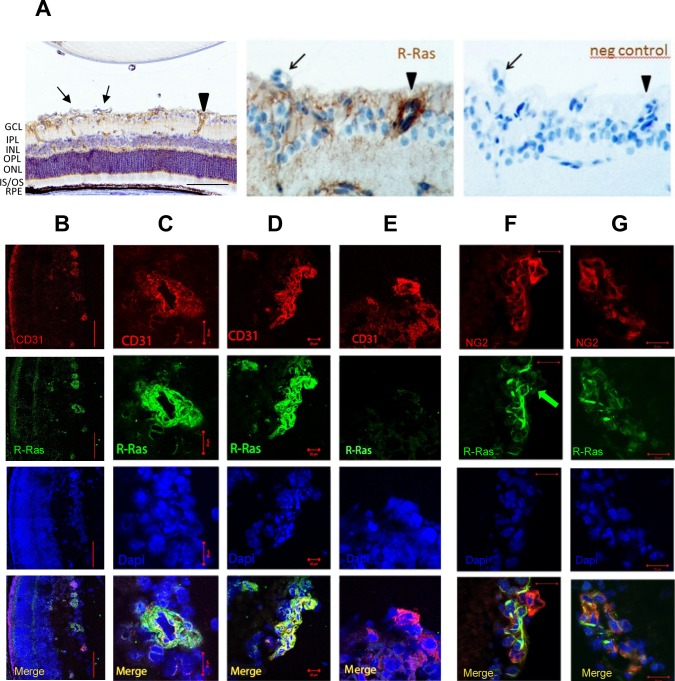
Methods: Mice deficient for R-Ras and their wild-type (WT) littermates were subjected to 75% oxygen from postnatal day 7 (P7) to P12 and then returned to room air. At P17 retinal vascularization was examined from whole mounts, and retinal vascular permeability was studied using Miles assay. Real-time RT-PCR, Western blotting, and immunohistochemistry were used to assess the expression of R-Ras in retina during development or in the OIR model. The degree of pericyte coverage and vascular endothelial (VE)-cadherin expression on WT and R-Ras KO retinal blood vessels was quantified using confocal microscopy. The correlation of R-Ras with vascular endothelial growth factor receptor 2 (VEGFR2) and human serum albumin on human proliferative diabetic retinopathy membranes was assessed using immunohistochemistry.

Results: In retina, R-Ras expression was mostly restricted to the vasculature. Retinal vessels in the R-Ras KO mice were significantly more permeable than WT controls in the OIR model. A significant reduction in the direct physical contact between pericytes and blood vessel endothelium as well as reduced VE-cadherin immunostaining was found in R-Ras-deficient mice. In human proliferative diabetic retinopathy neovascular membranes, R-Ras expression negatively correlated with increased vascular leakage and expression of VEGFR2, a marker of blood vessel immaturity.

Conclusions: Our results suggest that R-Ras has a role in controlling retinal vessel maturation and stabilization in ischemic retinopathy and provides a potential target for pharmacologic manipulation to treat diabetic retinopathy.


Figures

Figure 1
Figure 1
Hypoxia-driven R-Ras expression in the OIR model. Hypoxia-induced angiogenesis in retina was studied with the OIR model. Retinas were harvested immediately after the exposure to hyperoxia (P12) and after hypoxia-driven pathologic angiogenesis has reached its maximum at P17. Retinas from normal mice were harvested at corresponding time points. Retinas were subjected to either quantitative mRNA (real-time qPCR) analysis using SYBR Green method or protein (Western blotting) analysis. For immunoblotting, retinal protein supernatants were electrophoresed on gradient gels, standard Western blotting was carried out with R-Ras–specific antibody, and GAPDH detection was used as a loading control. (A) The graph represents fold changes (2−ΔΔCt method) in the Rras mRNA expression level relative to the Rras mRNA expression level of normal mice at P12. The level of Rras mRNA expression between normal and OIR model retinas is equal at P12, whereas at P17 hypoxia leads to 2.5-fold upregulation of Rras mRNA (P = 0.016, * nonparametric Mann-Whitney U test). Error bars represent the minimum and maximum of the fold change. (P12, P17 OIR: n = 4; P17, P12 OIR: n = 5.) (B, C) The level of R-Ras protein expression was quantified by densitometric analysis of immunoblotted protein. R-Ras protein level at P17 shows a 7.5-fold increase (P = 0.016) during hypoxia-induced angiogenesis. Error bars represent ± 95% confidence intervals. (P12: n = 6; P12 OIR: n = 7; P17: n = 5; P17: n = 5.) The results are analyzed with nonparametric Mann-Whitney U test. The samples presented above were run on the same gel. Representative samples were cropped and presented side-by-side.
Figure 2
Figure 2
R-Ras is strongly, but selectively expressed in the endothelial cells and pericytes of blood vessels in retina. Oxygen-induced retinopathy was induced by exposing WT pups to 75% oxygen at P7 for 5 days and returning them to normal room air at P12. After 5 days in normoxia (at P17), the R-Ras expression was determined from the revascularized retinas by IHC and immunofluorescence (IF) using R-Ras–specific primary antibody. (A) Representative images of R-Ras expression in the OIR model. More than 30% of the preretinal blood vessels are negative for R-Ras (arrow), whereas blood vessels in retina are R-Ras positive (arrowhead). Right, negative control (no primary antibody). There is also faint R-Ras expression from other retinal cells, presumably from neural cells in the retina. GCL, ganglion cell layer; IPL, inner plexiform layer; INL, inner nuclear layer, OPL, outer plexiform layer; ONL, outer nuclear layer; IS/OS, photoreceptor inner/outer segments; RPE, retinal pigment epithelium. (B–E) Representative confocal images showing the colocalization of R-Ras (green) and CD31 (red) in the retina of frozen sections after immunofluorescence staining. (C) R-Ras is expressed in the endothelial cells in the retina and (D) also in the preretinal blood vessels. (E) Some of the preretinal blood vessels are negative for R-Ras. (F) R-Ras is expressed in the pericytes (NG2, red) in the retina. Some pericytes of preretinal blood vessels are negative for R-Ras in OIR (arrow), but (G) R-Ras is also expressed in the pericytes of preretinal neovessels. Scale bars: 100 μm (A, B), 20 μm (CG).
Figure 3
Figure 3
Neither revascularization nor pathologic neovascularization is affected by R-Ras deficiency in the OIR model. Wild-type and R-Ras KO mice pups were exposed to hyperoxia as previously described, and retinas were harvested at P17. Areas of vascular obliteration and pathologic neovascularization (meaning neovascular tufts) were quantified from Isolectin IB4–stained whole mounts using Adobe Photoshop CS3. (A) Representative retinas of WT and R-Ras KO mice at P17. The revascularization rate was determined by quantifying the avascular areas (yellow) in retinal flat mounts. The amount of pathologic neovascularization (tufts, red) was also determined. (B) Summary of quantitative analysis of vascular obliteration (yellow) and neovascularization (red). The avascular and pathologic neovascularization areas were measured, and results are represented as an area relative to WT area. Error bars represent ± 95% confidence intervals. (WT: n = 63, KO: n = 48 retinas.)
Figure 4
Figure 4
R-Ras deficiency increases vessel permeability in mouse OIR model. Wild-type and R-Ras KO mice pups were exposed to hyperoxia as described previously. The EB dye was injected IP, and retinas and blood samples were harvested after 1 hour and 24 hours at P17. Evans Blue concentrations were measured spectrophotometrically at 620 nm, and EB concentration for each sample was calculated from a standard curve. Results are expressed as relative to EB concentration in the plasma. (A) Representative R-Ras KO and WT OIR retinas after systemic injection of EB dye. In many of the R-Ras KO retinas, EB dye was visible, whereas most of the WT retinas were colorless. (B) Statistical analysis of a representative experiment shows a significant increase in vascular leakage in R-Ras KO OIR retinas compared to WT OIR retinas already at a 1-hour time point (P = 0.0223, *, nonparametric Mann-Whitney U test, WT n = 6, R-Ras KO n = 8). (C) There is a highly significant difference in vascular leakage between R-Ras KO and WT mice at the 24-hour time point (P = 0.0006, ***, nonparametric Mann-Whitney U test; WT n = 20, R-Ras KO n = 18). Error bars represent SEM. To assess the IgG protein accumulation, OIR retinas were harvested at P17, proteins were extracted and samples were electrophoresed on gradient gels, and Western blotting was done using anti-mouse IgG antibody. (D) Representative images of immunoblotting from where mouse IgG heavy chain densities were quantified and normalized against GAPDH. Relative comparison of IgG heavy chain protein from WT OIR and R-Ras KO OIR samples gives a 3.5-fold difference (P = 0,0007, ***, nonparametric Mann-Whitney U test). There is no difference in the IgG protein level between healthy WT and KO mice at P17 (P = 0.7879). Error bars represent ± 95% confidence intervals. (WT: n = 6, KO: n = 6, WT OIR: n = 14, KO OIR: n = 16.)
Figure 5
Figure 5
Pericyte coverage and VE-cadherin expression is reduced in R-Ras KO in the OIR model in angiogenic retinal blood vessels. Oxygen-induced retinopathy was induced in WT and R-Ras KO mice as described previously. Retinas were harvested at P17, and whole-mount retinas were double-stained with Alexa Fluor–conjugated Isolectin IB4 and with an antibody against the pericyte marker NG2 proteoglycan. Three-dimensional images were taken from the most superficial vascular plexus at the tips of the blood vessels from the region where vessels grow toward the optic nerve. (A) Representative images of WT and R-Ras KO blood vessel endothelial cells (red) surrounded by pericytes (green). (B) The majority of images from WT mice retina had a lot of pericytes around the blood vessels, whereas the majority of pictures taken from the KO retinal blood vessels were lacking or had very few pericytes. (C) Direct contact between endothelial cells and pericytes was quantified by colocalization analysis. The result is shown as a percentage of endothelial cell area colocalized with pericytes in WT and R-Ras KO retinal blood vessel tips. The pericyte coverage is significantly reduced in R-Ras KO animals compared to WT by 40% (P = 0.033, *). Error bars represent ± 95% confidence intervals. (WT: n = 15; R-Ras KO: n = 15. Two pictures were taken from each retina, and an average was calculated). The expression of VE-cadherin was studied in the OIR model by staining frozen cross-sections of retina with antibodies against VE-cadherin and endothelial cells (CD31). The intensity as well as the colocalization of VE-cadherin staining with endothelial cells was quantified using BioImageXD. (D) Representative images of VE-cadherin (green) and CD31 (red) in P17 OIR model in WT and R-Ras KO are presented. Colocalization analysis showed significant reduction in VE-cadherin and CD31 colocalization in R-Ras KO mice compared to WT mice (overlap coefficient according to Manders: r = 0.51 for WT and R = 0.43 for KO [P = 0.04]), n = 5 mice for WT and n = 5 mice for KO.
Figure 6
Figure 6
Reduced R-Ras expression correlates with leakage of human serum albumin in human diabetic retinopathy vasculature, and it is negatively correlated with VEGFR2 expression. Preretinal neovascular membranes obtained from vitrectomies from diabetic retinopathy patients were analyzed by immunohistochemistry for their protein expression. Immunohistochemical staining from adjacent sections was done with anti-CD31 + anti–R-Ras, anti-HSA, and anti–R-Ras + anti-VEGFR2 antibodies. The number of R-Ras–positive vessels was calculated from R-Ras and CD31 double-stained sections (n = 7; 5–9 different sections analyzed from each sample). Correlation analysis between R-Ras and VEGFR2 was done from R-Ras + VEGFR2 double-stained sections and compared to CD31 staining from adjacent sections (n = 7; 5–9 different sections analyzed from each sample). Vascular membranes with strong R-Ras expression show limited extravascular staining for HSA (A), whereas samples with weak R-Ras expression show strong staining for HSA outside the blood vessels (B). Scale bars: 100 μm. There is a strong inverse correlation between HSA-positive extravascular area and the percentage of R-Ras–positive neovessels (Spearman's ρ: r = −0.886, P = 0.019, *, R2 = 0.835, n = 6 patients) (D). (C) Approximately 20% of the neovessels do not express any R-Ras at all (R-Ras–positive vessels 81 ± 10%, mean + SD, n = 6 patients). Data are shown as a box plot with median and 95% confidence interval. (E, F) Double-staining for R-Ras and VEGFR2 shows an inverse correlation (Spearman's ρ: r = −0.821, P = 0.023, R2 = 0.563) between the number of R-Ras–expressing and VEGFR2-positive blood vessels. When a majority of blood vessels has R-Ras expression, a majority of blood vessels are negative for VEGFR2 expression, whereas the VEGFR2 expression is opposite when very few blood vessels express R-Ras. Scale bars: 200 μm.
Figure 7
Figure 7
Vascular leakage is mainly from blood vessels that do not express R-Ras in human diabetic retinopathy. The preretinal membranes from human diabetic retinopathy patients were either stained for CD31, double-stained for CD31 (green) and R-Ras (brown) or stained for HSA (brown). (A) Blood vessels in preretinal membranes stained for endothelial cells (CD31, brown). (B) Double-staining of blood vessels (CD31, green) and R-Ras (brown) expression. (C) Vascular leakage was determined by using an antibody against HSA (brown). Red boxes on figures on the left are presented as high magnification pictures on the right. (B and C) No vascular leakage (restricted HSA staining only inside the neovessels) can be seen around neovessels with strong R-Ras expression. Conversely, the blood vessels that do not express any R-Ras show aberrant vascular permeability around them. Arrows represent R-Ras–negative blood vessels. Scale bars on the left represent 450 μm and 200 μm on the right.

Similar articles

Cited by

References

    1. Ferrara N,, Davis–Smyth T. The biology of vascular endothelial growth factor. Endocr Rev. 1997; 18: 4–25. - PubMed
    1. Keck PJ,, Hauser SD,, Krivi G,, et al. Vascular permeability factor, an endothelial cell mitogen related to PDGF. Science. 1989; 246: 1309–1312. - PubMed
    1. Vinores SA,, Chan CC,, Vinores MA,, et al. Increased vascular endothelial growth factor (VEGF) and transforming growth factor beta (TGFbeta) in experimental autoimmune uveoretinitis: upregulation of VEGF without neovascularization. J Neuroimmunol. 1998; 89: 43–50. - PubMed
    1. Ford JA,, Lois N,, Royle P,, Clar C,, Shyangdan D,, Waugh N. Current treatments in diabetic macular oedema: systematic review and meta-analysis. BMJ Open. 2013; 3: e002269. - PMC - PubMed
    1. Arevalo JF,, Maia M,, Flynn HW, Jr,, et al. Tractional retinal detachment following intravitreal bevacizumab (Avastin) in patients with severe proliferative diabetic retinopathy. Br J Ophthalmol. 2008; 92: 213–216. - PubMed